Henan Key Laboratory of Crystalline Molecular Functional Materials, Henan International Joint Laboratory of Tumor Theranostical Cluster Materials, Green Catalysis Center, and College of Chemistry, Zhengzhou University, Zhengzhou 450001, China
b.
Henan Engineering Center of New Energy Battery Materials, Henan D&A Engineering Center of Advanced Battery Materials, College of Chemistry and Chemical Engineering, Shangqiu Normal University, Shangqiu 476000, China
c.
School of Materials Science and Engineering, State Key Laboratory of Green and Efficient Development of Phosphorus Resources, Engineering Research Center of Phosphorus Resources Development and Utilization of Ministry of Education, Key Laboratory of Green Chemical Engineering Process of Ministry of Education, Hubei Key Laboratory of Plasma Chemistry and Advanced Materials, Novel Catalytic Materials of Hubei Engineering Research Center, Wuhan Institute of Technology, Wuhan 430205, China
d.
Key Laboratory of Functional Materials Physics and Chemistry of the Ministry of Education, College of Physics, Jilin Normal University, Siping 136000, China
Received Date:
07 December 2025 Accepted Date:
08 February 2026 Revised Date:
05 February 2026 Available Online:
15 December 2026
Abstract:
Developing highly efficient and stable photocatalysts is of utmost significance for realizing solar-driven CO2 reduction. In this research, a palladium (Pd) nanocluster-decorated nitrogen-doped molybdenum dioxide (MoO2-N-Pd) composite was successfully synthesized. Systematic characterizations demonstrated that Pd nanoclusters were evenly anchored onto MoO3-N nanosheets, triggering a crystalline phase reconstruction from MoO3 to MoO2. Meanwhile, a substantial number of oxygen defects and nitrogen active sites were introduced. The fabricated MoO2-N-Pd composite exhibited excellent charge separation and transport capabilities. Density functional theory (DFT) calculations unveiled the incorporation of Pd significantly reduces the work function and band gap width of the material, effectively broadening its visible light absorption range. More crucially, a strong Pd-N bond was formed between Pd and N atoms, which not only optimizes the interface electronic structure of the material but also significantly lowers the energy barrier for the formation of key intermediate (*COOH). Additionally, the introduction of Pd elongates the C—O bond length of *COOH from 1.34 Å to 1.35 Å, creating favorable thermodynamic conditions for the dissociation of CO. As a result, MoO2-N-Pd displayed superior CO generation performance and stability compared to the initial material. This study comprehensively expounded on the synergistic mechanism of Pd nanocluster-induced phase transition and interface engineering in enhancing the CO2 photoreduction performance.
In the context of the accelerated implementation of global carbon neutrality strategies, solar-driven photocatalytic CO2 reduction technology, which can convert greenhouse gases into high-value-added fuels (such as CO, CH4), is regarded as one of the key paths to achieve a “zero-carbon” energy cycle [1-6]. Among various photocatalytic materials, molybdenum-based oxides (such as MoO3) have attracted widespread attention due to their layered structure that can be regulated and rich electronic structure [7-9]. However, the intrinsic MoO3 has inherent bottlenecks such as weak visible light absorption ability, slow carrier dynamics, as well as poor adsorption and activation performance of *COOH intermediate, which severely restrict the further improvement of its photocatalytic performance [10,11].
To overcome these bottlenecks, traditional modification strategies have developed multiple approaches, including catalyst loading, heterojunction construction, element doping and defect engineering [12-16]. Although these strategies have improved performance to some extent, most of them focus on macroscopic band engineering, while the precise control of interface interactions at the atomic and electronic scale have been ignored. Recent studies have demonstrated that the formation of Pd-N bonds offers distinct advantages over conventional Schottky junctions [17,18]. It can introduce Pd 4d-N 2p hybrid orbitals into the material’s band gap, effectively narrowing the band gap and extending the light absorption range. In addition, it leverages the synergistic interaction between the lone pair electrons of N and the empty d orbitals of Pd to optimize the adsorption configuration of key CO2 reduction intermediates (e.g., *COOH). This significantly lowers the energy barrier for C—O bond dissociation, thereby enhancing both the reaction kinetics and product selectivity. These findings suggest that using N-MoO3 as the carrier and under a suitable reducing atmosphere, it is expected to synthesize MoO2—N-Pd photocatalysts with Pd-N bond carrier transport channels, which is a promising strategy for achieving breakthroughs in photocatalytic performance [19,20].
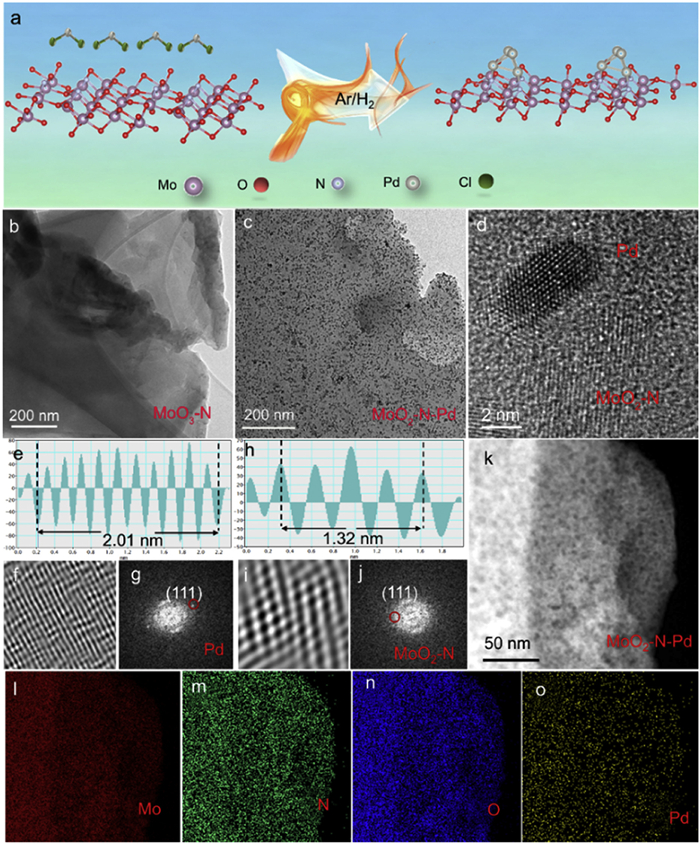
Building upon these insights, this study reports the successful synthesis of a Pd nanocluster-modified N-MoO2 photocatalyst (MoO2—N-Pd) via mechanically activated hydrogen reduction. MoO2—N-Pd (with the feed mass ratio 2.9 wt% Pd) achieves a CO production rate of 65.81 μmol g−1 h−1 (14 times that of MoO3—N) with high CO selectivity of ∼100%, and it can maintain 92% activity after 24 h, outperforming most reported Mo-based photocatalysts. The underlying mechanism of its enhanced photocatalytic CO2 reduction performance was systematically investigated. First, it is demonstrated for the first time that the introduction of Pd under an Ar/H2 atmosphere induces a phase transformation of MoO3 to the more catalytically active MoO2 (Fig. 1a), while concurrently generating abundant oxygen vacancies and nitrogen active sites. This facilitates the efficient separation and transport of photogenerated charge carriers. Second, through comprehensive characterization techniques including XPS and projected crystal orbital Hamilton population (pCOHP) analysis, a strong chemical interaction (Pd-N) between Pd and N is confirmed, establishing a stable “nitrogen bridge” that enables efficient interfacial electron redistribution and enhances charge carrier mobility. Finally, by integrating photoelectrochemical measurements with density functional theory (DFT) calculations, a complete mechanistic pathway is established. From extended light absorption and interface engineering to the reduced formation energy barrier of *COOH, elongates the C—O bond length of *COOH from 1.34 Å to 1.35 Å, providing a unified experimental and theoretical understanding of the catalytic enhancement [21,22]. This work presents a highly active and stable MoO2—N-Pd photocatalyst, and elucidates the mechanisms for performance improvement across electronic structure, charge carrier dynamics, and surface reaction. These findings can offer theoretical insights and practical guidance for the rational design of advanced photocatalytic materials aimed at carbon neutrality.
Figure 1
Figure 1.
(a) Synthesis process of MoO3-N-Pd. (b) TEM image of MoO3-N. (c) TEM image of MoO2-N-Pd. (d-j) High-resolution TEM (HR-TEM) images and corresponding Fourier transform patterns of MoO2-N-Pd. (k-o) EDS elemental mapping images of MoO2-N-Pd.
Fig. 1b shows the transmission electron microscopy (TEM) image of the MoO3—N sample. The pure-phase MoO3—N exhibits a typical nanosheet morphology, which provides a high specific surface area essential for the subsequent loading of active components and efficient mass transfer during photocatalytic reactions. Fig. 1c presents the TEM image of the MoO2—N-Pd composite. Clearly, Pd nanoparticles are uniformly dispersed on the surface of the MoO2—N nanosheets without significant agglomeration. The successful incorporation Pd nanoparticles not only introduces numerous catalytically active sites but also modulates the surface electronic structure, thereby facilitating the adsorption and activation of reactant molecules during photocatalysis, ultimately contributing to enhanced photocatalytic performance.
To further investigate the crystalline structure of the MoO2—N-Pd composite, high-resolution transmission electron microscopy (HRTEM) analysis was performed, with results shown in Figs. 1d–j. Two distinct sets of lattice fringes are clearly resolved: The lattice spacing of 0.23 nm corresponds to the (111) plane of metallic Pd [23], while the 0.28 nm spacing matches the (200) plane of MoO2 [24]. These observations provide direct evidence that both MoO2—N and Pd exist in a crystalline state within the composite and form a well-defined interfacial contact. Furthermore, energy-dispersive X-ray spectroscopy (EDS) elemental mapping Figs. 1k-o reveals uniform spatial distribution of Mo, N, O, and Pd across the nanosheet structure, with no signs of elemental enrichment or depletion. This result further confirms the successful and homogeneous loading of Pd nanoparticles onto the MoO2—N matrix, forming a compositionally uniform heterostructure. Such structural homogeneity lays a solid foundation for optimizing charge separation and transport efficiency [25].
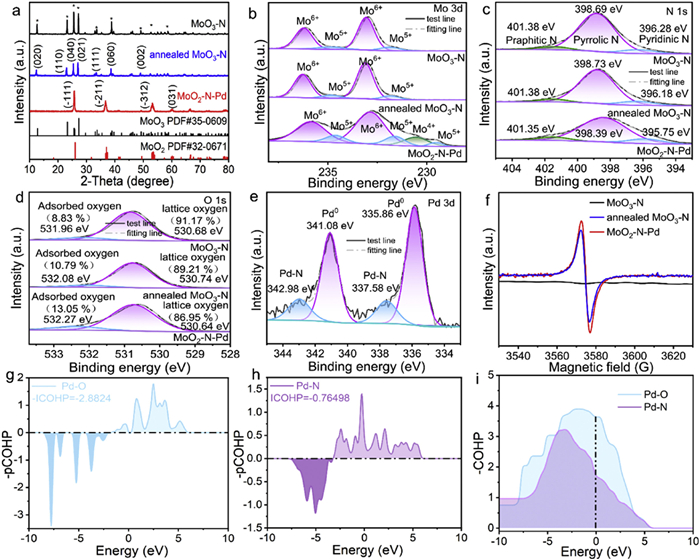
To elucidate the influence of Pd doping on the crystalline structure of the catalysts, X-ray diffraction (XRD) analysis was performed, and the results are presented in Fig. 2a. Both the undoped MoO3—N samples (initial and annealed) exhibit distinct diffraction peaks at 13°, 23°, 25°, 27°, 38°, and 49°, which can be indexed to the (020), (110), (040), (021), (060), and (002) crystal planes of orthorhombic MoO3 (PDF #35–0609), confirming its pure-phase MoO3 structure [26,27]. In contrast, after Pd nanocluster loading, the XRD pattern of MoO2—N-Pd undergoes significant changes: The characteristic peaks of MoO3 nearly disappear, and new diffraction peaks emerge at 26°, 36°, and 53°, which precisely match the (111), (211), and (312) planes of monoclinic MoO2 (PDF #35–0609). This result indicates that Pd incorporation not only modifies the surface but also induces a phase transformation of the support from Mo6+ (MoO3) to Mo4+ (MoO2). Such a structural reconstruction may endow the material with enhanced electronic conductivity and catalytic activity. To elucidate the elemental composition and chemical states of MoO3—N (initial and annealed) and MoO2—N-Pd samples, X-ray photoelectron spectroscopy (XPS) was systematically employed in this study, providing critical insights into the correlation between microscopic structure and catalytic performance. As shown in the survey XPS spectrum (Fig. S1 in Supporting information), characteristic signals corresponding to Pd, Mo, N, and O elements are clearly detected in the MoO2—N-Pd sample, with no detectable impurity peaks [24], which is fully consistent with the earlier EDS mapping results. High-resolution XPS analysis of key elements reveals that the Mo 3d spectra of both MoO3—N and annealed MoO3—N. Fig. 2b exhibits four distinct peaks: Binding energies at 231.8 and 234.8 eV are assigned to Mo5+ 3d5/2 and 3d3/2, respectively, while those at 233.1 and 236.2 eV correspond to Mo6+ 3d5/2 and 3d3/2, indicating that Mo exists in a mixed valence state of Mo5+ and Mo6+ in both samples, with Mo6+ being dominant [28,29]. Comparative analysis shows that the annealing under Ar/H2 atmosphere induces only slight reduction of Mo6+ to Mo5+, whereas the introduction of Pd nanoclusters significantly promotes further reduction of Mo6+ to Mo5+ and even Mo4+. Compared with MoO3—N, the content of Mo5+ species in MoO2—N-Pd is significantly reduced, and some Mo5+ is further reduced to Mo4+. This valence state transformation phenomenon is mainly attributed to the catalytic effect of Pd. Pd can act as an active site to effectively promote the electron transfer process and drive the transformation of Mo5+ to the lower valence state of Mo4+. In the N 1s HR-XPS spectrum (Fig. 2c), deconvolution identifies three nitrogen species-pyridinic N (≈398.69 eV), pyrrolic N (≈398.73 eV), and graphitic N (≈401.38 eV) [30] with negligible changes in peak shape or binding energy before and after annealing, confirming the stability of nitrogen chemical states during thermal treatment. The O 1s spectrum (Fig. 2d) allows clear differentiation between lattice oxygen (Olattice) and surface-adsorbed oxygen (Oads) [31,32]. Compared to pristine MoO3—N, the annealed sample exhibits a significant decrease in the integrated area of lattice oxygen and an increase in surface-adsorbed oxygen, with an even more pronounced enhancement observed in the MoO2—N-Pd sample. This result indicates a substantial increase in oxygen vacancy concentration during the transformation from MoO3—N to MoO2—N-Pd. In the Pd 3d spectrum (Fig. 2e), characteristic signals are observed for Pd-N 3d3/2 (342.98 eV), Pd0 3d3/2 (341.08 eV), Pd-N 3d5/2 (337.58 eV), and Pd0 3d5/2 (335.86 eV) [33], confirming the coexistence of chemically bonded Pd and metallic Pd clusters in MoO2—N-Pd. Furthermore, the EPR spectra in Fig. 2f show that MoO3—N has no obvious signal, while both annealed MoO3—N and MoO2—N-Pd exhibit a strong signal at g = 2.001, attributable to unpaired electrons localized for oxygen vacancies [34]. The intensity is significantly higher in MoO2—N-Pd, thus confirming a greater concentration of oxygen defects in this sample. To gain deeper insight into the interaction between Pd nanoclusters and O/N sites in MoO3—N, projected crystal orbital Hamilton population (pCOHP) analysis was performed. As illustrated in Figs. 2g-i, positive values in the -pCOHP curves represent bonding interactions, while negative values indicate antibonding contributions [35]. The integrated -pCOHP value for Pd-N (−0.76498) is significantly less negative than that for Pd-O (−2.8824), indicating stronger bonding character and a preferential formation of Pd-N bonds over Pd-O, thereby rationalizing the observed stabilization of Pd-N linkages in MoO2—N-Pd.
Figure 2
Figure 2.
(a-d) XRD patterns, Mo 3d, N 1s and O 1s XPS spectra of MoO3-N, annealed MoO3-N and MoO2-N-Pd. (e) Pd 3d XPS spectrum of MoO2-N-Pd. (f) EPR spectra of MoO3-N, annealed MoO3-N and MoO2-N-Pd. (g-i) pCOHP analysis of Pd-N and Pd-O interactions in MoO2-N-Pd.
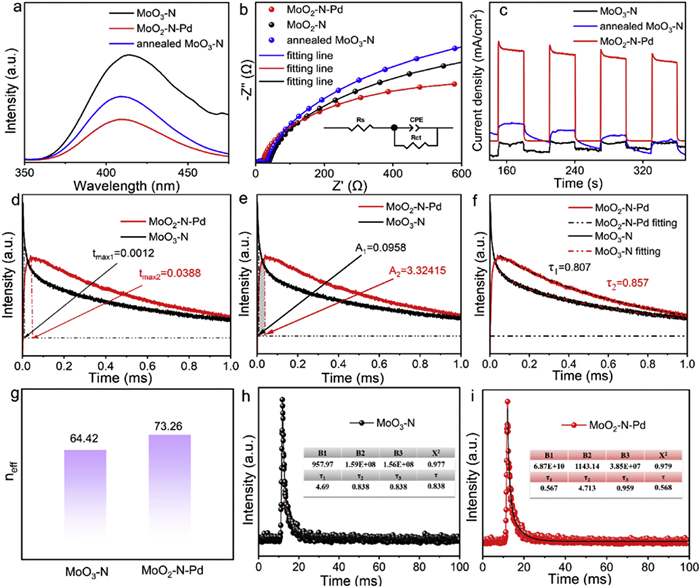
To systematically investigate the charge separation and transport properties of MoO3—N, annealed MoO3—N, and MoO2—N-Pd composites, a series of photoelectrochemical measurements and spectral analyses were employed for quantitative evaluation and mechanistic interpretation. Photoluminescence (PL) spectroscopy can analyze carrier recombination kinetics. As illustrated in Fig. 3a, under excitation at 268 nm, the PL emission peak at 413 nm for MoO2—N-Pd is markedly weaker than those of MoO3—N and annealed MoO3—N. Since PL intensity is directly proportional to the degree of electron-hole pair recombination, this suppression of luminescence suggests that the introduction of Pd nanoclusters establishes efficient charge transfer pathways, promoting rapid interfacial electron transfer between MoO3—N and Pd, thus effectively inhibiting carrier recombination [36]. Fig. 3b presents the electrochemical impedance spectroscopy (EIS), where the arc radius in the Nyquist plot is positively correlated with the interfacial charge transfer resistance. The inset shows the equivalent electrical circuit used to simulate the EIS Nyquist plots, where Rs denotes the electrolyte solution resistance, Rt represents the interfacial charge-transfer resistance, and CPE stands for the constant phase element [35]. Based on the above model, the fitting data of all samples are summarized in Table S1 (Supporting information). MoO2—N-Pd shows much smaller diameter, Rs and Rt value compared to MoO3—N and annealed MoO3—N, indicating a lower charge transfer resistance at the electrode/electrolyte interface, thereby facilitating rapid charge carrier transport. As shown in Fig. 3c, the transient photocurrent response curves exhibit a sharp increase upon illumination and a rapid return to baseline when the light is turned off for all samples, confirming excellent photo response speed and stability. Notably, the charge transfer behavior of MoO2—N-Pd composite materials exhibits significant enhanced features. The inherent N element in the original material can optimize the electronic structure of the material, lower the charge transfer energy barrier, and simultaneously provide charge carrier capture sites. The introduction of Pd serves as an efficient charge transfer bridge, further accelerating the charge transfer process at the interface. It effectively inhibits the recombination of photogenerated electron-hole pairs. To further validate the charge transport kinetics [37,38], linear sweep voltammetry (LSV) curves are displayed in Fig. S2 (Supporting information). Under identical applied potentials, MoO2—N-Pd delivers a significantly higher current density than MoO3—N and annealed MoO3—N, consistent with the trends observed in EIS and photocurrent responses. This result further confirms superior charge transport efficiency under bias, reinforcing the outstanding charge separation and transfer capability of MoO2—N-Pd [35]. To investigate the structure-activity relationship between photocatalytic performance and interfacial charge transfer dynamics of the prepared catalysts, transient photovoltage (TPV) measurements were conducted. As shown in Fig. 3d, the maximum charge extraction time (tmax) of MoO2—N-Pd is slightly longer than that of MoO3—N. However, Fig. 3e illustrates that MoO2—N-Pd has higher maximum charge extraction efficiency (A) of 3.32415 than that of MoO3—N (A = 0.0958), demonstrating that Pd modification substantially enhances charge extraction efficiency [39]. In addition, the electron decay constants in Fig. 3f reveals that the decay constant of MoO2—N (τ1 = 0.807) is slightly lower than that of MoO2—N-Pd (τ2 = 0.857), suggesting a longer electron lifetime in the latter, which facilitates the retention of more photogenerated electrons on the surface for proton reduction reactions [40]. In order to comprehensively evaluate the effective charge quantity of the catalyst, based on the equation of neff = A × τ /tmax [41], the effective charge carrier number (neff) was calculated for both samples. As displayed in Fig. 3g, the neff value of MoO2—N-Pd (73.26) is considerably higher than that of MoO3—N (64.42). This enhancement can be primarily attributed to the confined distribution of Pd nanoclusters on the MoO3—N surface, which effectively promotes the separation and migration of photogenerated carriers, thereby increasing the number of charges available for participation in photocatalytic reactions. Collectively, these TPV results confirm that a Pd-N charge transfer bridge plays a crucial role in enhancing the photocatalytic performance of molybdenum oxide-based semiconductors for CO2 reduction to CO [42]. To quantitatively assess the carrier lifetime, time-resolved photoluminescence (TR-PL) decay profiles were acquired for MoO3—N and MoO2—N-Pd in Figs. 3h and i. The average fluorescence lifetime of MoO2—N-Pd (0.838 ns) is notably shorter than that of MoO3—N. This reduction can be attributed to the formation of a Schottky heterojunction between MoO3—N and Pd, which efficiently captures photogenerated electrons, enabling their rapid transfer from MoO3—N to the Pd surface, thereby shortening the residence time of carriers in the host matrix and further suppressing recombination [36]. This finding is fully consistent with the results from EIS, photocurrent response, LSV, and steady-state PL analyses, collectively demonstrating that MoO2—N-Pd possesses superior charge separation and transport performance.
Figure 3
Figure 3.
(a-c) PL, EIS Nyquist plots and transient photocurrent response curves of MoO3-N, annealed MoO3-N, and MoO2-N-Pd. (d-g) tmax, charge extraction amount, decay constants and neff values of MoO3-N and MoO2-N-Pd from transient photoelectric voltage data. (h-i) TR-PL decay profiles of MoO3-N and MoO2-N-Pd.
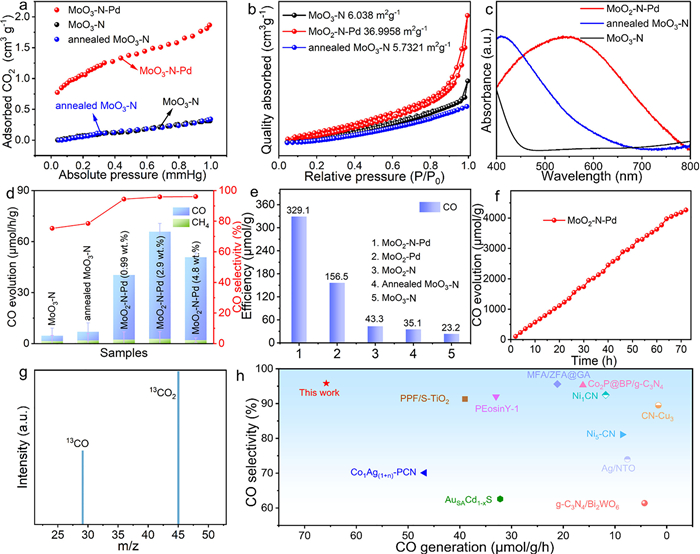
CO2 adsorption capacity is a critical factor influencing photocatalytic reduction efficiency. As shown in Fig. 4a, the CO2 adsorption amount of all three catalysts increases with rising pressure, but MoO2—N-Pd shows significantly higher adsorption capacity compared to MoO3—N and annealed MoO3—N. This trend aligns well with their respective photocatalytic activities, suggesting that the enhanced surface area and defect density induced by Pd incorporation collectively strengthen CO2 adsorption and activation capabilities [43]. The specific surface area and porous structure were further investigated via N2 adsorption-desorption measurements in Fig. 4b. The specific surface area of MoO3—N is only 6.038 m2/g, whereas that of MoO2—N-Pd increases to 36.996 m2/g, which is an enhancement of over five folds. This significant increase can be attributed to the synergistic effect between Pd nanocluster deposition and oxygen defect formation, which effectively expands the surface architecture, thereby providing more active sites for CO2 adsorption and reaction [44,45]. The ultraviolet-visible absorption spectrum (Fig. 4c) reveals that pure-phase MoO3—N exhibits weak light absorption in the visible region (400–760 nm), significantly limiting its solar light harvesting efficiency and, consequently, the generation of photogenerated electron-hole pairs [42]. Following annealing treatment, the visible-light absorption intensity of MoO3—N is slightly enhanced, primarily attributed to an increased concentration of oxygen vacancies formed during the process. These oxygen vacancies act as defect sites that modulate the material’s band structure, thereby extending its optical absorption range. Notably, the Pd-modified sample MoO2—N-Pd demonstrates not only a markedly broadened absorption range but also substantially enhanced absorption intensity across the visible spectrum. Crucially, no distinct local surface plasmon resonance (LSPR) peak characteristic of Pd is observed in the spectrum, suggesting that the Pd species are present as ultrafine nanoparticles without significant aggregation into larger Pd clusters. This well-dispersed, ultra-small Pd nanostructure contributes to an increased specific surface area of the catalyst, which aligns closely with the BET surface area analysis presented in Fig. 4b. This structural feature establishes a solid foundation for efficient solar energy utilization in photocatalytic applications. Moreover, photoluminescence (PL) spectroscopy using terephthalic acid (TA) as a probe molecule was employed to evaluate the separation and recombination behavior of photogenerated carriers. Under 315 nm excitation, TA reacts with generated ·OH radicals to form 2-hydroxyterephthalic acid, which emits a characteristic PL peak at 425 nm whose intensity is proportional to the ·OH concentration [43]. As illustrated in Fig. S3 (Supporting information), the PL signal at 425 nm for MoO2—N-Pd is markedly stronger than that of MoO3—N, indicating a higher ·OH production capacity upon Pd modification. This result further confirms that Pd acts as an efficient electron trapping center, suppressing electron-hole recombination and promoting carrier migration toward active sites, thus enhancing overall photocatalytic activity.
Figure 4
Figure 4.
(a-d) CO2 adsorption, N2 adsorption-desorption, UV–vis absorption spectra and CO, CH4 production efficiency diagram and CO selectivity of MoO3-N, annealed MoO3-N, MoO2-N-Pd (0.99 wt%), MoO2-N-Pd (2.9 wt%) and MoO2-N-Pd (4.8 wt%). (e) CO evolution profiles over MoO3-N, annealed MoO3-N, MoO2-N, MoO3-Pd, and MoO2-N-Pd samples within 5 h. (f) Photocatalytic activity of MoO2-N-Pd within 72 h. (g) Isotope labeling experiment using 13CO2 as the feedstock to identify reaction products. (h) Comparison of photocatalytic CO production activity with reported catalysts from the literatures.
The catalytic activity of the prepared samples was evaluated by the photocatalytic CO2 reduction reaction using triethanolamine (TEOA) as the hole scavenger. Fig. 4d shows the CO and CH4 yields of MoO3—N, annealed MoO3—N, and MoO2—N-Pd (0.99 wt%), MoO2—N-Pd (2.9 wt%) and MoO2—N-Pd (4.8 wt%). The results indicate that the CO and CH4 generation capabilities of MoO3—N and annealed MoO3—N are weak, which is directly related to their insufficient electron reduction ability. Under 300 W xenon lamp irradiation, the combination of MoO3—N with Pd significantly enhanced the CO and CH4 yields, among which MoO2—N-Pd (with the feed mass ratio of 2.9 wt%) exhibited the highest CO generation efficiency (65.81 μmol g−1 h−1) and 95.88% product selectivity, which was 14 times that of the original MoO3—N (4.61 μmol g−1 h−1). To determine the accurate doping amount of Pd, the content of Pd in each proportion sample was tested by inductively coupled plasma technology (ICP). As shown in Table S2 (Supporting information), when the input PdCl2 was 5 mg, 12.5 mg and 50 mg, the content of Pd was 0.51 wt%, 1.15 wt% and 2.36 wt%. The growth trend of Pd content is consistent with the theoretical feeding ratio. For convenient, the samples will be named based on the theoretical feeding ratio. Fig. 4e displays the CO evolution profiles within 5 h of illumination, the cumulative CO yield for MoO2—N-Pd reaches 329.1 μmol/g, significantly exceeding those of MoO3—N (23.2 μmol/g) and annealed MoO3—N (35.1 μmol/g). To analyze the role of Pd-N bonds in enhancing photocatalytic activity, MoO3—N was annealed in an Ar/H2 mixture with a higher H2 ratio (10%) to obtain MoO2—N sample. Additionally, Pd nanoparticles were deposited on MoO2 to obtain MoO2-Pd sample. As shown in Fig. S4 (Supporting information), both MoO2—N and MoO2-Pd samples present typical peaks at 26°, 36°, and 53° respectively, which precisely match the (111), (211), and (312) planes of monoclinic MoO2 (PDF #35–0609). XPS results illustrated (Fig. S5 in Supporting information) that the MoO2—N sample is mainly composed of Mo, O, and N elements. Among them, the characteristic peaks of Mo 3d at 231.18 and 229.24 eV correspond to Mo4+ and Mo5+ respectively. Compared with annealed MoO3, the valence state of Mo is significantly reduced. The MoO2-Pd sample is mainly composed of Mo, O and Pd, and the characteristic peaks of Mo 3d are consistent with those of MoO2, proving the successful preparation of MoO2—N and MoO2-Pd. Photocatalytic experiments indicated that the efficiency of MoO2—N (43.3 μmol/g) and MoO2-Pd (156.5 μmol/g) were much higher than MoO3—N (23.2 μmol/g) and annealed MoO3—N (35.1 μmol/g), but obviously lower than MoO2—N-Pd. This indicates that both phase conversion and Pd deposition are beneficial to the improvement of photocatalytic CO2 activity. Most importantly, the construction of the Pd-N bond electron transport bridge effectively suppresses the recombination of photogenerated carriers, this is the most important reason for the improvement of photocatalytic activity [46]. In addition, to analyze the significant roles of light conditions, catalyst and TEOA, as well as CO2 in the photocatalytic reduction, four sets of blank experiments were conducted. It can be seen in Fig. S6 (Supporting information) that once replacing CO2 with Ar, without adding MoO2—N-Pd catalyst, light irradiation or hole sacrificial agent (TEOA), the photocatalytic performance is almost trace, indicating that CO2, catalyst, light irradiation and the hole sacrificial agent all play important roles in the photocatalytic reduction of CO2. Stability is one of the core indicators for evaluating the practical application potential of a catalyst. To comprehensively investigate the stability of MoO2—N-Pd in the photocatalytic CO2 reduction to CO reaction, this paper conducts a systematic study by combining dynamic continuous reaction tests with structural characterizations before and after the reaction. As shown in Fig. 4f and Fig. S7 (Supporting information), during the continuous 72 h light reaction and four cycles’ photocatalysis, the amount of CO produced by this catalyst shows a stable linear growth trend without any obvious decline in catalytic activity, directly demonstrating its excellent catalytic durability and structural stability. In addition, the TEM, XRD and XPS characterization analysis after the photocatalytic reaction (Figs. S8-S10 in Supporting information) confirms that the morphology and structure of the samples almost remained unchanged after photocatalysis, indicating that the catalyst has good structural and photocatalytic performance stability. This provides direct structural evidence for its high stability under reaction conditions and further supports the feasibility of this catalyst in practical applications. The enhanced photocatalytic activity mainly results from the following respects: (1) In MoO2—N-Pd sample with 2.9 wt% Pd loading, the Pd species were highly dispersed on the MoO3—N support, forming ultra-small clusters with a size < 5 nm, and no aggregation was observed. (2) The formation of strong Pd-N chemical bonds between Pd and the nitrogen atoms of the support. This electronic interaction not only promoted the directional electron transfer from the MoO3—N matrix to the Pd active center, but also optimized the CO2 adsorption energy and reduced the reaction activation energy barrier by regulating the electronic state of Pd. (3) The coupling of Pd clusters significantly increased the number of efficient active sites and sunlight utilization rate, thereby maximizing the CO generation efficiency. When the Pd loading was low (0.99 wt%), the scarcity of Pd species led to insufficient active sites, limiting the adsorption, activation, and photogenerated charge transfer processes of CO2, resulting in poor catalytic performance. When the loading was further increased to 4.8 wt%, the CO yield decreased to 50.82 μmol g−1 h−1. This maybe because excess Pd species can aggregation into larger metal nanoparticles, which can weaken the interface electronic coupling between Pd and the support. In addition, excess Pd nanoparticles might become new recombination centers for photogenerated carriers. The combined effects ultimately led to decreased photocatalytic conversion efficiency of CO2 to CO.
To confirm the carbon source of the produced CO, an isotopic labeling experiment using 13CO2 as the feedstock was conducted, and the gaseous products were analyzed by nuclear magnetic resonance (NMR) spectroscopy (Fig. 4g). A signal peak corresponding to 13CO (molecular weight = 29) was detected in the product gas, unambiguously confirming that the carbon in CO originates entirely from the introduced CO2 atmosphere, ruling out contributions from carbon species within the catalyst or ambient environment. This provides direct evidence for the proposed photocatalytic CO2 reduction pathway [47]. To objectively evaluate the photocatalytic performance of MoO2—N-Pd, its CO generation rate was compared with that of 11 representative CO2 reduction catalysts (Fig. 4h). Detailed data are provided in Table S3 (Supporting information). The results show that the CO generation rate of MoO2—N-Pd is as high as 65.81 μmol g−1 h−1, which is significantly superior to the performance levels of the vast majority of the reported catalysts, fully demonstrating the outstanding photocatalytic CO2 reduction activity of MoO2—N-Pd in pure water systems.
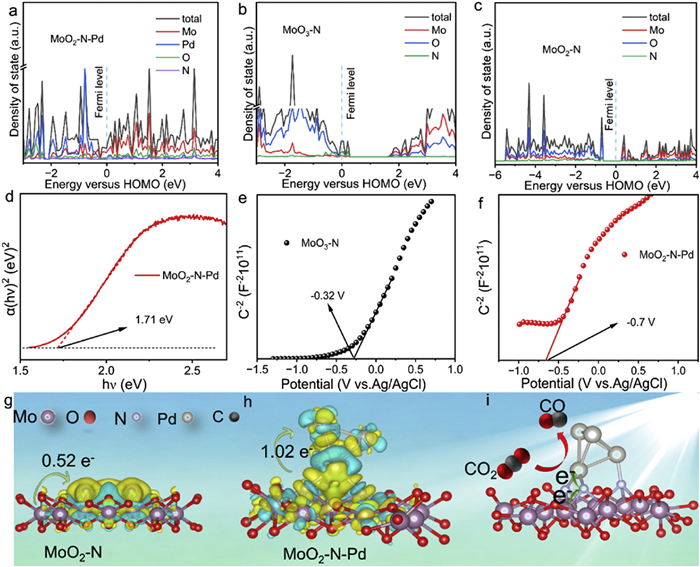
Further density functional theory (DFT) calculations reveal that the density of states (DOS) shown in Figs. 5a–c indicate a progressive narrowing of the band gap: MoO2—N-Pd < MoO2—N < MoO3—N [48-50]. This trend is attributed to interfacial electronic interactions and charge redistribution induced by Pd doping, providing electronic-structure-based evidence for enhanced photogenerated carrier separation efficiency. To experimentally corroborate the DFT predictions, ultraviolet-visible diffuse reflectance spectroscopy (UV–vis DRS) was performed. As shown in Fig. 5d and Fig. S11 (Supporting information), based on Tauc-plot analysis, the band-gap energies of pristine MoO3—N, annealed MoO3—N, and MoO2—N-Pd are 2.30, 2.99 and 1.71 eV, respectively. Annealing alone narrows the gap by 0.69 eV, whereas subsequent Pd incorporation induces an additional 0.59 eV reduction. This sequential contraction confirms that Pd doping systematically engineers the electronic structure, extends visible-light harvesting, and furnishes the optical foundation required for efficient photocatalysis. Mott-Schottky (M-S) measurements (Figs. 5e and f, Fig. S12 in Supporting information) reveal a monotonic negative shift of the flat-band potential (Efb). Relative to Ag/AgCl, Efb moves from −0.32 V for MoO3—N to −0.56 V after annealing and ultimately to −0.70 V for MoO2—N-Pd. According to semiconductor electrochemistry, each 0.1 V increment in negative Efb lowers the conduction-band minimum by the same extent, endowing photogenerated electrons with stronger reducing power. This cascade alignment of the band edges provides the thermodynamic driving force that underpins the superior activity of MoO2—N-Pd in photocatalytic CO2 reduction. Figs. 5g and h visualize the charge-density difference for MoO2—N and MoO2—N-Pd, respectively (yellow = accumulation, blue = depletion). Bare MoO2—N donates 0.52 e- from the MoO2 to the N sites (Fig. 5g). Upon Pd incorporation, directional electron flow along the newly formed Pd-N bonds funnels an additional 0.50 e- toward the Pd centers, raising the net transfer to 1.02 e- (Fig. 5h). This doubled electron reservoir supplies abundant active electrons for CO2 activation, lowers the reduction barrier, and thereby accelerates CO evolution (Fig. 5i). In-situ X-ray photoelectron spectroscopy (XPS) was employed to track the photo-induced charge flow in MoO2—N-Pd. The direction indicated by the arrow represents the direction of the change in binding energy. Under illumination, the Mo 3d peaks shift to higher binding energy while N 1s and Pd 3d move to lower binding energy (Fig. 6a and Fig. S13 in Supporting information). These antipodal shifts indicates that photogenerated electrons was shift from the MoO2 to Pd nanoclusters through Pd-N bond bridge, thereby cementing the critical role of directional charge separation in the MoO2—N-Pd architecture [51,52].
Figure 5
Figure 5.
(a-c) Density of states of MoO2-N-Pd, MoO3-N and MoO2-N. (d) Estimated band gap values derived from Tauc plots for MoO2-N-Pd. (e, f) Mott-Schottky plots of MoO3-N and MoO2-N-Pd. (g, h) The side view of the charge density difference and Bader charge of MoO2-N and MoO2-N-Pd. (i) Proposed photocatalytic mechanism of MoO2-N-Pd.
Figure 6.
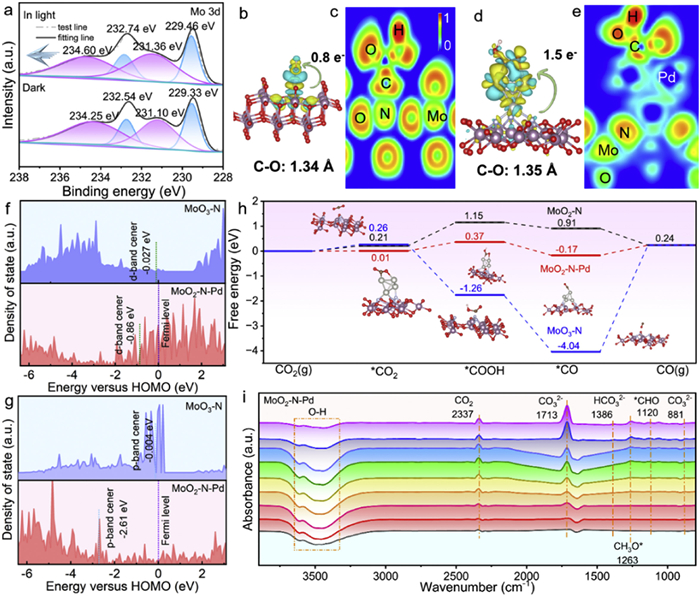
(a) In-situ XPS spectra of Mo 3d for MoO2-N-Pd under dark and light illumination. (b, d) Side-view representations of charge density difference and Bader charge analysis for *COOH adsorbed on MoO3-N (MoO3-N-*COOH), and MoO2-N-Pd (MoO2-N-Pd-*COOH), where yellow (cyan) area indicates electron accumulation (depletion). (c, e) Electron localization function (ELF) plots showing bonding characteristics of *COOH adsorbed on MoO3-N and MoO2-N-Pd. (f, g) Mo-3d and N-2p band centers of MoO3-N and MoO2-N-Pd relative to the Fermi level. (h) Calculated Gibbs free energies of key intermediates in the CO2 reduction reaction over MoO3-N, MoO2-N and MoO2-N-Pd photocatalysts. (i) In-situ FTIR spectroscopy of MoO2-N-Pd during CO2 reduction reaction.
To clarify the charge transfer behavior of the key intermediate *COOH during CO2 reduction, differential charge density distributions and the laterally averaged charge density difference along the z-direction were calculated for MoO3—N and MoO2—N-Pd, as shown in Figs. 6b and d, and Figs. S14a and b (Supporting information) [53,54]. Quantitative Bader charge analysis shows that the electron transfer from MoO2—N-Pd to *COOH reaches 1.5 e−, significantly exceeding that of MoO3—N (0.8 e−). This confirms that Pd incorporation substantially enhances the electron enrichment capability at active sites, providing sufficient electron supply for the stable adsorption and activation of the *COOH intermediate. To further elucidate the regulatory effect of Pd on the local electronic structure of MoO3—N, electron localization function (ELF) calculations were carried out for MoO3—N-*COOH and MoO2—N-Pd-*COOH, with results presented in Figs. 6c and e. The ELF plots clearly show that the degree of electron delocalization around *COOH in the MoO2—N-Pd-*COOH system is significantly higher than that in MoO3—N-*COOH. This indicates that Pd incorporation enhances the charge transfer capability from the catalyst to *COOH, thereby optimizing the interfacial electron transport pathway for CO2 reduction, establishing thermodynamic and kinetic advantages for the photocatalytic reaction [55]. Furthermore, to elucidate the regulatory effect of Pd nanoclusters on the electronic structure and catalytic activity, the N p-band center and Mo d-band center of the MoO3—N system before and after Pd incorporation were calculated and analyzed [56]. As illustrated in Fig. 6f, the Mo d-band center of MoO3—N is initially −0.027 eV and decreases to −0.86 eV after Pd introduction. Fig. 6g reveal that the N p-band center of MoO3—N is located at −0.004 eV, which shifts down to −2.61 eV upon Pd incorporation. These findings demonstrate that Pd incorporation significantly lowers both the N p-band and Mo d-band centers, indicating a strong electronic interaction between Pd and the host material. A lower band center promotes the downshift of anti-bonding states formed between reaction intermediates and the catalyst surface below the Fermi level. This electronic structure modulation not only optimizes the adsorption Gibbs free energy of the key intermediate (*COOH) in the CO2 reduction pathway, but also effectively reduces the activation barrier for *COOH formation, thereby establishing an electronic foundation for enhanced CO production performance [57,58]. To thermodynamically assess the promoting effect of Pd modification on photocatalytic performance, the Gibbs free energy changes for each step along the CO2 reduction pathway were theoretically calculated for MoO3—N, MoO2—N and MoO2—N-Pd (Fig. 6h). The results reveal that the adsorption of CO2 on MoO2—N-Pd has a positive Gibbs free energy change, indicating it’s an endothermic process [59]. Moreover, the formation of the *COOH intermediate is identified as the potential-determining step in the overall reaction. It is worth noting that under the same reaction conditions, the maximum Gibbs free energy increment along the reaction path for the MoO2—N-Pd catalyst is closer to zero. This indicates that this catalyst has a more balanced adsorption-desorption ability for various intermediates generated during the reaction process. Additionally, the introduction of Pd elongates the C—O bond length of *COOH from 1.34 Å to 1.35 Å, providing favorable thermodynamic conditions for the dissociation of carbon monoxide (CO). This favorable thermodynamic behavior is closely related to the excellent charge transfer properties of Pd nanoclusters, that is, Pd incorporation accelerates photogenerated charge separation and transfer, thereby further lowering the kinetic barrier for *COOH formation. This theoretical finding is in excellent agreement with the in situ XPS characterization and band center analysis, collectively confirming the critical role of Pd modification in enhancing the photocatalytic CO2 to CO conversion performance of MoO3—N catalysts.
In situ FTIR spectroscopy was employed to further systematically investigate the photocatalytic CO2 reduction mechanism over the MoO2—N-Pd catalyst. As illustrated in Fig. 6i, for in situ FTIR spectroscopy, the vertical axis denotes the absorption intensity. The upward characteristic peaks correspond to the absorption signals of the respective functional groups, whereas downward peaks reflect the consumption of the corresponding functional groups. Specifically, the characteristic peak centered at 3500 cm-1 is assigned to the stretching vibration of O—H bonds. Quantitative analysis of the spectral data reveals that the intensity of this peak decreases continuously with increasing light exposure time, which demonstrates the progressive consumption of O—H bonds during the photoreaction process [60]. In addition, the peak at 2337 cm-1 corresponds to the typical characteristic signal of gaseous CO2. The distinct band at 1386 cm−1 is unambiguously attributed to surface-adsorbed bicarbonate (HCO3−), indicating that the MoO2—N-Pd catalyst effectively captures both CO2 and H2O, which subsequently react on the catalyst surface to form HCO3− intermediates [61]. Additionally, the emergence of absorption bands at 1713 cm−1 and 881 cm−1 provides direct evidence for the formation of carbonate (CO32−) species during the reaction, originating from the interaction between adsorbed CO2 and H2O. Notably, the intensities of these CO32− related peaks progressively increase with prolonged irradiation time, suggesting continuous accumulation of this intermediate throughout the catalytic process [62]. Furthermore, strong signals at 1263 cm−1 and 1120 cm−1 are assigned to the out-of-plane bending vibration of the CH3O intermediate and the C=O stretching vibration (ν(C=O)) in the CHO species, respectively, thereby identifying key reactive intermediates involved in the pathway. Taken together, these in situ FTIR results elucidate the following reaction mechanism: CO2 and H2O molecules are initially adsorbed on the catalyst surface, under light irradiation, adsorbed CO2 undergoes stepwise activation and transformation via surface-bound CO32−, HCO3−, CHO, and CH3O intermediates, ultimately leading to the formation of CO and regeneration of H2O.
In this work, a Pd nanocluster-anchored MoO2—N-Pd composite photocatalyst was successfully synthesized, and the mechanism underlying its enhanced photocatalytic CO2 reduction performance was systematically elucidated. The introduction of Pd induces a phase transformation from MoO3 to MoO2, leading to the formation of oxygen vacancies and nitrogen-active sites. Moreover, the formation of Pd-N bonds narrows the band gap of photocatalyst from 2.3 eV to 1.71 eV, thereby extending visible-light absorption. This electronic modulation simultaneously lowers the energy barrier for *COOH formation and suppresses recombination of photogenerated carriers. Photocatalytic tests demonstrate that the CO evolution rate over MoO2—N-Pd (2.9 wt.%) reaches 65.81 μmol g−1 h−1, which is 14 times higher than that of MoO3—N with excellent stability over 24 h. Isotope labeling using 13CO2 confirms that the produced CO originates exclusively from CO2. This work provides a rational design strategy for highly efficient metal/metal oxide composite photocatalysts and offers valuable insights for the development of solar-driven CO2 conversion technologies.
The authors declare that they have no known competing financial interests or personal relationships that could have appeared to influence the work reported in this paper.
Acknowledgments
This work was supported by the National Natural Science Foundation of China (Nos. 22301172, 62004143), the Key Project of Scientific Research Plan of Hubei Provincial Department of Education (No. D20241501), the Natural Science Foundation of Henan for Excellent Young Scholars (No. 242300421140), the Key Research Programs in Universities of Henan Province (Nos. 25A150029, 26B350006), the Program for Science & Technology Innovation Talents in Universities of Henan Province (25HASTIT002), and Henan Provincial Natural Science Foundation (Nos. 252300421727, 242300420799, 242300420798). Eceshi (www.eceshi.com) was acknowledged for the TEM measurement.
Supplementary materials
Supplementary material associated with this article can be found, in the online version, at doi:10.1016/j.cclet.2026.112511.
Z. Zhang, G. Wen, D. Luo, et al., J. Am. Chem. Soc. 143 (2021) 6855–6864. doi: 10.1021/jacs.0c12418
[57]
X. Zu, Y. Zhao, X. Li, et al., Angew. Chem. Int. Ed. 60 (2021) 13840–13846. doi: 10.1002/anie.202101894
[58]
G. Qian, J. Li, H. Tan, et al., App. Catal. B: Environ. Energy 383 (2026) 12607.
[59]
C. Zhao, A. Zhou, H. Li, et al., Adv. Funct. Mater. 36 (2026) e19072. doi: 10.1002/adfm.202519072
[60]
T. Liang, J. Wei, S. Zhang, et al., J. Environ. Chem. Eng. 11 (2023) 109686. doi: 10.1016/j.jece.2023.109686
[61]
J. Dong, Y. Xu, X. Zhang, et al., Angew. Chem. Int. Ed. 62 (2023) e202313648. doi: 10.1002/anie.202313648
[62]
L. Liu, S. Zheng, H. Chen, et al., Angew. Chem. Int. Ed. 63 (2024) e202316910. doi: 10.1002/anie.202316910
Figure 1
(a) Synthesis process of MoO3-N-Pd. (b) TEM image of MoO3-N. (c) TEM image of MoO2-N-Pd. (d-j) High-resolution TEM (HR-TEM) images and corresponding Fourier transform patterns of MoO2-N-Pd. (k-o) EDS elemental mapping images of MoO2-N-Pd.
Figure 2
(a-d) XRD patterns, Mo 3d, N 1s and O 1s XPS spectra of MoO3-N, annealed MoO3-N and MoO2-N-Pd. (e) Pd 3d XPS spectrum of MoO2-N-Pd. (f) EPR spectra of MoO3-N, annealed MoO3-N and MoO2-N-Pd. (g-i) pCOHP analysis of Pd-N and Pd-O interactions in MoO2-N-Pd.
Figure 3
(a-c) PL, EIS Nyquist plots and transient photocurrent response curves of MoO3-N, annealed MoO3-N, and MoO2-N-Pd. (d-g) tmax, charge extraction amount, decay constants and neff values of MoO3-N and MoO2-N-Pd from transient photoelectric voltage data. (h-i) TR-PL decay profiles of MoO3-N and MoO2-N-Pd.
Figure 4
(a-d) CO2 adsorption, N2 adsorption-desorption, UV–vis absorption spectra and CO, CH4 production efficiency diagram and CO selectivity of MoO3-N, annealed MoO3-N, MoO2-N-Pd (0.99 wt%), MoO2-N-Pd (2.9 wt%) and MoO2-N-Pd (4.8 wt%). (e) CO evolution profiles over MoO3-N, annealed MoO3-N, MoO2-N, MoO3-Pd, and MoO2-N-Pd samples within 5 h. (f) Photocatalytic activity of MoO2-N-Pd within 72 h. (g) Isotope labeling experiment using 13CO2 as the feedstock to identify reaction products. (h) Comparison of photocatalytic CO production activity with reported catalysts from the literatures.
Figure 5
(a-c) Density of states of MoO2-N-Pd, MoO3-N and MoO2-N. (d) Estimated band gap values derived from Tauc plots for MoO2-N-Pd. (e, f) Mott-Schottky plots of MoO3-N and MoO2-N-Pd. (g, h) The side view of the charge density difference and Bader charge of MoO2-N and MoO2-N-Pd. (i) Proposed photocatalytic mechanism of MoO2-N-Pd.
Figure 6
(a) In-situ XPS spectra of Mo 3d for MoO2-N-Pd under dark and light illumination. (b, d) Side-view representations of charge density difference and Bader charge analysis for *COOH adsorbed on MoO3-N (MoO3-N-*COOH), and MoO2-N-Pd (MoO2-N-Pd-*COOH), where yellow (cyan) area indicates electron accumulation (depletion). (c, e) Electron localization function (ELF) plots showing bonding characteristics of *COOH adsorbed on MoO3-N and MoO2-N-Pd. (f, g) Mo-3d and N-2p band centers of MoO3-N and MoO2-N-Pd relative to the Fermi level. (h) Calculated Gibbs free energies of key intermediates in the CO2 reduction reaction over MoO3-N, MoO2-N and MoO2-N-Pd photocatalysts. (i) In-situ FTIR spectroscopy of MoO2-N-Pd during CO2 reduction reaction.


 DownLoad:

 下载:


 下载:

