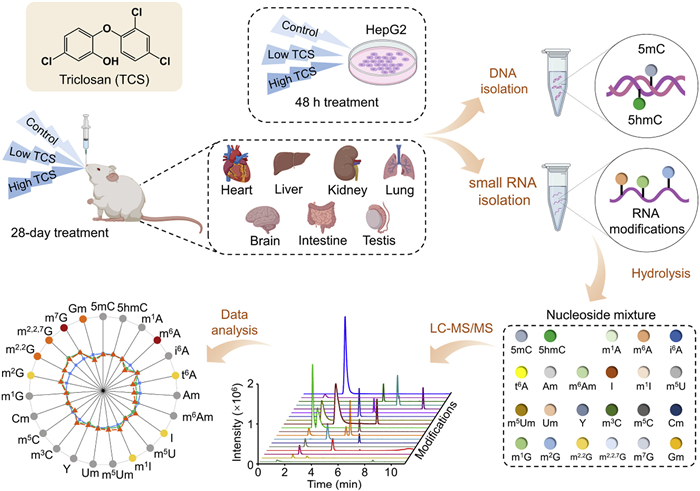
Figure 1.
TCS exposure schematic and mass spectrometric analysis of DNA and RNA modifications.

Multi-tissue profiling reveals disruptions in nucleic acid modification landscapes induced by the emerging environmental pollutant triclosan
Lu-Fei Shi , Yao-Hua Gu , Ting Liu , Tian Feng , Neng-Bin Xie , Yu Liu , Jianyuan Wu , Jun Xiong , Bi-Feng Yuan


Triclosan (TCS) is a synthetic chlorinated phenolic compound with broad-spectrum antimicrobial activity, first introduced in 1972 for medical and clinical applications [1]. Since then, TCS has been widely incorporated into personal care products, such as antibacterial soaps, toothpastes, hand sanitizers, and body washes, due to its potent antibacterial properties [2]. In the United States, TCS is regulated by the Food and Drug Administration (FDA) and the Environmental Protection Agency (EPA), with permissible concentrations ranging from 0.1% to 0.3% [3,4]. The global outbreak of COVID-19 has significantly increased public concern about hygiene and infection control, leading to a sharp rise in the production and use of disinfectant products, particularly those containing TCS [5]. As a result, TCS has become more prevalent than ever, raising concerns about its potential health risks and environmental impact. Increasing evidence has shown that TCS is linked to neurotoxicity, cardiac developmental abnormalities, and endocrine disruption, highlighting its broad toxic effects [6–8].
Nucleic acid modifications, including DNA and RNA modifications, have been demonstrated to exert pivotal functions in the regulation of gene expression, cellular differentiation, and adaptation to environmental changes [9–16]. 5-Methylcytosine (5mC), a prevalent DNA modification, modulates gene expression through its interactions with specific DNA-binding proteins and methylation-dependent transcription factors [17–22]. 5-Hydroxymethylcytosine (5hmC), an oxidative product of 5mC, is catalyzed by the ten-eleven translocation (TET) family proteins. 5hmC is regarded as an important epigenetic mark, playing a crucial role in various biological processes, including transcriptional activation, gene demethylation, and cellular differentiation [23–27]. Recent advances in the field of RNA modification research have highlighted N6-methyladenosine (m6A), the most abundant RNA modification, which is present in various RNA species, including mRNA, tRNA, rRNA, and miRNA [28–32]. m6A has become a focal point in epitranscriptomics, given its involvement in cellular development, stress responses, and disease progression, influencing RNA stability and protein translation [33–36]. Furthermore, abnormalities in other modifications also have been demonstrated to be closely linked to human diseases [37–41].
The escalating severity of environmental pollution has prompted considerable attention to the role of nucleic acid modifications in mediating the biological effects of pollutants [42]. Particularly, studies on heavy metals and emerging pollutants, such as perfluorinated chemicals, flame retardants, and phthalates, have gained considerable focus [43]. Heavy metals have been shown to result in a decrease in the levels of 5mC derivatives in the DNA and RNA of stem cells [44]. m6A has been implicated in cadmium-induced liver injury and manganese-induced cognitive dysfunction [45,46]. Moreover, perfluorooctanoic acid (PFOA), a persistent environmental endocrine disruptor, significantly alters DNA and RNA epigenetic modifications [47]. The expression of m6A is also closely linked to reproductive disorders induced by di(2-ethylhexyl)phthalate (DEHP) [48]. These findings underscore the pivotal role of nucleic acid modifications in mediating the effects of environmental pollution on health, thereby providing valuable insights into the toxicological mechanisms of pollutants and informing future environmental health studies and therapeutic interventions.
As an emerging pollutant, the toxicity of TCS has been increasingly explored. It has been demonstrated that TCS possesses reproductive toxicity, mediating the inhibition of autophagy and the suppression of testosterone biosynthesis in adult rats via m6A modification [49]. Prolonged exposure to TCS through diet increases the risk of liver tumorigenesis in mice [50]. Additionally, long-term low-dose exposure to TCS may impair ovarian function in female mice [51]. Further research across multiple mammalian models highlights the widespread toxicity of TCS, exacerbating skin inflammation, disrupting intestinal epithelial homeostasis, inducing neuroinflammation, and causing liver damage [52–55]. These results emphasize the extensive toxic effects of TCS on various organ systems. However, most prior research has concentrated on the toxic effects in individual organs or tissues, and there is limited understanding of how TCS exposure at varying concentrations affects multiple organs within a whole organism. Notably, previous studies have predominantly examined classical toxicity endpoints such as cell viability, oxidative stress, inflammatory responses, and apoptosis [56–58]. In contrast, there is a lack of investigation into its toxicological mechanisms from the perspective of environmental epigenetics, particularly regarding the comprehensive analysis of nucleic acid modification changes across multiple tissues in living organisms.
In the current study, liquid chromatography-tandem mass spectrometry (LC-MS/MS) was utilized to systematically analyze nucleic acid modification patterns of diverse tissues, including the heart, liver, kidneys, lungs, brain, intestine, and testis, in C57BL/6N mice, after exposure to varying concentrations of TCS (Fig. 1). This comprehensive profiling revealed tissue-specific alterations in both DNA and RNA modifications, suggesting a complex epigenetic response to TCS exposure. This study offered important scientific substantiation for health risk evaluation and prospective intervention tactics concerning environmental pollutants.
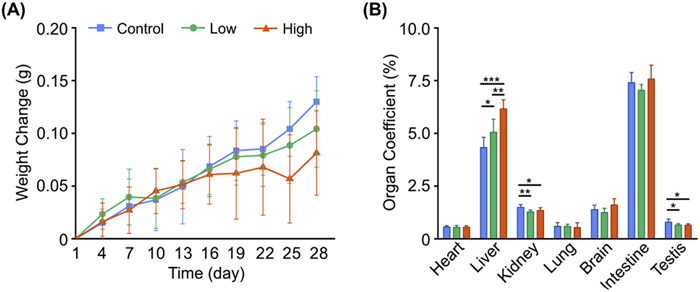
We first evaluated the influence of TCS treatment on mouse growth. A subacute TCS exposure model was established using 4-week-old male C57BL/6N mice. The mice were randomly divided into control, low, and high groups, which received 0, 50, and 200 mg kg−1 d−1 of TCS, respectively, via oral gavage. Although direct human exposure to TCS is relatively low, with the human daily intake and EPA reference dose reported as 30 and 300 µg kg−1 d−1, respectively [51], the corresponding mouse equivalent doses calculated based on body surface area conversion are 0.37 and 3.7 mg kg−1 d−1 [59]. In the present study, short-term exposure doses of 50 and 200 mg kg−1 d−1 were selected for mice to explore the potential toxicological mechanisms of TCS. These doses are consistent with those employed in previous toxicological investigations [49,50,54,60], ensuring methodological comparability and reliability of the findings. This experiment was approved by the Institutional Animal Care and Use Committee (IACUC) of Wuhan University Animal Experiment Center. During the 28-day treatment, the body weight of each mouse was recorded and the growth curves were plotted by calculating the average weight change for each group. The results showed differences in weight changes over time between the control and the treatment groups (Fig. 2A). Compared to the control group, mice in the high TCS group exhibited a noticeable slowdown in weight gain during the later stages of exposure, suggesting that TCS treatment may suppress growth. To further assess the impact of TCS on organ health, organ coefficients, defined as the ratio of organ weight to body weight, were measured (Fig. 2B). The results showed that the liver is the most susceptible organ to TCS-induced damage in mice. Notably, a significant increase in the organ coefficient of liver tissue was observed in the TCS-treated mice, indicating potential hepatomegaly. In contrast, the organ coefficients of the kidney and testis were significantly decreased after TCS treatment (Fig. 2B), suggesting potential dysfunction in the urinary and reproductive systems, consistent with previous findings [61–63].
We next investigated the influence of TCS on nucleic acid modifications. We first established the LC-MS/MS method to detect two types of DNA modifications including 5mC and 5hmC and 21 types of RNA modifications including N1-methyladenosine (m1A), m6A, N6-isopentenyladenosine (i6A), N6-threonylcarbamoyladenosine (t6A), 2-O-methyladenosine (Am), N6, 2′-O-dimethyladenosine (m6Am), inosine (I), 1-methylinosine (m1I), 5-methyluridine (m5U), 5,2′-O-dimethyluridine (m5Um), 2′-O-methyluridine (Um), pseudouridine (Y), 3-methylcytidine (m3C), 5-methylcytidine (m5C), 2′-O-methylcytidine (Cm), 1-methylguanosine (m1G), N2-methylguanosine (m2G), N2, N2-dimethylguanosine (m2,2G), N2, N2, 7-trimethylguanosine (m2,2,7G), 7-methylguanosine (m7G), and 2′-O-methylguanosine (Gm) (Fig. S1 and Table S1 in Supporting information). The optimized mass spectrometry parameters are summarized in Table S2 (Supporting information). Quantitative analysis of various nucleoside modifications in mouse tissues was performed using the standard curves. The calibration curves were generated by plotting the peak area ratios of nucleosides/rC-13C5 versus the amounts of nucleosides. The coefficients of determination (R2) are greater than 0.99, and the limits of detection (LODs) were 0.1−1.5 fmol (Tables S3 and S4 in Supporting information), showing that good linearity and sensitivity were obtained. Additionally, the relative errors (REs) and intra-day and inter-day relative standard deviations (RSDs) were employed to evaluate the accuracy and precision of the method. As shown in Tables S5 and S6 (Supporting information), the REs were between −9.6% and 6.5%, and the intra- and inter-RSDs were < 7.9%, indicating that the developed method has good accuracy and precision.
Using the established LC-MS/MS method, we next quantified 5mC and 5hmC in genomic DNA of mouse tissues (Figs. S2 and S3 in Supporting information). The enzymatic digestion of nucleic acids was carried out according to the previously reported procedures [64,65]. The results showed that the levels of 5mC were tissue-specifically distributed, with the highest 5mC levels (5mC/dC) in the heart and lung (4.0%) and the lowest 5mC in the liver (2.5%) (Fig. S4A in Supporting information). Similarly, the contents of 5hmC (5hmC/dC) were highest in the brain (0.570%) and lower in the testis (0.037%) and intestine (0.079%) (Fig. S4B in Supporting information). After TCS treatment, the levels of 5mC increased in the brain (P = 0.026) and intestine (P = 0.017), while they decreased in the kidney (P = 0.004) and testis (P = 0.017) (Fig. 3 and Fig. S4). Moreover, a reduction in 5hmC was observed after TCS treatment in the brain (P = 0.008), with no significant changes in other tissues (Fig. 3 and Fig. S4).
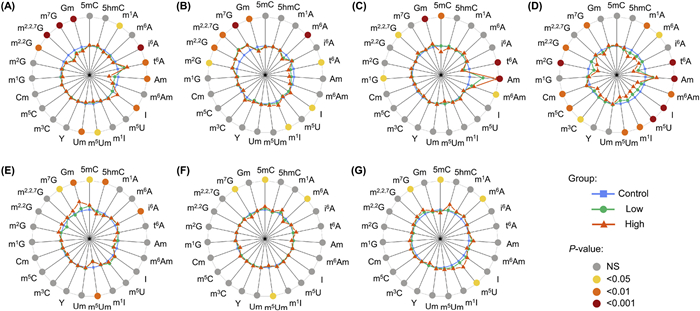
The LC-MS/MS method was then used to determine the levels of nucleoside modifications in small RNA (< 200 nt) across seven mouse tissues. The results showed that the 21 RNA modifications could be clearly detected in seven tissues (Figs. S5-S11 in Supporting information). The results indicated that the levels of RNA modifications varied significantly among different tissues (Fig. 3 and Figs. S12-S18 in Supporting information). After TCS exposure, a total of 11, 9, 6, 15, 4, 3, and 3 types of RNA modifications showed significant alteration in the heart, liver, kidney, lung, brain, intestine, and testis, respectively (Fig. 3). Specifically, in the heart tissue, the levels of t6A and I increased in both low and high TCS group (P < 0.05), while the levels of m1A, i6A, Am, m5Um, Um, m2,2G, m2,2,7G, m7G, and Gm decreased (P < 0.05) (Fig. 3A). In the liver, 9 modifications in small RNA showed significant alterations after TCS treatment compared to the control group, with I, m5U, m2G, m7G, m2,2G, and m2,2,7G increase, and m6A, t6A, and Gm decrease (Fig. 3B). In the kidney, the levels of Am, m6Am, m1G, m2,2,7G, and Gm increased significantly by TCS treatment, while t6A decreased (Fig. 3C). In the lung, a wide range of modifications were affected by TCS, with Am and Cm increase, and m1A, m6A, t6A, m6Am, I, m1I, m5U, m5Um, m3C, m5C, m2G, m2,2G, and m7G decrease (Fig. 3D). The extensive alterations in lung RNA modifications suggest that the lungs may be highly sensitive to TCS-induced epigenetic alterations. Fewer changes were observed in the brain, intestine, and testis upon TCS treatment (Figs. 3E–G). Tissue-specific alterations in DNA and RNA modifications induced by TCS may contribute to the tissue-specific accumulation of TCS and its metabolites, the expression of modification-related enzymes, and differential cellular metabolic rates—three key factors that collectively mediate TCS-induced tissue-selective toxicity [66–68].
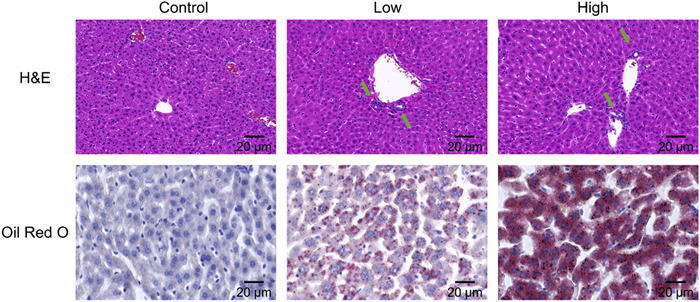
Subsequently, a histological analysis of liver tissues was performed to investigate whether TCS exposure induces liver damage. Hematoxylin and eosin (H&E) staining revealed that, in the control group, liver cells were arranged in a radiating pattern around the central vein, with no noticeable inflammatory cell infiltration. Compared to the control group, the TCS-treated groups exhibited slight abnormal clustering of liver cells, with mild nuclear deformation and shrinkage, suggesting possible infiltration of a small number of inflammatory cells and liver cell damage (Fig. 4). Besides, Oil Red O staining of the liver was also performed for lipid detection. Compared to the control group, the TCS-treated groups showed a significant increase in both the number and density of lipid particles. In addition, there were slight abnormalities in cell morphology, suggesting extensive lipid deposition within liver cells, resulting in hepatocyte enlargement, deformation, and even rupture (Fig. 4). Notably, the hepatotoxicity induced by TCS exposure is in accordance with previous studies, which may result from inflammatory responses in hepatocytes, compensatory liver tissue proliferation, and disrupted lipid metabolism [50,69]. TCS has also been reported to inhibit bile acid transporters, impairing bile excretion and contributing to bile duct dilation or hepatocellular hypertrophy [70]. Furthermore, toxic metabolic byproducts of TCS can induce oxidative stress and exacerbate lipid peroxidation of the hepatocyte membrane [71]. However, most of these studies have not addressed the underlying epigenetic mechanisms associated with TCS-induced liver injury.
To further elucidate the role of TCS on hepatic epigenetic modifications, a systematic analysis was conducted on the alterations in the correlation between DNA modifications and RNA modifications. The results revealed significant reorganization of the modification correlation network, with TCS interfering the epigenetic regulation between nucleic acid modifications (Fig. 5). A significant alteration was observed between m1A and m1G. In the control group, these two modifications demonstrated a robust positive correlation (r = 0.8). However, after TCS exposure, this correlation underwent a gradual attenuation, eventually exhibiting as a negative correlation in the low TCS group (r = −0.4) and further strengthening into a significant negative correlation in the high TCS group (r = −0.9). Furthermore, the relationship between m2,2G and Um also changed, with TCS exposure shifting their correlation from significantly negative to positively related. Notably, these correlation changes occurred not only between small RNA modifications but also affected the epigenetic interactions between DNA and RNA. For example, i6A and 5hmC exhibited a strong positive correlation (r = 0.9) in the control group, but in the high TCS group, it turned into a significantly negative correlation (r = −0.9).
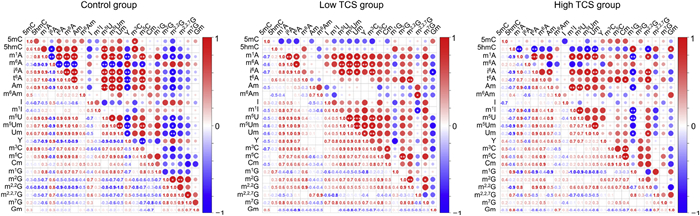
Previous studies have reported the important role of RNA m6A in lipid metabolism and inflammation [72–76]. Consequently, we focused on analyzing the correlation change of m6A. In the control group, m6A exhibited a stable negative correlation with 5mC and 5hmC, with the m6A-5hmC correlation being particularly significant (r = −0.9, Fig. 5). However, in the low TCS group, the m6A-5hmC correlation decreased (r = −0.1), suggesting that the body may have undergone stress or compensatory responses, potentially disrupting the normal functions of m6A methylases and demethylases. In the high TCS group, this correlation change was more pronounced, with the positive correlation between m6A and both 5mC and 5hmC being further strengthened. These results indicated that, as the exposure concentration increases, TCS may disrupt the balance of the DNA-RNA methylation network by modulating the expression and activity of methylation or demethylation enzymes, such as methyltransferase-like 3 (METTL3) and fat mass and obesity-associated protein (FTO). The specific mechanism underpinning this phenomenon merits further investigation. Combined with the histological staining analysis, we speculate that the hepatotoxic phenotypes, such as inflammatory cell infiltration and lipid accumulation in the liver, may be related to the imbalance of the m6A-DNA methylation network. Therefore, TCS-induced liver damage may be an accumulating, multi-layered process. Further studies will be conducted to investigate the specific role of m6A modification-related enzymes in TCS-induced hepatotoxicity.
Quantitative analysis demonstrated that the m6A levels in the liver tissues were significantly decreased after TCS treatment, with m6A/A decreasing from 1.225% in the control group to 1.048% (P < 0.05) and 0.975% (P < 0.01) in the low and high TCS groups, respectively (Fig. S13B in Supporting information). To further investigate the mechanism underlying the reduction in m6A levels, we analyzed the expression of m6A related genes, including m6A writer (Mettl3), erasers (Fto and Alkbh5), and reader (YTH N6-methyladenosine RNA binding protein F1, Ythdf1) (Table S7 in Supporting information). The results showed that in the high TCS group, Fto expression was significantly upregulated, while Ythdf1 expression was downregulated (Fig. S19 in Supporting information). The fluctuating expression of the m6A-related proteins indicated that TCS may disrupt the dynamic balance of m6A in the liver by enhancing m6A demethylation and attenuating m6A-mediated translational regulation. Previous studies have reported that TCS induces immunotoxicity in zebrafish via m6A downregulation [77]. Moreover, TCS has been demonstrated to induce m6A methylation abnormalities, which lead to lipid metabolism disorders in zebrafish [78]. However, the extant research remains largely limited to zebrafish models, with only a limited investigations exploring multi-organ epigenetic alterations in mammals.
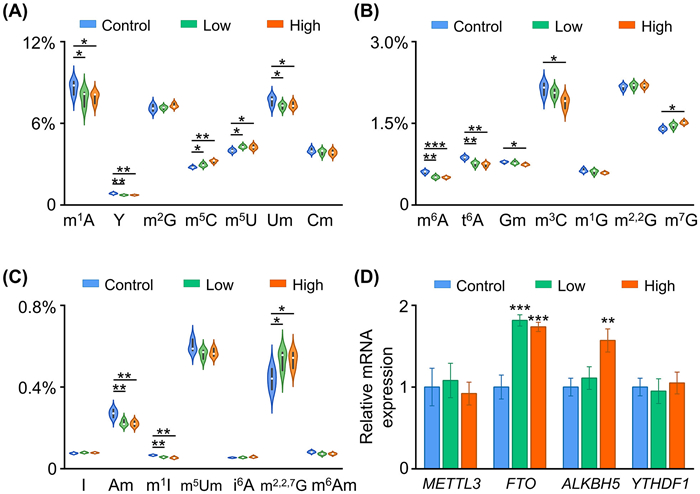
To further validate these findings, we examined RNA modifications and m6A-related enzyme expression in HepG2 cells following TCS exposure (Fig. S20 in Supporting information). Compared to liver tissue, TCS-treated HepG2 cells showed a greater variety of significant changes in small RNA modifications (Figs. 6A–C). In contrast to the liver tissue, an increased level of m5C was observed in HepG2 cells, while m1I, Um, m3C, m1A, Y, and Am exhibited a significant decrease. Notably, the trends of m5U, m2,2,7G, m7G, m6A, t6A, and Gm in HepG2 cells were consistent with those observed in liver tissue, with a particularly significant decrease in m6A (Figs. 6A–C). Furthermore, we analyzed the gene expression levels of m6A-related genes in TCS-treated HepG2 cells. The results showed that expression levels of the m6A demethylases genes of FTO and ALKBH5 were significantly upregulated after TCS treatment (Fig. 6D). In conjunction with the findings from liver tissue, we speculate that the upregulation of FTO plays a pivotal role in the reduction of m6A, thereby providing novel mechanistic insights into TCS-mediated RNA modification changes.
In conclusion, utilizing LC-MS/MS technology, this study systematically revealed the broad impacts of TCS exposure on DNA and RNA modifications across multiple mouse tissues from epigenetic perspective. At the organism level, TCS exposure significantly suppressed body weight gain and altered organ coefficients in the liver, kidneys, and testes, indicating potential impairment of multi-organ function. At the molecular level, we comprehensively profiled 23 types of nucleic acid modifications in multiple tissues, revealing distinct tissue-specific and modification-specific epigenetic responses. In-depth analysis of the liver revealed that TCS exposure induced inflammatory infiltration and lipid accumulation, accompanied by disruptions in RNA-RNA and DNA-RNA modification correlation networks. Furthermore, the upregulation of the m6A demethylase FTO suggests its potential role in m6A dysregulation and TCS-induced liver toxicity. Future research should combine molecular, histological, and clinical data to fully evaluate the health risks associated with TCS exposure and to provide scientific evidence for environmental risk assessment.
Lu-Fei Shi: Writing – original draft, Methodology, Formal analysis, Data curation, Conceptualization. Yao-Hua Gu: Methodology, Formal analysis, Data curation. Ting Liu: Formal analysis, Data curation, Conceptualization. Tian Feng: Methodology, Formal analysis, Data curation. Neng-Bin Xie: Formal analysis, Data curation. Yu Liu: Data curation. Jianyuan Wu: Writing – review & editing, Formal analysis, Data curation, Conceptualization. Jun Xiong: Writing – review & editing, Methodology, Funding acquisition, Formal analysis, Conceptualization. Bi-Feng Yuan: Writing – review & editing, Supervision, Methodology, Investigation, Funding acquisition, Formal analysis, Conceptualization.
The authors declare that they have no known competing financial interests or personal relationships that could have appeared to influence the work reported in this paper.
The work is supported by the National Key R&D Program of China (Nos. 2022YFA0806600 and 2022YFC3400700), the National Natural Science Foundation of China (Nos. 22574125, 22207090, 22277093), and the Joint Fund of the Natural Science Foundation of Hubei Province, China (No. 2024AFD101).
Supplementary material associated with this article can be found, in the online version, at doi:
L.M. Weatherly, J.A. Gosse, J. Toxicol. Environ. Health B: Crit. Rev. 20 (2017) 447–469. doi: 10.1080/10937404.2017.1399306
A.G. Asimakopoulos, M. Elangovan, K. Kannan, Environ. Sci. Technol. 50 (2016) 13539–13547. doi: 10.1021/acs.est.6b04128
G.S. Dhillon, S. Kaur, R. Pulicharla, et al., Int. J. Environ. Res. Public Health 12 (2015) 5657–5684. doi: 10.3390/ijerph120505657
J.E. Coia, G.J. Duckworth, D.I. Edwards, et al., J. Hosp. Infect. 63 (Suppl. 1) (2006) S1–S44.
X. Chen, L. Mou, J. Qu, L. Wu, C. Liu, Sci. Total Environ. 879 (2023) 163068. doi: 10.1016/j.scitotenv.2023.163068
S. Zhao, Y. Ling, B. Zhang, D. Wang, L. Sun, Ecotoxicol. Environ. Saf. 290 (2025) 117537. doi: 10.1016/j.ecoenv.2024.117537
Y. Liu, C. Wang, Z. Fu, et al., Environ. Sci. Ecotechnol. 24 (2025) 100543. doi: 10.1016/j.ese.2025.100543
Z. Li, H. Xian, X. Ren, et al., Environ. Health 2 (2024) 424–440. doi: 10.1021/envhealth.4c00045
P.J. McCown, A. Ruszkowska, C.N. Kunkler, et al., Wiley Interdiscip. Rev. RNA 11 (2020) e1595. doi: 10.1002/wrna.1595
Z.D. Smith, S. Hetzel, A. Meissner, Nat. Rev. Genet. 26 (2025) 7–30. doi: 10.1038/s41576-024-00760-8
W.X. Shao, J. Wu, G. Li, et al., Chin. Chem. Lett. 36 (2025) 110747. doi: 10.1016/j.cclet.2024.110747
Y. Feng, Y.Q. Tian, Y.Q. Zhao, S.J. Chen, B.F. Yuan, Chin. Chem. Lett. 35 (2024) 109656. doi: 10.1016/j.cclet.2024.109656
J. Xiong, J. Wu, Y. Liu, Y.J. Feng, B.F. Yuan, TrAC-Trends Anal. Chem. 172 (2024) 117606. doi: 10.1016/j.trac.2024.117606
J. Xiong, K.K. Chen, N.B. Xie, et al., Chin. Chem. Lett. 35 (2024) 108953. doi: 10.1016/j.cclet.2023.108953
Y.H. Gu, Y. Chen, Q. Li, et al., Chin. Chem. Lett. 35 (2024) 109627. doi: 10.1016/j.cclet.2024.109627
C.J. Ma, G. Li, W.X. Shao, et al., ACS Cent. Sci. 9 (2023) 1799–1809. doi: 10.1021/acscentsci.3c00481
C. Luo, P. Hajkova, J.R. Ecker, Science 361 (2018) 1336–1340. doi: 10.1126/science.aat6806
W. Liu, Z.C. Ma, S. Zhang, et al., Chem. Sci. 16 (2025) 8788–8799. doi: 10.1039/d5sc01211b
S. Zhang, N.B. Xie, L. Zeng, et al., Chem. Sci. 16 (2025) 14800–14810. doi: 10.1039/d5sc03634h
L. Zeng, F.Y. Gang, T.T. Ji, et al., Chin. J. Chem. 43 (2025) 1797–1805. doi: 10.1002/cjoc.70044
M. Wang, N.B. Xie, F.Y. Gang, et al., Sci. China Life Sci. 68 (2025) 2303–2315. doi: 10.1007/s11427-024-2702-8
F.Y. Gang, N.B. Xie, M. Wang, et al., Anal. Chem. 96 (2024) 20559–20567. doi: 10.1021/acs.analchem.4c05030
E. Kriukiene, M. Tomkuviene, S. Klimasauskas, Chem. Soc. Rev. 53 (2024) 2264–2283. doi: 10.1039/d3cs00858d
X. Guo, J. Wu, T.T. Ji, et al., Chem. Sci. 16 (2025) 3953–3963. doi: 10.1039/d4sc08660k
N.B. Xie, M. Wang, W. Chen, et al., ACS Cent. Sci. 9 (2023) 2315–2325. doi: 10.1021/acscentsci.3c01131
S. Zhang, Y. Liang, T. Feng, et al., CCS Chem. 7 (2025) 3331–3348. doi: 10.31635/ccschem.025.202405023
N.B. Xie, M. Wang, T.T. Ji, et al., Chem. Sci. 15 (2024) 10073–10083. doi: 10.1039/d4sc00930d
W.V. Gilbert, T.A. Bell, C. Schaening, Science 352 (2016) 1408–1412. doi: 10.1126/science.aad8711
K. Boulias, E.L. Greer, Nat. Rev. Genet. 24 (2023) 143–160. doi: 10.1038/s41576-022-00534-0
Y.H. Min, W.X. Shao, Q.S. Hu, et al., Anal. Chem. 96 (2024) 8730–8739. doi: 10.1021/acs.analchem.4c01022
X. Guo, N.B. Xie, W. Chen, et al., Anal. Chem. 96 (2024) 847–855. doi: 10.1021/acs.analchem.3c04457
X.M. Tang, T.T. Ye, X.J. You, et al., Chin. Chem. Lett. 34 (2023) 107531. doi: 10.1016/j.cclet.2022.05.045
Y. Yang, P.J. Hsu, Y.S. Chen, Y.G. Yang, Cell Res. 28 (2018) 616–624. doi: 10.1038/s41422-018-0040-8
H. Huang, H. Weng, J. Chen, Cancer Cell 37 (2020) 270–288. doi: 10.1016/j.ccell.2020.02.004
M. Frye, B.T. Harada, M. Behm, C. He, Science 361 (2018) 1346–1349. doi: 10.1126/science.aau1646
W.X. Shao, Y.H. Min, W. Chen, et al., Anal. Chem. 95 (2023) 10588–10594. doi: 10.1021/acs.analchem.3c00502
H.X. Sun, K. Li, C. Liu, C.Q. Yi, Nat. Rev. Mol. Cell Biol. 24 (2023) 714–731. doi: 10.1038/s41580-023-00622-x
K. Shi, X. Hong, D. Xu, et al., Chin. Chem. Lett. 36 (2025) 110079. doi: 10.1016/j.cclet.2024.110079
C. Guo, X. Zhang, X. Hong, et al., Chin. Chem. Lett. 35 (2024) 108867. doi: 10.1016/j.cclet.2023.108867
X.J. You, L. Li, T.T. Ji, et al., Chin. Chem. Lett. 34 (2023) 107181. doi: 10.1016/j.cclet.2022.01.074
W.B. Tao, N.B. Xie, Q.Y. Cheng, Y.Q. Feng, B.F. Yuan, Chin. Chem. Lett. 34 (2023) 108243. doi: 10.1016/j.cclet.2023.108243
T. Feng, S.Y. Gu, L.F. Shi, Y.H. Gu, B.F. Yuan, Chin. Chem. Lett. 36 (2025) 111546.
K.Y. Yuan, Y.H. Gu, Y.H. Pei, et al., J. Hazard. Mater. 486 (2025) 136970. doi: 10.1016/j.jhazmat.2024.136970
J. Xiong, X. Liu, Q.Y. Cheng, et al., ACS Chem. Biol. 12 (2017) 1636–1643. doi: 10.1021/acschembio.7b00170
W. Li, M. Tan, H. Wang, et al., Environ. Pollut. 331 (2023) 121887. doi: 10.1016/j.envpol.2023.121887
Y. Wen, Z. Fu, J. Li, et al., J. Hazard. Mater. 476 (2024) 134969. doi: 10.1016/j.jhazmat.2024.134969
S.Y. Gu, T. Feng, F.Y. Gang, et al., Chin. Chem. Lett. 36 (2025) 110957. doi: 10.1016/j.cclet.2025.110957
T.X. Zhao, J.K. Wang, L.J. Shen, et al., Environ. Pollut. 259 (2020) 113911. doi: 10.1016/j.envpol.2020.113911
J. Sang, Z. Ji, H. Li, et al., Environ. Int. 190 (2024) 108827. doi: 10.1016/j.envint.2024.108827
Z. Wang, X. Li, J.E. Klaunig, Regul. Toxicol. Pharmacol. 86 (2017) 137–147. doi: 10.1016/j.yrtph.2017.03.001
H. Gan, Y. Jiang, L. Wu, et al., Environ. Pollut. 372 (2025) 125966. doi: 10.1016/j.envpol.2025.125966
M.C. Schuppe, P. Porebski, K.K. Hahn, et al., J. Dermatol. Sci. 118 (2025) 1–8.
X. Cheng, H. Shen, W. Zhang, et al., J. Hazard. Mater. 479 (2024) 135734. doi: 10.1016/j.jhazmat.2024.135734
Z. Wei, X. Ni, H. Cui, et al., Sci. Total Environ. 942 (2024) 173739. doi: 10.1016/j.scitotenv.2024.173739
Y. Peng, H. Cui, C. Shu, et al., Ecotoxicol. Environ. Saf. 273 (2024) 116115. doi: 10.1016/j.ecoenv.2024.116115
S. Deng, C. Li, J. Chen, et al., Sci. Total Environ. 905 (2023) 167053. doi: 10.1016/j.scitotenv.2023.167053
J. An, H. He, W. Yao, et al., Environ. Int. 136 (2020) 105428. doi: 10.1016/j.envint.2019.105428
F. Liu, Y. Zhang, F. Wang, Environ. Toxicol. 37 (2022) 848–857. doi: 10.1002/tox.23448
M.D. Rockville, Center Drug Evaluat. Res. (2005)
Z. Lan, T. Hyung Kim, K. Shun Bi, X. Hui Chen, H. Sik Kim, Environ. Toxicol. 30 (2015) 83–91. doi: 10.1002/tox.21897
W. Huang, G. Cao, C. Deng, et al., J. Environ. Sci. 124 (2023) 481–490. doi: 10.1016/j.jes.2021.11.032
M.F. Yueh, K. Taniguchi, S. Chen, et al., Proc. Natl. Acad. Sci. U. S. A. 111 (2014) 17200–17205. doi: 10.1073/pnas.1419119111
Y. Qiao, J. He, P. Han, et al., Sci. Total Environ. 826 (2022) 154026. doi: 10.1016/j.scitotenv.2022.154026
Y.Y. Chen, Z. Gui, D. Hu, et al., Chin. Chem. Lett. 35 (2024) 108522. doi: 10.1016/j.cclet.2023.108522
T. Feng, Y.L. Gao, D. Hu, et al., Chin. Chem. Lett. 35 (2024) 109259. doi: 10.1016/j.cclet.2023.109259
G. Lian, S. Chen, J. Chen, et al., J. Agric. Food Chem. 73 (2025) 30714–30725. doi: 10.1021/acs.jafc.5c11253
D.M. Toth, F. Szeri, M. Ashaber, et al., Epigenetics Chromatin 18 (2025) 5. doi: 10.14232/belv.2025.4.1
H. Shi, J. Wei, C. He, Mol. Cell 74 (2019) 640–650. doi: 10.1016/j.molcel.2019.04.025
W. Huang, P. Xie, Z. Cai, J. Hazard. Mater. 384 (2020) 121310. doi: 10.1016/j.jhazmat.2019.121310
Y. Song, C. Zhang, H. Lei, et al., Sci. Total Environ. 838 (2022) 156570. doi: 10.1016/j.scitotenv.2022.156570
M. Liu, W. Ai, L. Sun, et al., Comp. Biochem. Physiol. C-Toxicol. Pharmacol. 222 (2019) 108–117. doi: 10.1016/j.cbpc.2019.04.016
X. Zhong, J. Yu, K. Frazier, et al., Cell Rep. 25 (2018) 1816–1828.e4. doi: 10.1016/j.celrep.2018.10.068
Y.S. Zhang, Z.Y. Liu, Z.Y. Liu, et al., Int. Immunopharmacol. 134 (2024) 112222. doi: 10.1016/j.intimp.2024.112222
Q. Li, S. Wen, W. Ye, S. Zhao, X. Liu, J. Neuroinflammation 18 (2021) 149. doi: 10.1186/s12974-021-02205-z
X.Y. Pan, C. Huang, J. Li, Int. J. Biol. Sci. 17 (2021) 271–284. doi: 10.7150/ijbs.50003
Y. Wang, Y. Wang, J. Gu, et al., Front. Endocrinol. 13 (2022) 866116. doi: 10.3389/fendo.2022.866116
Q. Qian, Q. Pu, X. Li, et al., Chemosphere 352 (2024) 141395. doi: 10.1016/j.chemosphere.2024.141395
L. Sun, M. Gao, Q. Qian, et al., Sci. Total Environ. 770 (2021) 145285. doi: 10.1016/j.scitotenv.2021.145285

Figure 1 TCS exposure schematic and mass spectrometric analysis of DNA and RNA modifications.

Figure 2 Effects of TCS exposure on body weights and organ coefficients in mice. (A) Effects of TCS exposure on body weight changes in mice. (B) Effects of TCS exposure on organ coefficients. * P < 0.05, ** P < 0.01, *** P < 0.001.

Figure 3 Effects of TCS exposure on DNA and small RNA modification levels in mouse tissues. (A) Heart; (B) Liver; (C) Kidney; (D) Lung; (E) Brain; (F) Intestine; (G) Testis.

Figure 5 Correlation changes in DNA and RNA modifications in the liver due to TCS exposure.

Figure 6 TCS-mediated changes in small RNA modification patterns and m6A-modifying enzyme expression in HepG2 cells. (A-C) Alterations in small RNA modification levels following treatment with different concentrations of TCS. (D) Relative expression levels of m6A-related regulatory enzyme genes.

 扫一扫看文章


扫一扫关注我们
 DownLoad:
 下载:
下载:

 下载:
下载: