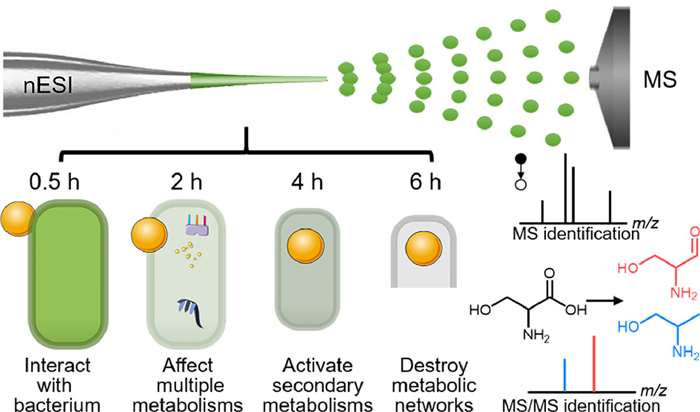
Scheme 1.
Schematic illustration of the operation mechanism of nESI-MS and the interaction between AGNPs and bacteria over different time points by nESI-MS for in-depth exploration of antibacterial mechanisms.

Analysis of antimicrobial gold nanoparticle-treated bacterial metabolites using nano-electrospray ionization mass spectrometry
Dong Wu , Wenfu Zheng , Ting Lin , Youhuan Gong , Yu Zhou , Xinglong Yang , Le Wang


The emergence of drug resistance accelerates the spread and mutation of bacteria [1,2], amplifying the risk of new infectious diseases and presenting a great challenge to human health [3,4]. Gold nanomaterials, as a new group of novel antibacterial agents, are promising in reducing the risk of bacterial resistance [5–8]. However, the practical use of gold nanomaterials is constrained by the lack of a comprehensive and unified analysis and verification of their antibacterial mechanisms. Therefore, the development of a new method to analyze the antibacterial mechanism of gold nanomaterials is urgent. In previous study, we developed aminobenzeneboronic acid (ABA)-modified gold nanoparticles (AGNPs) with exceptional potent antibacterial activity against multidrug-resistant (MDR) bacteria, through mechanisms such as cell wall disruption, membrane permeability alteration, and bacterial metabolism interference [9,10]. However, the interaction between gold nanomaterials and bacteria is a complex process concerning multiple aspects of influence on bacterial metabolism [11,12], which is a conundrum for present analyzing methods. The method using optical microscopy for characterizing nanoparticle-bacterium interactions is limited by light wavelength, restricting visualization of molecular features like proteins, lipids, and polysaccharides [13]. Moreover, the required labeling pretreatment may alter the molecular behaviors of biomolecules and compromise analysis accuracy [14].
Over the past decades, mass spectrometry (MS) has become a powerful tool for analyzing large and nonvolatile molecules, particularly those of biochemical interest [15,16], ranging from small metabolites to large molecules such as proteins [17–19]. It has greatly advanced life science research and enhanced understanding of antimicrobial mechanisms by enabling highly sensitive, rapid, and accurate metabolomic analysis [20,21]. Compared with gas chromatography-MS, electrospray ionization mass spectrometry (ESI-MS) avoids separation pretreatment, reduces sample information loss, and enables soft ionization of complex biological samples with high specificity [22,23]. Despite these advantages, challenges persist, particularly in enhancing detection sensitivity and accuracy, as the use of extractants like methanol could compromise the integrity of living biological samples. In previous work, we developed an online ESI-MS method to investigate key metabolite changes in bacteria treated by AGNPs. We identified 10 significant metabolic differences between untreated and AGNPs-treated bacteria [24]. However, due to the partial disruption of bacterial integrity caused by the extractant, some valuable information may be missed. By utilizing an ultra-small diameter spray tip with a lower flow rate (typically < 1000 nL/min), nano-electrospray ionization (nESI) alters the ion formation process, enabling direct and precise analysis of complex biological samples from aqueous solutions without the need for extractants (Scheme 1), which offers higher sensitivity compared to conventional ESI [25–27]. Also, the device for nESI-MS is straightforward, involving a platinum electrode inserted into a glass capillary containing the sample, which enables real-time monitoring and facilitates continuous online detection of biomaterials [28,29].
In this study, we aimed to uncover the antibacterial mechanisms of AGNPs against bacteria by exploring the accurate interactions between AGNPs and Klebsiella pneumonia (K. p) using nESI-MS (Scheme 1). Leveraging the advantages of nESI-MS, we only needed to optimize the voltage to get raw data. To obtain a strong signal, organic extractants like methanol are commonly used in routine MS testing. However, these extractants can cause damage to bacterial samples, potentially masking the effects of bacterial destruction by AGNPs. Compared to ESI-MS, nESI-MS allows direct introduction of samples, increasing the number of detectable differential analytes, which significantly improves data validity and utilization. Through the application of principal component analysis (PCA), orthogonal partial least squares discriminant analysis (OPLS-DA), and variable importance in projection (VIP) analysis on AGNP-treated bacteria, we identified many metabolite changes at different stages after the treatment. This means that we can analyze the antibacterial mechanism of GNPs at the molecular level, using minimally pre-treated samples at their native state. Compared to our previous study [24], the number of identified metabolites has markedly increased from 10 to 61, allowing for the establishment of a comprehensive bacterial metabolic network following AGNP treatment. This network encompasses key functional pathways, including energy metabolism, redox homeostasis, oxidative defense, membrane integrity, osmoregulation, and quorum sensing. Notably, our findings highlight the essential role of the secondary metabolism in helping bacteria cope with oxidative stress and in modulating microbe-host interactions. The core metabolites within each pathway present valuable targets for enhancing the antibacterial efficacy of gold nanomaterials and guiding the development of next-generation antimicrobial agents.
We synthesized AGNPs following a previously established method [24]. In brief, we mixed HAuCl4·3H2O (0.05 mmol) and ABA (0.05 mmol) in 5 mL ultra-pure water in an ice-water bath. NaBH4 (3 mg/mL) was then added, and the mixture was stirred at 1000 rpm for 2 h. The obtained solution was dialyzed using a dialysis bag with a 14 kDa molecular weight cut-off (Solarbio) and sterilized by filtration through a 0.22 µm filter (Millipore), then stored at 4 ℃. The morphology and size of AGNPs were examined using a transmission electron microscopy (TEM, FEI TECNAI G2 F20, USA), and zeta potential measurements were conducted using a Particle Size and Zeta Potential Analyzer (NanoBrook Omni, Brookhaven Instruments, USA) to evaluate particle dispersity and surface charge. The antibacterial activity of AGNPs was evaluated by determining the minimum inhibitory concentration (MIC). In this study, we selected Gram-negative bacteria (Klebsiella pneumoniae, K. p, ATCC 13883; multidrug-resistant K. p, MDR K. p, ATCC 33495) and Gram-positive bacteria (Enterococcus faecalis, E. f, ATCC 29212; vancomycin-resistant E. f, VRE, ATCC 700221) to investigate the antibacterial effect of AGNPs. Briefly, K. p, MDR K. p, E. f, and VRE were cultured in Luria-Bertani (LB) medium at 260 rpm and 30 ℃ for 4 h to reach the logarithmic growth phase. The bacteria were then diluted to a concentration of 1 × 10⁵ CFU/mL with LB medium and inoculated into 96-well plates. AGNPs were serially diluted (2, 4, 8, 16, 32, 64, and 128 times) with the original concentration of 128 µg/mL and added to the bacterial suspension. After 24 h, we measured the optical density at 600 nm (OD600nm) by a microplate reader (Infinite 200Pro, Tecan, Switzerland). AGNPs exhibited the strongest antibacterial effect against K. p, prompting us to conduct further experiments to investigate the antibacterial mechanism of AGNPs against K. p in further experiments.
We fabricated nanocapillaries from a glass capillary with an inner diameter of 0.78 mm and an outer diameter of 1.00 mm using a horizontal program-controlled microelectrode puller (P-1000 Micropipette Puller, USA). The parameters were set as follows: heating temperature at 473 ℃, pulling force at 105 N, pulling speed at 70 m/s, delay time at 50 ms, and pressure at 200 Pa. The instrument was preheated for 15 min before use. The glass capillary was secured at both ends in the clamps of the puller and drawn using a combination of heat, electrical current, and elastic force. After the drawing process, the desired capillary glass tube was obtained. MS detection was performed following previously reported protocols [25]. Briefly, a nanocapillary loaded with 2 µL of the sample solution was used (Fig. S1 in Supporting information), and a long platinum electrode (50 µm inner diameter) connected to a 10 GΩ resistor was inserted to supply the high voltage. All experiments were carried out using a linear trap quadrupole (LTQ) mass spectrometer (Thermo Fisher Scientific, San Jose, USA), and data were collected with Thermo Xcalibur software (Thermo Fisher Scientific). Mass spectra were obtained within the m/z range of 50-350, in both the positive ionization mode (ESI+) and the negative ionization mode (ESI−). The distance between the nanocapillary tip and the mass spectrometer inlet was maintained at 5 mm, and the LTQ capillary was heated to 200 ℃. The capillary and lens voltages were automatically optimized by the system, with the capillary voltage set to 35 V and the lens voltage to 55 V in the ESI+ mode and the capillary voltage set to -35 V and the lens voltage to -55 V in the ESI− mode. The ionization voltage was adjusted within a range of 0.5-3.5 kV.
We prepared a K. p suspension in LB medium, adjusting the concentration to 105 CFU/mL. Four centrifuge tubes were filled with 180 µL of the K. p suspension, and 20 µL of AGNPs at a concentration of 100 µg/mL was added to one set, resulting in a final AGNP concentration of 10 µg/mL for the experimental group. In parallel, another set of four centrifuge tubes was prepared with 180 µL of K. p and 20 µL of medium as the control group. Both the experimental and control groups were incubated in a shaker (37 ℃, 260 rpm) for 0.5 h (early phase), 2 h (mid phase), 4 h (prolonged exposure), and 6 h (final phase). The bacterial solution was centrifuged at 8000 rpm for 3 min, and 2 µL of the supernatant was transferred into the prepared nanocapillary. The solution was gently shaken to remove any air bubbles, and a platinum wire electrode was inserted for the MS detection. The raw MS data were imported into Excel software after background subtraction in the Xcalibur data processing system. The data were then normalized and analyzed using Matlab R2016a (version 9.0, Mathworks, USA) for principal component analysis (PCA), with m/z as the independent variable and the relative intensity of the MS peaks as the dependent variable. Additionally, orthogonal partial least squares discriminant analysis (OPLS-DA) and the variable importance in projection (VIP) value were performed using Simca software (Version 14.0, Umetrics, Sweden). The VIP value was used to evaluate the impact of each metabolite’s expression pattern on sample classification, assisting in the identification of marker metabolites, with a VIP value > 1.0 serving as the selection criterion. Heatmap analysis was performed using MetaboAnalyst (version 6.0, McGill University, Canada).
We identified substances with VIP values greater than 1 and confirmed them through literature review, comparisons with MS databases, and standard verification using different secondary fragments. After comparing with literature and MS databases, standards were acquired for collision-induced dissociation (CID) analysis. CID experiments were conducted for MS/MS analysis, with precursor ions isolated using a window width of 1.4-2.0 Da. The normalized collision energy (NCE) was set between 20% and 45%, while all other parameters were configured according to the default LTQ instrument settings. The standard solutions were prepared using ultrapure water or a methanol-water mixture (70:30, v:v) as solvents, depending on the solubility of the compounds. The identified compounds in both ESI+ and ESI− modes were analyzed using a standard curve. Standards were prepared as a series of solutions with different concentrations. The collected secondary fingerprint data were then plotted using Origin (version 2022, OriginLab, USA) software. The concentration of the standard solution was plotted on the horizontal axis (x-axis), while the peak signal intensity of the corresponding compounds was plotted on the vertical axis (y-axis) for quantitative analysis. A linear regression equation was applied to the scatter plot distribution to generate the standard curve. Statistical parameters, including the slope, intercept, and correlation coefficient, were calculated to evaluate the accuracy and reliability of the curve. By comparing the MS peak intensities, we determined the metabolite concentration.
To explore the specific role of metabolites in the antibacterial mechanism of AGNPs, we analyzed the changes in bacterial reactive oxygen species (ROS), adenosine triphosphate (ATP) levels, and membrane permeability after AGNP treatment. In brief, we treated the bacteria with AGNPs (10 µg/mL) for 4 h in 96-well plates, using LB medium as the control. We measured the ROS levels in bacteria by staining the treated samples with 2’,7’-dichlorofluorescein diacetate (DCF-DA) using the ROS assay kit. After incubating for 1 h in the dark, the ROS levels were quantified by measuring fluorescence intensity (excitation wavelength: 488 nm, emission wavelength: 530 nm) with a microplate reader. We cultured the bacteria for 4 h until they reached the logarithmic growth phase, then discarded the supernatant after centrifugation. Next, we added the lysis solution and incubated the mixture on ice for 30 min before performing another round of centrifugation. The supernatant was collected for analysis, and ATP levels in the bacteria were measured using an ATP assay kit based on firefly luciferase, with readings taken using a microplate reader. We also evaluated changes in bacterial membrane permeability after AGNPs treatment. To reduce background fluorescence from the culture media, the assay was performed using an assay buffer (5 mmol/L HEPES, pH 7.2). Following 4 h of AGNPs treatment, the bacteria were collected by centrifugation, washed with 5 mmol/L HEPES and 5 mmol/L glucose. We then added 5 µmol/L N-phenyl-1-naphthylamine (NPN, Sigma-Aldrich) to the bacterial suspension in a Corning 96-well blank plate with a clear bottom. The fluorescence of the dye was measured over 15 min using a microplate reader, with excitation at 350 nm and emission at 420 nm. The protein concentration was determined using the bicinchoninic acid (BCA, Micro BCA Protein Assay Kit, Solarbio). In brief, protein standards, BCA working solution, reagent A, and reagent B were prepared according to the manufacturer’s instructions. After 4 h of AGNPs treatment, bacteria were collected and incubated with the BCA solution at 37 ℃ for 30 min, then cooled to room temperature. The absorbance at 562 nm (OD562 nm) was subsequently measured using a microplate reader. To confirm that increasing glutamine levels during the AGNPs treatment enhanced the antibacterial effect, we externally supplemented glutamine and monitored bacterial proliferation at different time points (6, 12, 24, and 48 h). Optical density at 600 nm (OD600 nm) measurements were taken to verify the bacterial viability. We inoculated bacteria (105 CFU/mL) with AGNPs for 72 h to test the biofilm formation. After removing the excess solution, we stained the biofilms by crystal violet for 30 min. A 1:1 mixture of ethanol and acetone was then added to dissolve the stain for quantification. Biofilm biomass was measured by recording the optical density at 595 nm (OD595 nm). To determine whether pyocyanin influences the antibiofilm activity of antibiotics and AGNPs, it was externally added to biofilm cultures subjected to various treatments, and the resulting biofilm biomass was subsequently assessed.
To optimize the nESI-MS parameters, K. p was cultured in LB medium, and the supernatant obtained by centrifugation was analyzed, representing metabolites generated and secreted during normal bacterial growth. We maximized signal intensity of bacterial metabolites by adjusting the voltage of nESI. As the spray voltage increased in 0.5 kV increments, the signal intensity rose, peaked at 3 kV, and then declined (Fig. S2 in Supporting information). The nESI-MS fingerprints of K. p were obtained within just 30 s per sample, allowing for rapid and accurate metabolite identification while minimizing bacterial damage. Using both ESI+ and ESI− modes simultaneously enabled comprehensive coverage of metabolites with diverse chemical properties. The same metabolites may exhibit response values differed by several orders of magnitude between different modes. Cross-validation between the two ionization modes enhanced detection sensitivity and improved data reliability while reducing matrix effects. Major ion peaks were detected at m/z 103 ([1,5-pentanediamine+H]+), 175 ([arginine+H]+), and 319 ([myricetin+H]+) in ESI+ mode, as well as m/z 130 ([isoleucine-H]-), 164 ([phenylalanine-H]-), and 277 ([linolenic acid-H]-) in ESI− mode (Figs. 1A and B).
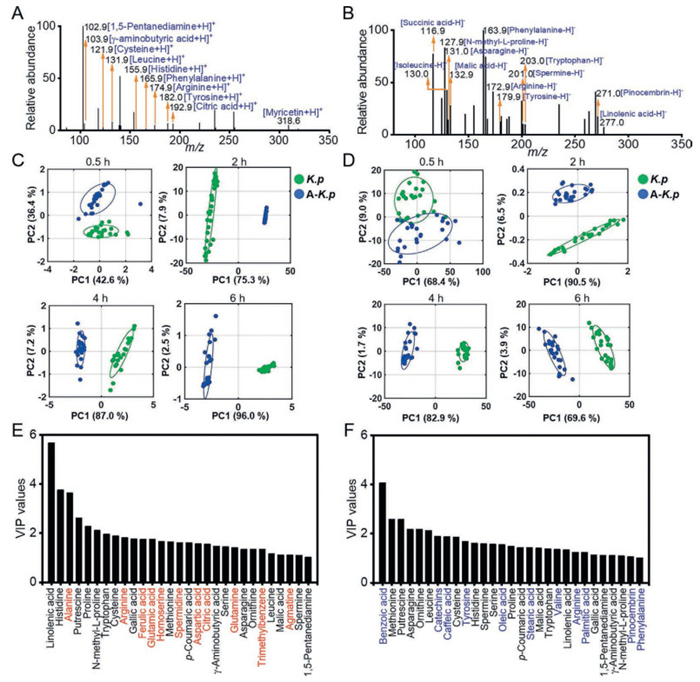
The MIC of AGNPs against K. p was 6 µg/mL (Table S1 in Supporting information). TEM showed that AGNPs possessed a uniform spherical morphology with an average diameter of ~6 nm (Fig. S3 in Supporting information). DLS and zeta potential analysis showed a distinct single peak, indicating that AGNPs were uniformly dispersed in water and carried a positive surface charge (~9.93 mV) (Fig. S4 in Supporting information). After treating K. p with AGNPs at a concentration of 10 µg/mL, metabolites in the bacteria were identified based on their product ions (m/z). PCA and OPLS-DA were used to construct classification models. In the ESI+ mode, PCA analysis revealed a clear distinction between untreated K. p and AGNP-treated K. p (A-K. p) starting at 2 h, with the difference progressively widening over time (Fig. 1C). Additionally, supervised analysis using OPLS-DA showed a marked separation between the K. p and A-K. p groups, with R2 greater than Q2 values, indicating high accuracy in both interpretation and prediction across different time points (Figs. S5 and S6 in Supporting information). In the ESI− mode, the PCA and OPLS-DA exhibited the same trend of differences (Fig. 1D, Figs. S7 and S8 in Supporting information). Furthermore, VIP analysis was used to identify differential metabolites following 2 h AGNP treatment. Using a VIP value greater than 1 as the selection criterion, this analysis identified 29 characteristic metabolites in the ESI+ mode (Fig. 1E) and 29 metabolites in the ESI− mode (Fig. 1F). Among 29 metabolites in the ESI+ mode, 18 metabolites (black fonts) overlapped with those identified in the ESI− mode, while 11 (red fonts) metabolites were solely in the ESI+ mode (Fig. 1E). Among 29 metabolites in the ESI− mode, 18 metabolites (black fonts) overlapped with those identified in the ESI+ mode, while 11 (blue fonts) metabolites were solely in the ESI− mode (Fig. 1F). The altered expression of these metabolites could serve as potential biomarkers for identifying the antibacterial effect of AGNPs.
We performed secondary mass spectra (MS2) to deconstruct complex molecules from the AGNP-treated bacteria into identifiable structural fragments using a "fragmentation-recombination-alignment" approach, which serves as the gold standard in mass spectrometry for elucidating compound structures. The ABA ligands on the nanoparticles and the bacterial metabolites were identified by their product ions (m/z) obtained through MS2 analysis from CID, complemented by reference analysis of standard compounds (Fig. S9 and Tables S2-S4 in Supporting information). The interaction between AGNPs and bacteria induced significant changes in metabolites, making it the focus of further exploration.
In the ESI+ mode, a total of 47 (16 ESI+, 31 ESI+/ESI−) metabolites were identified, in which 31 metabolites (Table S2 and Fig. S10 in Supporting information) overlapped with those detected in the ESI− mode and 16 metabolites were solely in the ESI+ mode (Fig. S11 in Supporting information). We show 3 typical ESI+ metabolites in Figs. 2A-C. The peak at m/z 76 was identified as glycine, with prominent fragment ions observed at m/z 58 (Fig. 2A). For agmatine, detected at m/z 131, the major fragments appeared at m/z 114, 103, and 85, corresponding to the loss of NH3, CNH2, and CN2H6, respectively (Fig. 2B). Quinic acid, at m/z 193, produced major fragments at m/z 175 and 123 due to the loss of H2O and C4H6O (Fig. 2C). These metabolites serve as representatives of the 16 distinct compounds identified in ESI+ mode (Fig. S11 in Supporting information), which play key roles in amino acid metabolism, polyamine metabolism, and the tricarboxylic acid (TCA) cycle.
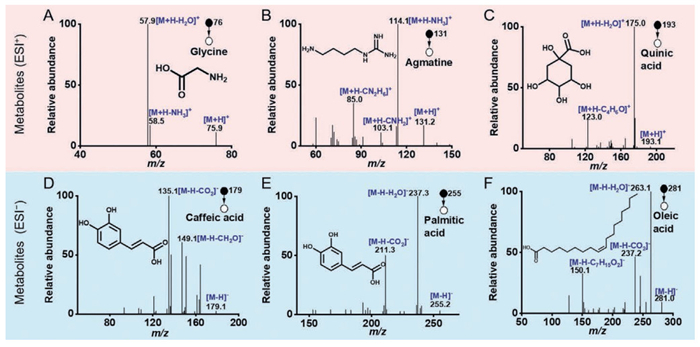
In the ESI− mode, 45 (14 ESI−, 31 ESI+/ESI−) metabolites were identified, in which 31 metabolites overlapped with those detected in the ESI+ mode (Table S2 and Fig. S12 in Supporting information) and 14 metabolites were solely in the ESI− mode (Fig. S13 in Supporting information). These overlapped metabolites including putrescine (m/z 89, ESI+, m/z 87 ESI−), γ-aminobutyric acid (GABA) (m/z 104, ESI+, m/z 102 ESI−), serine (m/z 106, ESI+, m/z 104 ESI−), aspartic acid (m/z 134, ESI+, m/z 132 ESI−), and glutamic acid (m/z 148, ESI+, m/z 146 ESI−) are primarily associated with polyamine metabolism and amino acid metabolism. A notable commonality was observed in bacterial secondary metabolites involved in phenylpropanoid metabolism, with ferulic acid (m/z 195, ESI+, m/z 193 ESI−) serving as a representative metabolite. Meanwhile, the sole ESI− metabolites are mainly linked to flavonoid metabolism and fatty acid metabolism. The peak at m/z 179 was tentatively identified as caffeic acid, a key phenolic acid contributing to phenylpropanoid-derived products (Fig. 2D). The [M-H]− peaks at m/z 255 and m/z 281 were identified as palmitic acid (Fig. 2E) and oleic acid (Fig. 2F), respectively, both are essential monounsaturated fatty acids crucial for lipid regulation.
The nESI-MS analysis of 61 metabolites (16 solely ESI+, 14 solely ESI−, 31 ESI+/ESI−) showed changes in the metabolite levels after 0.5 h of AGNP treatment (Table 1). By 2 h, nearly half of the metabolites had decreased, while some unchanged or increased metabolites were supposed to be the secondary metabolites, which are typically synthesized when bacterial division slows and metabolic activity shifts toward producing metabolites in response to environmental stress or competition [30,31]. After 4 h of AGNP treatment, the content of most metabolites began to decline, while the levels of the secondary metabolism-related molecules peaked. Ultimately, AGNPs treatment (6 h) was found to downregulate most of the metabolites.

 DownLoad:
CSV
DownLoad:
CSV
| No. | Metabolites | Regression curve | Linear range (µg/mL) | R2 | 0.5 h (µg/mL) | 2 h (µg/mL) | 4 h (µg/mL) | 6 h (µg/mL) |
| 1 | Putrescine | y = 19.15x + 32.70 | 1-1000 | 0.9999 | 3339.63 | 4113.20 | 5232.94 | 4395.42 |
| 2 | Alanine | y = 2.33x + 7.30 | 1-1000 | 0.9807 | 875.96 | 1796.28 | 892.49 | 203.92 |
| 3 | 1,5-Pentanediamine | y = 3.80x + 3.03 | 5-5000 | 0.9980 | 1719.94 | 6451.86 | 4089.78 | / |
| 4 | Serine | y =737.91x +1.22 | 0.1-50 | 0.9949 | / | 636.77 | 393.30 | 360.68 |
| 5 | Homoserine | y = 4.46x + 3.17 | 0.1-50 | 0.9746 | 21.47 | 19.29 | 73.48 | / |
| 6 | Leucine | y = 1.37x + 0.44 | 0.01-10 | 0.9964 | 1.01 | 2.13 | / | / |
| 7 | Asparagine | y = 934.07x + 0.58 | 0.01-10 | 0.9985 | 504.45 | 1288.00 | 174.88 | 151.60 |
| 8 | Aspartic acid | y = 4.22x +1.59 | 0.01-10 | 0.9249 | 12.96 | 26.86 | 17.86 | / |
| 9 | Malic acid | y = 16.04x + 29.93 | 1-500 | 0.9436 | 660.65 | 1956.69 | 2295.74 | 1465.10 |
| 10 | Spermidine | y = 13.83x + 2.12 | 1-1000 | 0.9981 | / | 6703.16 | 3703.24 | 2626.90 |
| 11 | Methionine | y = 106.62x + 13.46 | 0.01-10 | 0.9934 | 10.02 | 21.03 | 19.24 | 18.92 |
| 12 | Phenylalanine | y = 1119.02x + 2.99 | 0.01-10 | 0.9993 | 30.25 | 50.58 | 40.44 | 33.08 |
| 13 | Arginine | y = 3.28x + 4.00 | 0.01-10 | 0.9906 | 2.13 | 2.53 | / | / |
| 14 | Tryptophan | y = 1477.82x + 1256.72 | 0.01-10 | 0.9990 | 7273.54 | 11396.40 | 10078.93 | 9457.10 |
| 15 | Cysteine | y = 0.88x + 4.33 | 5-5000 | 0.9989 | 649.30 | 803.90 | 866.13 | 1096.66 |
| 16 | Ornithine | y = 258.50x - 89.94 | 0.01-10 | 0.9917 | 4.66 | 9.30 | 8.81 | 6.40 |
| 17 | Glutamine | y = 3.86x + 1.05 | 0.01-10 | 0.9999 | 4.14 | 6.43 | 6.06 | 4.87 |
| 18 | γ-Aminobutyric acid | y = 2.46x + 0.87 | 0.1-50 | 0.9991 | 98.07 | 53.94 | 12.01 | / |
| 19 | Proline | y = 3.48x + 2.36 | 0.1-100 | 0.9892 | 28.20 | 78.44 | 51.34 | 34.25 |
| 20 | N-Methyl-L-proline | y = 7.86x + 2.29 | 0.1-50 | 0.9953 | 6.30 | 59.49 | 48.80 | 41.63 |
| 21 | Glutamic acid | y = 5.08x + 5.22 | 0.1-50 | 0.9998 | 73.58 | 49.64 | 133.40 | 184.69 |
| 22 | Histidine | y = 2.65x + 4.01 | 1-500 | 0.9881 | 240.31 | 872.20 | 609.73 | / |
| 23 | p-Coumaric acid | y = 164.01x + 11.54 | 0.01-10 | 0.9957 | 620.76 | 767.50 | 892.99 | 860.46 |
| 24 | Gallic acid | y = 21.15x + 8.63 | 0.01-5 | 0.9887 | 13.51 | 39.44 | 61.52 | / |
| 25 | Tyrosine | y = 16.40x + 19.98 | 1-500 | 0.9999 | / | 1209.62 | 2119.17 | 396.70 |
| 26 | Ferulic acid | y = 6.69x + 1.38 | 0.1-100 | 0.9997 | 170.58 | 518.30 | 576.54 | / |
| 27 | Spermine | y = 7.55x + 18.75 | 0.01-5 | 0.9960 | 4.80 | 23.24 | / | / |
| 28 | Linolenic acid | y = 15.63x + 17.58 | 0.1-50 | 0.9996 | 464.13 | 738.00 | 22.58 | / |
| 29 | α-Ketoglutaric acid | y = 7.19x - 6.18 | 0.01-10 | 0.9910 | 3.84 | 3.11 | 3.35 | 2.94 |
| 30 | Citric acid | y = 9.99x + 3.24 | 0.01-10 | 0.9829 | 16.52 | 28.32 | 11.33 | 7.94 |
| 31 | 3-Phenylpyruvic acid | y = 5.85x - 13.62 | 0.1-100 | 0.9923 | 3.29 | 3.76 | 3.92 | 4.87 |
To understand the key metabolic pathways of K. p affected by AGNPs, we quantified 31 metabolites in both ESI+ and ESI− modes. Using standards at different concentrations, we measured the correlation coefficient (R2) and linear range (LR) to determine the exact amounts of the metabolites. The R2 for all metabolites ranged from 0.9249 to 0.9999, indicating a strong fit between the regression curves and the data (Table 1). By comparing the mass spectral peak intensities on the same vertical scale, we calculated the metabolites in A-K. p at different time points (Table 1), which were consistent with the PCA data (Figs. 1C and D).
We further examined the roles of the 31 metabolites detected in both ESI+ and ESI− modes, using a heat map to show the temporal variations of each compound relative to itself (Fig. 3). These metabolites involved in metabolic pathways such as amino acid metabolism, polyamine metabolism, fatty acid metabolism, and secondary metabolism. Dysregulation of these pathways implies the direct interactions between AGNPs and K. p. The interconnected pathways exhibited significant cross-talk, collectively influencing various stages of bacterial functionality. AGNPs caused an increase in fatty acid levels (Fig. 3, pink box) within the first 0.5 h, peaking at 2 h, which means that AGNPs can rapidly damage the bacterial cell membrane to release these fatty acids, such as linolenic acid (Table 1). This disruption can compromise the integrity of the bacterial cell membrane and weaken the bacterial ability to adapt to environmental stresses.
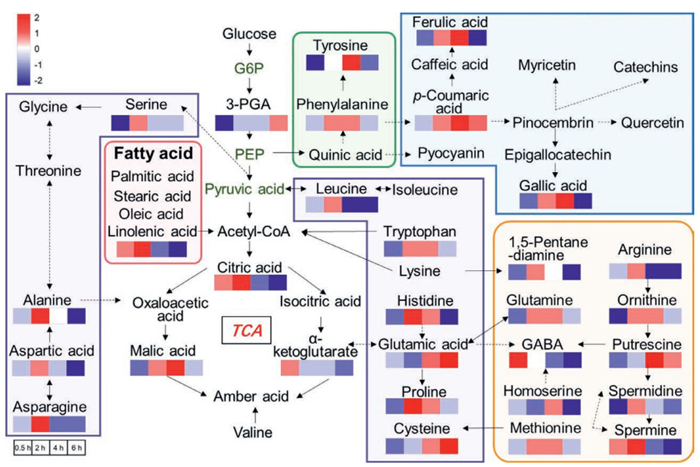
Amino acid metabolism (Fig. 3, purple box) plays a broader role in bacterial physiology, encompassing nutrient utilization, protein synthesis, and the generation of signaling molecules. After 0.5 h of AGNP treatment, the levels of most amino acids, such as serine and aspartic acid, showed a significant reduction. Within the glycine-serine-threonine metabolic axis, serine plays a direct role in the production of pyruvate and nucleotides. By converting into glycine, a vital component of the antioxidant tripeptide glutathione (GSH), serine contributes to enhancing bacterial resistance to oxidative stress. By disrupting the serine metabolic pathway, AGNPs can effectively inhibit bacterial growth and diminish their ability to adapt to environmental challenges. Aspartic acid metabolism plays a critical role in the bacterial synthesis of various amino acids and carbohydrates [32]. AGNPs inhibited the amino acid metabolic pathway, leading to a marked reduction in protein levels after treatment (Fig. S14 in Supporting information), thereby hindering bacterial growth and disrupting essential life-sustaining processes.
The secondary metabolites play a crucial role in microbial physiology and stress responses, with their concentrations influencing antibiotic sensitivity [31]. We speculated that under AGNP-induced stress conditions, bacteria tend to activate the secondary metabolic pathways as a mechanism to address survival challenges. As expected, major bacterial secondary metabolism pathways, including pyocyanin metabolism, phenylpropanoid-related metabolism (Fig. 3, blue box), and polyamine metabolism (Fig. 3, orange box) displayed a delayed response, with the highest levels of related metabolites observed at the 4-h mark. Pyocyanin, a major bacterial secondary metabolite, induces oxidative stress that can counteract the ROS generated by antimicrobial agents [33]. AGNPs exerted their antibacterial effects by influencing the level of pyocyanin. Phenylpropanoid metabolism, a secondary metabolite pathway, involves a sequence of enzymatic transformations of phenylalanine, leading to the production of nine detectable secondary metabolites. AGNPs altered the levels of these metabolites (Fig. 3, blue box), thereby affecting bacterial growth and interfering with microbial communication. AGNPs also triggered an increase in p-coumaric acid, which inhibits the synthesis of N-acylhomoserine lactone (AHL) signaling molecules [34], thereby suppressing the expression of quorum sensing-regulated virulence genes, ultimately leading to reduced biofilm formation (4 h). Although the shikimic acid pathway is classified as part of primary metabolism, it serves as a critical link to the secondary metabolism by supplying essential precursors for the biosynthesis of secondary metabolites, such as phenylpropanoids. AGNPs modulated the shikimic acid pathway (Fig. 3, green box) to suppress the biosynthesis of aromatic amino acids, including phenylalanine and tyrosine, thus interfering with bacterial growth and microbial communications. Polyamine metabolism involves the depletion of quorum-sensing molecules [35], which are closely linked to amino acid metabolism, as they involve amino groups that are crucial for nitrogen utilization and maintaining acid-base balance within bacterial cells. A reduction or complete depletion of polyamines (Fig. 3, orange box) caused by AGNPs at 4 h can significantly inhibit bacterial growth.
In the final phase (6 h), the cumulative disruption of multiple metabolic pathways and metabolites by AGNPs resulted in widespread bacterial death, marked by a substantial reduction in most metabolite levels and culminating in complete bacterial elimination. The extensively impacted metabolic network provided valuable insight into the underlying molecular antibacterial mechanisms of AGNPs.
In this study, by using nESI-MS analysis, we identified 61 metabolites from AGNP-treated K. p and characterized their changes using a semi-quantitative method at different time points. Based on the biological functions of these metabolites, they were classified into six categories: Energy metabolism, redox homeostasis, oxidative defense, membrane integrity, osmoregulation, and quorum sensing.
In terms of energy metabolism, malic acid, a key intermediate in the TCA cycle and energy metabolism [36,37], gradually decreased as exposed to AGNPs. By modulating malic acid levels, AGNPs may help reduce bacterial pathogenicity, thereby contributing to infection prevention and lowering the risk of recurrence. After 6 h of AGNP treatment, the levels of key metabolites in the TCA cycle all decreased, indicating a disruption in bacterial energy metabolism (Fig. 4). We validated this finding by measuring the ATP content in bacteria treated with varying concentrations of AGNP. The results showed an AGNP dose-dependent decrease in ATP levels (Fig. S15 in Supporting information). However, the upstream metabolites like glutamine and glutamic acid increased. We envisioned that an increased level of glutamine can enhance the impact of AGNPs on bacteria. As expected, exogenously added glutamine accelerated bacterial death, thereby amplifying the antibacterial effectiveness of AGNPs (Fig. S16 in Supporting information). Exogenously added glutamine is safe for the human body. Thus, glutamine may serve as a beneficial supplement for treating bacterial infections.
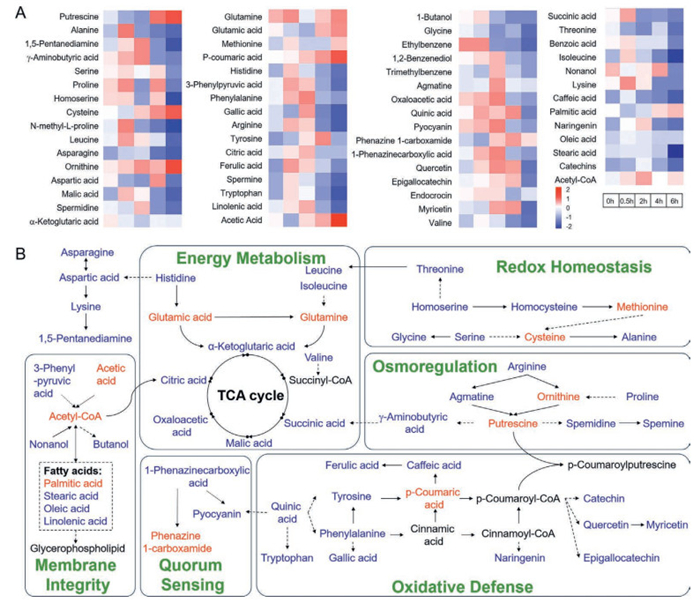
Regarding redox homeostasis and oxidative defense, AGNPs induced an increase in ROS levels in K. p (Fig. S17 in Supporting information). Cysteine is known to promote ROS generation [38]. The elevated cysteine levels (Table 1) observed in bacterial metabolites after AGNP treatment may further enhance ROS production, contributing to bacterial cellular damage. Methionine can be converted to cysteine through the transsulfuration pathway. Consistently, we found that AGNP treatment elevated methionine levels, which, via aminotransferase-mediated reactions, facilitated the production of methyl mercaptan (CH3SH) and hydrogen peroxide (H2O2), leading to increased intracellular ROS accumulation [39]. Following AGNP treatment, p-coumaric acid levels increased (Table 1 and Fig. 4A). This molecule may contribute to superoxide accumulation by inhibiting superoxide dismutase activity [40]. In addition, the elevated levels of p-coumaric acid can intensify oxidative stress within bacteria and facilitate the binding of AGNPs to phosphate anions in the bacterial DNA double helix. Thus, AGNPs impair bacterial oxidative defense mechanisms, ultimately causing oxidative imbalance and bacterial cell death.
Membrane integrity and osmoregulation play a crucial role as key indicators of bacterial viability. AGNPs triggered an abnormal accumulation of acetyl-CoA, acetic acid, ornithine, and putrescine within the bacteria (Figs. 4A and B). Acetyl-CoA serves as a direct precursor for lipid synthesis and is actively involved in cell membrane biosynthesis [41]. Elevated levels of acetyl-CoA promote excessive synthesis of palmitic acid, leading to altered membrane fluidity. AGNPs disrupt the bacterial cell wall by increasing acetyl-CoA levels, thereby affecting fatty acid composition and ultimately impairing normal bacterial physiological functions. Additionally, increased levels of acetyl-CoA can interfere with the breakdown of branched-chain amino acids like leucine and isoleucine by competitive inhibition, thereby disturbing the balance of bacterial amino acids. Acetic acid is a stress-inducing factor. Thus, the excessive acetic acid caused by the AGNPs can passively diffuse into cells, dissociate, and lead to the buildup of toxic ions in the cytoplasm (especially under high pH conditions), ultimately leading to bacterial death. Ornithine and putrescine are polyamines that help bacteria adapt to hypertonic conditions [42,43]. Upon exposure to AGNPs (0.5 h), ornithine levels rose rapidly, followed by an increase in putrescine levels at 4 h (Fig. 4A), suggesting a significant physiological response to AGNP treatment. Furthermore, AGNP-induced accumulation of putrescine and subsequent enhancement of oxidative reaction, thereby accelerating bacterial membrane disruption. Moreover, the AGNP-induced disruption of membrane homeostasis was validated by the increased membrane permeability observed in bacteria after treatment (Fig. S18 in Supporting information). Thus, AGNPs are validated to affect bacterial membrane integrity.
Quorum sensing plays a critical role in bacterial survival strategies, influencing virulence, adaptability, and biofilm formation. Antibiotic resistance mechanisms driven by the secondary metabolites are often specific to biofilm-associated bacteria. AGNPs were confirmed to inhibit biofilm formation (Fig. S19 in Supporting information). Here, we explored the antibacterial effects of AGNPs by analyzing their influence on bacterial quorum sensing. AGNP induced elevation of phenazine-1-carboxamide (Figs. 4A and B). Phenazine-1-carboxamide, a quorum sensing factor involved in secondary metabolism, regulates biofilm formation and dispersion by modulating the luxS quorum sensing system [44]. Phenazine-1-carboxamide can also inhibit the efflux of pyocyanin, effectively diminishing the virulence of pathogenic bacteria. Pyocyanin is a redox-active secondary metabolite. Although ampicillin shows anti-biofilm activity against K. p, its effectiveness was greatly diminished when administered together with exogenous pyocyanin, which can result in increased bacterial resistance (Fig. S20 in Supporting information). In contrast, the anti-biofilm efficacy of AGNPs remains largely unaffected when combined with pyocyanin (Fig. S20 in Supporting information), highlighting the effects of AGNPs on the phenazine-1-carboxamide metabolism and subsequent effects on bacterial resistance.
Taking together, we monitored the changes of various bacterial metabolites under the influence of AGNPs, and analyzed their roles in bacterial metabolisms, which is beneficial for both clarifying the antibacterial mechanism of nanomaterials at the molecular level and designing nanomaterials with a precise antibacterial mechanism.
In this study, by employing nESI-MS without the use of extractants, we identified 61 metabolites in K. p treated with AGNPs at various time points. These metabolites are mainly involved in 6 metabolic pathways including membrane integrity, energy production, oxidative defense, redox homeostasis, osmoregulation, and quorum sensing. We validated that nESI-MS is a novel approach for in-depth analysis of nanomaterial-bacteria interactions. This method eliminates undesirable electrochemical reactions, preserving the biological activity of the samples with minimal consumption, high sensitivity, and no decomposition, paving a way for a comprehensive understanding of the complex antibacterial mechanisms of nanomaterials at the molecular level. Our work also provides insights into the design of novel antibacterial agents in a cost-effective and rapid manner.
Dong Wu: Writing – original draft, Methodology, Formal analysis. Wenfu Zheng: Writing – original draft, Formal analysis, Conceptualization. Ting Lin: Formal analysis, Data curation. Youhuan Gong: Validation, Formal analysis. Yu Zhou: Methodology, Formal analysis. Xinglong Yang: Writing – original draft, Formal analysis. Le Wang: Writing – review & editing, Supervision, Project administration, Funding acquisition, Conceptualization.
The authors declare that they have no known competing financial interests or personal relationships that could have appeared to influence the work reported in this paper
We thank the National Natural Science Foundation of China (No. 22304065), Natural Science Foundation of Jiangxi Province of China (No. 20242BAB20088), the Project of Academic and Technical Leaders in Major Disciplines in Jiangxi Province (No. 20243BCE51158), Science and Technology Project of Education Department of Jiangxi Province of China (No. GJJ2200963); Doctor Start-up Fund of Jiangxi University of Chinese Medicine (No. 2022BSZR009) and Jiangxi University of Chinese Medicine School-level Science and Technology Innovation Team Development Program (No. CXTD22005).
Supplementary material associated with this article can be found, in the online version, at doi:
M. Miethke, M. Pieroni, T. Weber, et al., Nat. Rev. Chem. 5 (2021) 726–749. doi: 10.1038/s41570-021-00313-1
M. Xie, M. Gao, Y. Yun, et al., Angew. Chem. Int. Ed. 62 (2023) e202217345. doi: 10.1002/anie.202217345
W. Jin, L. Liao, T. Qin, et al., Chin. Chem. Lett. 36 (2025) 110920. doi: 10.1016/j.cclet.2025.110920
N. Macesic, A.C. Uhlemann, A.Y. Peleg, Lancet 405 (2025) 257–272. doi: 10.1016/S0140-6736(24)02081-6
X. He, L. Dai, L. Ye, et al., Adv. Sci. 9 (2022) 2105223. doi: 10.1002/advs.202105223
W.S. Zheng, Y.X. Jia, Y.Y. Zhao, et al., Nano Lett. 21 (2021) 1992–2000. doi: 10.1021/acs.nanolett.0c04451
Y.Z.Y. Xie, J.C. Yang, J.J. Zhang, W.F. Zheng, X.Y. Jiang, Angew. Chem. Int. Ed. 59 (2020) 23471–23475. doi: 10.1002/anie.202008584
W. Ndugire, D. Truong, N.G. Hasitha Raviranga, et al., Angew. Chem. Int. Ed. 62 (2023) e202214086. doi: 10.1002/anie.202214086
L. Wang, Q. Hou, W. Zheng, X.Y. Jiang, ACS Nano 15 (2021) 17885–17894. doi: 10.1021/acsnano.1c06139
L. Wang, S.X. Li, J.X. Yin, et al., Nano Lett. 20 (2020) 5036–5042. doi: 10.1021/acs.nanolett.0c01196
X. Zhao, H. Tang, X. Jiang, ACS Nano 16 (2022) 10066–10087. doi: 10.1021/acsnano.2c02269
M.L. Li, Y. Liu, Y.H. Gong, et al., Nanoscale Adv. 5 (2023) 6278–6317. doi: 10.1039/d3na00530e
Y. Zheng, X. Zhu, M. Jiang, et al., Angew. Chem. Int. Ed. 63 (2024) e202319400. doi: 10.1002/anie.202319400
Y. Si, C. Grazon, G. Clavier, et al., ACS Sens. 59 (2020) 2843–2851. doi: 10.1021/acssensors.0c00981
H. Zheng, J. Jia, Z. Li, Q. Jia, Anal. Chem. 92 (2020) 2680–2689. doi: 10.1021/acs.analchem.9b04691
J. Yang, S. Zhou, H. Zheng, Q. Jia, Anal. Methods 16 (2024) 1785–1792. doi: 10.1039/d4ay00154k
L. Huang, J. Wang, H. Jiang, L.F. Chen, H.W. Chen, Chin. Chem. Lett. 36 (2024) 109896.
J.B. Fenn, M. Mann, C.K. Meng, S.F. Wong, C.M. Whitehouse, Science 246 (1989) 64–71. doi: 10.1126/science.2675315
H. Lu, J. Ye, Y. Wei, et al., Chin. Chem. Lett. 35 (2024) 110077.
D.D. Xia, R. Jin, R.R. Pan, H.Y. Chen, D. Jiang, Anal. Chem. 95 (2023) 10221–10230. doi: 10.1021/acs.analchem.3c00479
K. Chingin, V. Frankevich, R.M. Balabin, et al., Angew. Chem. Int. Ed. 49 (2010) 2358–2361. doi: 10.1002/anie.200906213
Q.Y. Mao, X.Q. Ran, S.T. Xu, et al., Anal. Chem. 97 (2025) 6312–6319. doi: 10.1021/acs.analchem.5c00330
X.Q. Ran, C. Zhu, Q. Mao, et al., J. Mater. Chem. A 13 (2025) 13825–13831. doi: 10.1039/d5ta01329a
Y.H. Gong, D. Wu, X.J. Yan, et al., Anal. Chem. 96 (2024) 18865–18872. doi: 10.1021/acs.analchem.4c04571
D. Wu, M. Liu, W. Yu, et al., Ind. Crops Prod. 188 (2022) 115636. doi: 10.1016/j.indcrop.2022.115636
Q. Liang, S. Liu, W. Xu, Y.B. Zhai, Anal. Chem. 95 (2023) 2420–2427. doi: 10.1021/acs.analchem.2c04524
J.Q. Xu, T. Li, Z.D. Yu, et al., Chin. Chem. Lett. 34 (2023) 108578.
X.Q. Ran, S.T. Xu, H.L. Qian, X.P. Yan, J. Hazard. Mater. 455 (2023) 131584. doi: 10.1016/j.jhazmat.2023.131584
M. Rahman, D. Wu, K. Chingin, J. Am. Soc. Mass. Spectr. 30 (2019) 814–823. doi: 10.1007/s13361-019-02142-5
D.X. Zhang, Q. Qin, L. Qiao, Chin. Chem. Lett. 34 (2023) 107938. doi: 10.1016/j.cclet.2022.107938
J. Watrous, N. Hendricks, M. Meehan, P.C. Dorrestein, Anal. Chem. 82 (2010) 1598–1600. doi: 10.1021/ac9027388
M. Micaletto, S. Fleurier, S. Dion, E. Denamur, I. Matic, Sci. Adv. 10 (2024) eadj0767.
S.B. Mudaliar, A.S. Bharath Prasad, World J. Microbiol. Biotechnol. 40 (2024) 90. doi: 10.1007/s11274-024-03889-0
X.H. Chen, F.H. Yu, Y.Q. Li, et al., CYTA-J. Food 18 (2020) 61–67. doi: 10.1080/19476337.2019.1701558
S. Krysenko, W. Wohlleben, Med. Sci. 10 (2022) 40. doi: 10.3390/medsci10030040
Q.Y. Ji, W.Q. Wang, H.D. Yan, et al., Foods 12 (2023) 3011. doi: 10.3390/foods12163011
B. Liu, L.Y. Jiang, Y. Liu, et al., Nat. Commun. 14 (2023) 7227. doi: 10.1038/s41467-023-43149-7
J. van der Reest, S. Lilla, L. Zheng, S. Zanivan, E. Gottlieb, Nat. Commun. 9 (2018) 1581. doi: 10.1038/s41467-018-04003-3
A.S. Vanhove, B.E. Jugder, D. Barraza, P.I. Watnick, Appl. Environ. Microbiol. 86 (2020) e00371-20.
Z.X. Lou, H.X. Wang, S.Q. Rao, et al., Food Control 25 (2012) 550–554. doi: 10.1016/j.foodcont.2011.11.022
L. Shi, B.P. Tu, Curr. Opin. Cell Biol. 33 (2015) 125–131. doi: 10.1016/j.ceb.2015.02.003
A. Herrero Del Valle, B. Seip, I. Cervera-Marzal, et al., Nat. Microbiol. 5 (2020) 554–561. doi: 10.1038/s41564-020-0669-1
L. Solmi, F.R. Rossi, F.M. Romero, et al., Sci. Rep. 13 (2023) 4279. doi: 10.1038/s41598-023-31239-x
K.J. Wu, X.Y. Lin, Y.J. Lu, et al., Nat. Commun. 15 (2024) 6946. doi: 10.1038/s41467-024-51213-z

Scheme 1 Schematic illustration of the operation mechanism of nESI-MS and the interaction between AGNPs and bacteria over different time points by nESI-MS for in-depth exploration of antibacterial mechanisms.

Figure 1 Exploration of the antibacterial effects of AGNPs against K. p. (A) nESI-MS fingerprint of K. p in ESI+ mode. (B) nESI-MS fingerprint of K. p in ESI− mode. (C) PCA of nESI-MS data obtained from K. p and A-K. p in ESI+ mode. (D) PCA of nESI-MS data obtained from K. p and A-K. p in ESI− mode. (E) The VIP values obtained from K. p and A-K. p 2 h after AGNP treatment in ESI+ mode. (F) The VIP values obtained from K. p and A-K. p 2 h after AGNP treatment in ESI− mode. Red fonts represent the metabolites detected solely in ESI+ mode, whereas blue fonts indicate the metabolites detected solely in the ESI− mode. Black fonts represent the metabolites detected overlapped in both ESI+ and ESI− modes.

Figure 2 The nESI-MS2 fingerprints of 6 representative metabolites from K. p treated by AGNPs detected in ESI+ and ESI− modes, respectively. (A) Glycine, (B) agmatine, (C) quinic acid are in ESI+ mode; (D) caffeic acid, (E) palmitic acid, and (F) oleic acid are in ESI− mode.

Figure 3 The effects of antibacterial AGNPs on the content of metabolites in the bacterial biosynthesis pathway. The purple box represents amino acid metabolism, the orange box marks polyamine metabolism, the pink box indicates fatty acid metabolism, the green box represents shikimic acid metabolism, and the blue box shows the secondary metabolism. Green words represent the unidentified substances. G6P: glucose 6-phosphate, 3-PGA: 3-phenylpyruvic acid, PEP: phosphoenolpyruvate, GABA: γ-aminobutyric acid.

Figure 4 AGNPs exhibited antibacterial activity through multi-level mechanisms. (A) Heatmap displaying the intensity profiles of 61 metabolites in A-K. p across different time points. The transition in color from blue to red indicates variations in metabolite intensity from low level to high level. (B) Schematic representation of significantly altered metabolic pathways affected by AGNP treatment in K. p. After 6 h of AGNP treatment, red font indicates metabolites with consistently elevated levels, blue font represents those with decreased levels, and black font denotes unidentified metabolites.
Table 1. Quantification of 31 metabolites in K. p identified by nESI-MS, along with the concentrations of these metabolites after AGNP treatments at different time points. The metabolites numbered from 1-17 are ESI+, whereas those numbered from 18-31 are ESI−.
| No. | Metabolites | Regression curve | Linear range (µg/mL) | R2 | 0.5 h (µg/mL) | 2 h (µg/mL) | 4 h (µg/mL) | 6 h (µg/mL) |
| 1 | Putrescine | y = 19.15x + 32.70 | 1-1000 | 0.9999 | 3339.63 | 4113.20 | 5232.94 | 4395.42 |
| 2 | Alanine | y = 2.33x + 7.30 | 1-1000 | 0.9807 | 875.96 | 1796.28 | 892.49 | 203.92 |
| 3 | 1,5-Pentanediamine | y = 3.80x + 3.03 | 5-5000 | 0.9980 | 1719.94 | 6451.86 | 4089.78 | / |
| 4 | Serine | y =737.91x +1.22 | 0.1-50 | 0.9949 | / | 636.77 | 393.30 | 360.68 |
| 5 | Homoserine | y = 4.46x + 3.17 | 0.1-50 | 0.9746 | 21.47 | 19.29 | 73.48 | / |
| 6 | Leucine | y = 1.37x + 0.44 | 0.01-10 | 0.9964 | 1.01 | 2.13 | / | / |
| 7 | Asparagine | y = 934.07x + 0.58 | 0.01-10 | 0.9985 | 504.45 | 1288.00 | 174.88 | 151.60 |
| 8 | Aspartic acid | y = 4.22x +1.59 | 0.01-10 | 0.9249 | 12.96 | 26.86 | 17.86 | / |
| 9 | Malic acid | y = 16.04x + 29.93 | 1-500 | 0.9436 | 660.65 | 1956.69 | 2295.74 | 1465.10 |
| 10 | Spermidine | y = 13.83x + 2.12 | 1-1000 | 0.9981 | / | 6703.16 | 3703.24 | 2626.90 |
| 11 | Methionine | y = 106.62x + 13.46 | 0.01-10 | 0.9934 | 10.02 | 21.03 | 19.24 | 18.92 |
| 12 | Phenylalanine | y = 1119.02x + 2.99 | 0.01-10 | 0.9993 | 30.25 | 50.58 | 40.44 | 33.08 |
| 13 | Arginine | y = 3.28x + 4.00 | 0.01-10 | 0.9906 | 2.13 | 2.53 | / | / |
| 14 | Tryptophan | y = 1477.82x + 1256.72 | 0.01-10 | 0.9990 | 7273.54 | 11396.40 | 10078.93 | 9457.10 |
| 15 | Cysteine | y = 0.88x + 4.33 | 5-5000 | 0.9989 | 649.30 | 803.90 | 866.13 | 1096.66 |
| 16 | Ornithine | y = 258.50x - 89.94 | 0.01-10 | 0.9917 | 4.66 | 9.30 | 8.81 | 6.40 |
| 17 | Glutamine | y = 3.86x + 1.05 | 0.01-10 | 0.9999 | 4.14 | 6.43 | 6.06 | 4.87 |
| 18 | γ-Aminobutyric acid | y = 2.46x + 0.87 | 0.1-50 | 0.9991 | 98.07 | 53.94 | 12.01 | / |
| 19 | Proline | y = 3.48x + 2.36 | 0.1-100 | 0.9892 | 28.20 | 78.44 | 51.34 | 34.25 |
| 20 | N-Methyl-L-proline | y = 7.86x + 2.29 | 0.1-50 | 0.9953 | 6.30 | 59.49 | 48.80 | 41.63 |
| 21 | Glutamic acid | y = 5.08x + 5.22 | 0.1-50 | 0.9998 | 73.58 | 49.64 | 133.40 | 184.69 |
| 22 | Histidine | y = 2.65x + 4.01 | 1-500 | 0.9881 | 240.31 | 872.20 | 609.73 | / |
| 23 | p-Coumaric acid | y = 164.01x + 11.54 | 0.01-10 | 0.9957 | 620.76 | 767.50 | 892.99 | 860.46 |
| 24 | Gallic acid | y = 21.15x + 8.63 | 0.01-5 | 0.9887 | 13.51 | 39.44 | 61.52 | / |
| 25 | Tyrosine | y = 16.40x + 19.98 | 1-500 | 0.9999 | / | 1209.62 | 2119.17 | 396.70 |
| 26 | Ferulic acid | y = 6.69x + 1.38 | 0.1-100 | 0.9997 | 170.58 | 518.30 | 576.54 | / |
| 27 | Spermine | y = 7.55x + 18.75 | 0.01-5 | 0.9960 | 4.80 | 23.24 | / | / |
| 28 | Linolenic acid | y = 15.63x + 17.58 | 0.1-50 | 0.9996 | 464.13 | 738.00 | 22.58 | / |
| 29 | α-Ketoglutaric acid | y = 7.19x - 6.18 | 0.01-10 | 0.9910 | 3.84 | 3.11 | 3.35 | 2.94 |
| 30 | Citric acid | y = 9.99x + 3.24 | 0.01-10 | 0.9829 | 16.52 | 28.32 | 11.33 | 7.94 |
| 31 | 3-Phenylpyruvic acid | y = 5.85x - 13.62 | 0.1-100 | 0.9923 | 3.29 | 3.76 | 3.92 | 4.87 |
 下载: 导出CSV

 扫一扫看文章


扫一扫关注我们
 下载:
下载: