Key Laboratory of Energy Conversion and Storage Materials, College of Chemistry, Beijing Normal University, Beijing 100875, China
b.
College of Textiles and Clothing, State Key Laboratory of Bio-fibers and Eco-textiles, Qingdao University, Qingdao 266071, China
c.
School of Physics and Astronomy, Applied Optics Beijing Area Major Laboratory, Center for Advanced Quantum Studies, Beijing Normal University, Beijing 100875, China
d.
Center for Advanced Low-dimension Materials, State Key Laboratory for Modification of Chemical Fibers and Polymer Materials, College of Materials Science and Engineering, Donghua University, Shanghai 201620, China
zsbo@bnu.edu.cn (Z. Bo). 1 These authors contributed equally to this work.
Received Date:
09 October 2025 Accepted Date:
20 January 2026 Revised Date:
17 January 2026 Available Online:
15 November 2026
Abstract:
Molecular structure design is pivotal for enhancing the performance of non-fused-ring electron acceptors (NFREAs), yet systematic exploration of optimal side-group substitution sites remains underexplored. Via targeted modification of molecular structures, we designed and synthesized two asymmetric NFREAs, 3TT-m-2F and 3TT-o-2F, as structural isomers differing in fluorine substitution positions on their side chains. The integration of asymmetric molecular architectures and side-group fluorination significantly modulated their electronic properties and aggregation behaviors. Notably, 3TT-o-2F exhibited a redshifted absorption spectrum, enhanced molecular packing density, and extended exciton diffusion length compared to its meta-substituted counterpart. The D18:3TT-o-2F blend film formed a well-defined nanofiber network, promoting efficient charge migration and achieving a high charge mobility. Consequently, the corresponding organic solar cell (OSC) demonstrated a remarkable power conversion efficiency (PCE) of 17.16%, outperforming the 3TT-m-2F-based device (PCE = 15.36%). These findings provide valuable guidelines for rational molecular engineering of high-performance NFREAs in OSCs.
In recent years, organic solar cells (OSCs) have drawn substantial attention from both the academic community and the industrial realm, owing to their remarkable flexibility, light-weight, and printability [1–7]. These characteristics endow them with exceedingly broad application prospects in the field of emerging next-generation energy technologies. At present, the power conversion efficiency (PCE) of single-junction devices based on fused-ring electron acceptors (FREAs) has exceeded 20%, marking a significant stride towards their commercialization [8–17]. Nevertheless, the synthesis of FREAs necessitates cyclization reactions to integrate multiple aromatic units into a planar conjugated framework. This intricate synthetic procedure not only escalates the synthesis complexity but also leads to relatively low yields, consequently driving up the production costs and posing a challenge to large-scale commercial application.
Non-fused-ring electron acceptors (NFREAs) have emerged as highly promising alternative materials, primarily owing to their cost-effectiveness and straightforward synthetic routes. To date, the highest documented PCE of NFREAs has surpassed 19%, demonstrating a level of performance comparable to that of FREAs [18]. From the standpoint of optimizing the photovoltaic performance of NFREAs, molecular structure design is the pivotal strategy for enhancing their properties. Notably, the incorporation of halogen substituents and the introduction of molecular asymmetry have proven to be effective molecular modification approaches for optimizing the photovoltaic performance. These modifications can induce significant alterations in molecular structure, absorption characteristics, and energy level distributions, thereby playing a pivotal role in advancing the field of organic semiconductors [19]. In the context of this study, the introduction of asymmetric side chains and halogenation into NFREAs leads to marked changes in the spatial distribution of electron clouds and the molecular spatial conformation. Specifically, these modifications can fine-tune the electrostatic potential (ESP) distribution of molecules, strengthen intermolecular interactions, and facilitate the ordered packing of molecules within thin films. Consequently, this results in more efficient charge transport, a reduction in charge recombination losses, and ultimately an enhancement in the performance of photovoltaic devices [20–24].
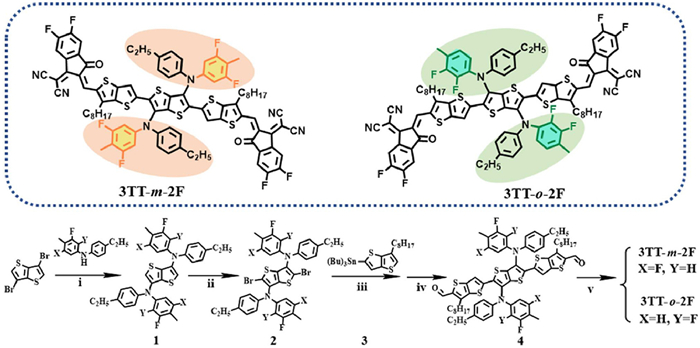
Herein, we chose a non-fused ring electron acceptor material featuring diphenylamine (DPA) side groups, which was reported by our research group in 2021, as a foundational platform for structural modification investigations [25]. Theoretically, two strategies hold promise for precisely regulating the aggregation behavior and optoelectronic properties of the materials: One involves introducing fluorine (F) atoms to establish intermolecular halogen bonds with adjacent acceptors, and the other focuses on incorporating asymmetric structures to augment molecular dipoles. Building on these theoretical insights, we synthesized two asymmetric non-fused ring acceptors. This was accomplished by introducing fluorine atoms to modify the DPA side groups and constructing asymmetric molecular architectures, with the objective of achieving precise control over the side-group molecular structure. Among these two asymmetric acceptors, the molecular polarity index (MPI) of the ortho-difluoro configuration (o-DPA) is markedly higher than that of its meta-difluoro isomer (m-DPA). This disparity suggests that relative to m-DPA, the strong electron-withdrawing nature of the ortho-difluoro atoms in o-DPA is more pronounced, thereby more readily inducing a redistribution of the electron cloud within the π-backbone. In line with our predictions, 3TT-o-2F demonstrates more compact molecular packing and a longer exciton diffusion length compared to 3TT-m-2F. Moreover, its blend films exhibit a well-defined nanoscale phase morphology, leading to reduced device energy losses. Owing to these advantageous characteristics, the device based on D18:3TT-o-2F attains an exceptional PCE of up to 17.16%, significantly surpassing that of the device utilizing D18:3TT-m-2F (15.36%). In summary, this study underscores the pivotal role of introducing F atoms and employing asymmetric strategies in the development of high-performance non-fused ring electron acceptor materials, offering valuable insights for future material design and optimization (Scheme 1).
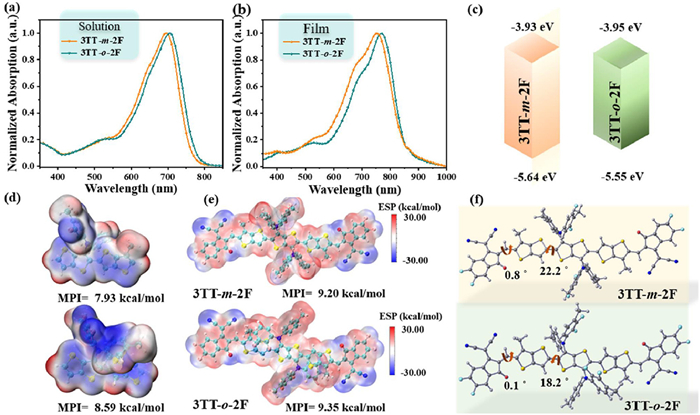
We conducted a systematic investigation into the absorption characteristics and aggregation behavior of two acceptor materials, 3TT-m-2F and 3TT-o-2F, in both dilute chloroform solutions and thin-film states by employing ultraviolet-visible (UV–vis) absorption spectroscopy. As depicted in Figs. 1a and b, these two acceptor materials manifest prominent and well-defined absorption peaks within the wavelength range of 600–800 nm. In dilute chloroform solutions, their maximum absorption peaks (λmax) are precisely located at 694 and 705 nm, respectively. Upon transitioning to thin-film states, these absorption peaks exhibit marked red-shifts, reaching wavelengths of 753 and 769 nm, respectively. In comparison with their solution states, the magnitudes of red-shift are approximately 59 and 64 nm, respectively. Concurrently, within the thin-film systems, both 3TT-m-2F and 3TT-o-2F clearly display distinct 0–1 vibrational shoulder peaks, with the corresponding shoulder-peak wavelengths positioned at 690 and 700 nm, respectively. Further quantitative analyses reveal that the intensity ratio of the 0–0 to 0–1 electronic vibrational transitions for compound 3TT-o-2F is significantly higher than that for compound 3TT-m-2F. These features unequivocally demonstrate that the molecular system of 3TT-o-2F exhibits more pronounced J-aggregate structural characteristics, suggesting stronger intermolecular interactions in the thin-film state. Such enhanced intermolecular interaction is beneficial for facilitating efficient charge transport and effective exciton diffusion. The optical bandgaps (Egopt) of 3TT-m-2F and 3TT-o-2F were calculated using the formula Egopt = 1240/λonset, where λonset represents the absorption edge wavelength of the thin films. The calculated Egopt values are 1.47 and 1.45 eV for 3TT-m-2F and 3TT-o-2F, respectively. Simultaneously, the energy levels of these two acceptor materials were determined via cyclic voltammetry (CV), with the relevant results presented in Fig. S1 (Supporting information). The highest occupied molecular orbital (HOMO) and lowest unoccupied molecular orbital (LUMO) energy levels were computed using the formula EHOMO/LUMO = −e(Eox/red − E(Fc/Fc+) + 4.8) (eV). As illustrated in Fig. 1c and Table 1, the HOMO/LUMO energy levels of 3TT-m-2F and 3TT-o-2F are −5.66/−3.94 eV and −5.55/−3.95 eV, respectively. These research findings unequivocally reveal that both the introduction position of fluorine atoms on the side-groups of non-fused-ring acceptors and the asymmetric structure of the acceptors exert a significant influence on the absorption spectral characteristics and energy-level alignment of the acceptor molecules.
Figure 1
Figure 1.
(a) UV–vis absorption spectra of 3TT-m-2F and 3TT-o-2F in chloroform solutions. (b) UV–vis absorption spectra of their corresponding thin films. (c) Energy band diagrams of 3TT-m-2F and 3TT-o-2F. (d) ESP distributions and calculated MPI values of the side groups of 3TT-m-2F and 3TT-o-2F. (e) ESP distributions and calculated MPI values for the entire molecular systems of 3TT-m-2F and 3TT-o-2F. (f) Optimal molecular conformations of 3TT-m-2F and 3TT-o-2F calculated via DFT.
As demonstrated by the molecular ESP distribution characteristics depicted in Fig. 1d. Upon the introduction of meta-difluoro substituents into 3TT-m-2F, a cross-distribution configuration manifests. In this configuration, the positive ESP is arrayed around the molecular backbone, whereas the negative ESP is arranged around the side-groups. In marked contrast, following the incorporation of ortho-difluoro substituents to 3TT-o-2F, notable alterations occur in its ESP distribution characteristics, with the non-uniformity becoming further exacerbated. Specifically, the disparities in the distribution of positive and negative ESPs between the molecular backbone region and the side-group region are more pronounced, thereby presenting a well-defined spatial ESP distribution pattern.
To enable a quantitative assessment of molecular polarity, we introduce the MPI as a pivotal parameter [26]. This index is capable of accurately quantifying the local polarity deviations arising from the non-uniform distribution of ESP, thereby offering an effective quantitative criterion for in-depth investigation into the characteristics of molecular polarity [27–29]. As illustrated in Fig. 1d, for the compounds 3TT-m-2F and 3TT-o-2F, the MPI values between their side-groups and molecular backbones have been experimentally determined to be 7.93 and 8.59 kcal/mol, respectively. These experimental data unequivocally demonstrate that the incorporation of ortho-difluoro substituents can substantially augment the polarity characteristics of the side-groups.
Meanwhile, we conducted a comprehensive computation of the ESP distribution for the entire molecules (Fig. 1e and Fig. S2 in Supporting information). The results show that the side-group structure exerts a specific regulatory effect on the ESP distribution of the molecular backbone, and this effect, in turn, influences the overall electronic cloud distribution characteristics of the molecule. The MPI values for 3TT-m-2F and 3TT-o-2F are 9.20 and 9.35 kcal/mol, respectively. This result not only validates the enhancing effect of ortho-difluoro substituents on side-group polarity but also reveals that the increase in side-group polarity can be effectively transferred to the entire molecular system, facilitating the formation of a more ordered and efficient stacking for the acceptor molecules.
As illustrated in Fig. 1f, the optimal molecular conformations of 3TT-m-2F and 3TT-o-2F were determined via density functional theory (DFT) calculations. From a top-view perspective, the dihedral angles between the indanone cyanine (IC) end-groups and the π-bridges are below 1°, signifying a near-perfect planar geometry. Nevertheless, for 3TT-m-2F and 3TT-o-2F, the twist angles between the central dithienothiophene cores and the adjacent dithienothiophene bridges measure approximately 22.2° and 18.2°, respectively. When viewed from the side (Fig. S3 in Supporting information), the side chains of both acceptor molecules exhibit relatively large dihedral angles with respect to the molecular backbones. Specifically, the dihedral angle for 3TT-m-2F is 50.5°, and for 3TT-o-2F, it is 53.8°. This structural characteristic effectively mitigates excessive molecular aggregation. DFT calculations reveal that the HOMO and LUMO energy levels of 3TT-m-2F are −5.91 and −3.65 eV, respectively, while those of 3TT-o-2F are −5.88 and −3.61 eV, respectively. These findings align with the trends observed in CV measurements. As shown in Fig. S3, the electron cloud of the LUMO is delocalized over the entire molecular backbone, whereas the electron cloud of the HOMO is predominantly localized on the electron-donating moieties.
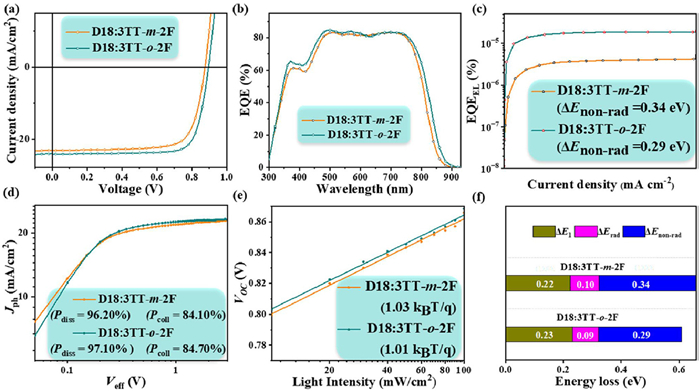
The photovoltaic performance of 3TT-m-2F and 3TT-o-2F was systematically evaluated in OSCs with an optimized device architecture of ITO/2PACz/active layer/PDINN/Ag. The polymer D18 was selected as the electron donor due to its complementary absorption spectrum and well-aligned energy levels with the acceptors, ensuring efficient photon harvesting and charge transfer [30,31]. The detailed device processing procedures are listed in Supporting information. The J-V curves of the devices are shown in Fig. 2a, while the photovoltaic performance parameters during the optimization process are presented in Table 2, and the optimal parameters are listed in Supporting information. The device based on 3TT-o-2F achieved a PCE of 17.16%, with an open-circuit voltage (Voc) of 0.89 V, a Jsc of 24.16 mA/cm2, and an FF of 78.72%, significantly outperforming the device based on 3TT-m-2F, which achieved a PCE of 15.36%. To elucidate the physical mechanism underlying the enhancement in Jsc, this study systematically evaluated the carrier collection efficiency of the 3TT-m-2F and 3TT-o-2F devices using external quantum efficiency (EQE) spectroscopy. As depicted in Fig. 2b, the device based on the ortho-fluorinated 3TT-o-2F maintained an EQE peak response of 84.6% across a broad spectral range of 300–850 nm, demonstrating a wider spectral coverage and higher response intensity compared to the meta-substituted 3TT-m-2F system. This further explains the high Jsc observed in the 3TT-o-2F device. The current densities calculated by integrating the EQE curves for the two devices reached 22.20 and 23.21 mA/cm2, respectively.
Figure 2
Figure 2.
Performance and photoelectric characteristics of the 3TT-m-2F and 3TT-o-2F based devices, (a) J-V curves, (b) EQE spectra, (c) EQEEL curves, (d) dependence of Jph on Veff and (e) dependence of Voc on Plight. (f) The detailed Eloss of OSCs.
We investigated the charge carrier recombination, exciton dissociation, and charge collection in devices based on the two acceptor molecules. Firstly, to elucidate the mechanisms of exciton dissociation and charge collection in OSCs, we evaluated the photocurrent density (Jph) and effective voltage (Veff), and calculated the exciton dissociation efficiency (Pdiss) using the formula Pdiss = Jph/Jsat and the charge collection efficiency (Pcoll) using the formula Pcoll = Jsc/Jsat [32,33]. The results revealed that the Pdiss/Pcoll values for devices based on 3TT-m-2F and 3TT-o-2F are 96.2%/84.1% and 97.1%/84.7%, respectively (Fig. 2d). This indicates that the exciton dissociation and charge collection efficiencies in the device based on 3TT-o-2F are higher than those in the device based on 3TT-m-2F, providing further explanation for the higher Jsc and FF values.
Additionally, we studied the relationships between Jsc and Voc, as well as between Jsc and light intensity (Plight), to assess the charge carrier recombination kinetics within the devices. As shown in Fig. S4 (Supporting information), the relationship between Jsc and Plight is expressed by the formula Jsc ∝ Plightα, where the proximity of the α value to 1 is closely related to the recombination mechanism; an α value close to 1 indicates that the bimolecular recombination process in the device is negligible [34,35]. The α values for devices based on 3TT-m-2F and 3TT-o-2F are 0.989 and 0.992, respectively. The α value for the device based on 3TT-o-2F is closer to the theoretical ideal value, confirming the correlation between the fluorine atom substitution site and the suppression of bimolecular recombination. The ideality factor (n) of the relationship between Voc and Plight is explained by the slope kT/q (where k represents the Boltzmann constant, T denotes the Kelvin temperature, and q represents the elementary charge) [5,36,37]. The n values for devices based on 3TT-m-2F and 3TT-o-2F were 1.03 and 1.01 kT/q, respectively. As shown in Fig. 2e, the device based on 3TT-o-2F is closer to 1, indicating that trap-assisted recombination has been effectively suppressed in the device based on 3TT-o-2F compared to that based on 3TT-m-2F. These findings suggest that the device based on 3TT-o-2F experiences less bimolecular recombination loss and exhibits more efficient charge carrier transport.
The energy loss (Eloss) can be calculated using the formula Eloss = Eg - qVoc = ΔE1 + ΔErad + ΔEnon-rad, where Eg represents the energy band corresponding to the intersection point of the thin-film UV–vis and photoluminescence spectra [38,39]. To delve deeper into the reasons for these Eloss differences, we conducted highly sensitive photovoltaic quantum efficiency (EQEPV) and electroluminescence (EL) measurements to determine the energy of the charge transfer state (ECT). As shown in Fig. 2c and Fig. S5 (Supporting information), the ECT values for devices based on D18:3TT-m-2F and 3TT-o-2F are 1.43 and 1.41 eV, respectively. Furthermore, we performed EQEEL measurements to evaluate ΔEnon-rad in the OSCs. According to the formula: ΔEnon-rad = −kTln(EQEEL)/q, where k, T, and q represent the Boltzmann constant, Kelvin temperature, and elementary charge, respectively [40]. The calculated ΔEnon-rad values for devices based on D18:3TT-m-2F and 3TT-o-2F were 0.34 and 0.29 eV, respectively. As shown in Fig. 2f and Table 3, the Eloss values for devices based on 3TT-m-2F and 3TT-o-2F were 0.66 and 0.61 eV, respectively.
Table 3
Table 3.
The Eloss of 3TT-m-2F and 3TT-o-2F-based devices.
We utilized the space-charge-limited current (SCLC) technique to systematically investigate the charge transport characteristics of devices based on D18:3TT-m-2F and D18:3TT-o-2F. Specifically, hole mobility (μh) was measured employing an ITO/PEDOT: PSS/active layer/Au device architecture, while electron mobility (μe) was determined utilizing an ITO/zinc oxide (ZnO)/active layer/Al configuration. As depicted in Fig. S6 and Table S1 (Supporting information), the μe values for devices based on D18:3TT-m-2F and D18:3TT-o-2F are 4.44 × 10⁻⁴ and 6.06 × 10⁻⁴ cm2 V−1 s−1, respectively. Additionally, the μh values for devices based on D18:3TT-m-2F and D18:3TT-o-2F are 5.33 × 10⁻⁴ and 5.61 × 10⁻⁴ cm2 V−1 s−1, respectively. Compared to the device based on D18:3TT-m-2F, the device based on D18:3TT-o-2F exhibits higher μh and μe values and a more balanced μh/μe ratio, which further elucidates the superior Jsc and FF values observed in the device based on D18:3TT-o-2F.
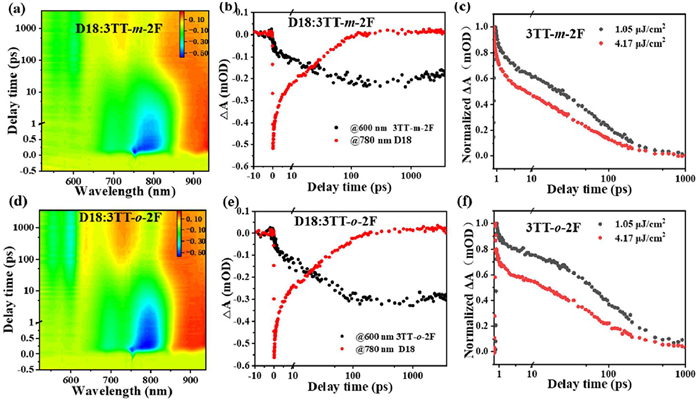
We have carried out an in-depth exploration of hole transport dynamics within blend films, employing femtosecond transient absorption (fs-TA) spectroscopy techniques. During the experimental procedure, excitation was achieved using a 750 nm pump laser, and the dynamic responses across the 520–850 nm spectral range were visualized through two-dimensional color mapping diagrams (Fig. 3). Additionally, transient spectra at characteristic delay time points were deliberately selected for comparative analysis. The results demonstrate that both blend systems, namely D18:3TT-o-2F and D18:3TT-m-2F, exhibit prominent ground-state bleaching (GSB) characteristic signals. As depicted in Fig. 3 and Fig. S7 (Supporting information), two new bleaching peaks emerge at 550 and 600 nm within the donor absorption region. Furthermore, the peak intensity of the D18:3TT-o-2F blend film surpasses that of the D18:3TT-m-2F blend film, indicating a more efficient hole transport process in the D18:3TT-o-2F blend film. To facilitate a quantitative analysis of the hole transport process, we extracted kinetic traces at specific wavelengths. By applying a double-exponential fitting algorithm to the rising phase of the donor GSB signal, we derived the kinetic time (Table S2 in Supporting information). The time constants for the different blend films are as follows: For D18:3TT-m-2F, τ1 = 3.31 ± 0.72 ps and τ2 = 33.11 ± 5.71 ps; for D18:3TT-o-2F, τ1 = 1.03 ± 0.19 ps and τ2 = 31.52 ± 1.91 ps. Here, the faster τ1 predominantly corresponds to the ultrafast exciton dissociation process occurring at the donor-acceptor interface, while the slower τ2 mainly reflects the exciton diffusion process within the acceptor domains [19,41]. A comparative analysis reveals that, in contrast to the D18:3TT-m-2F blend film, the D18:3TT-o-2F blend film exhibits a faster exciton dissociation rate at the interface and more efficient intra-domain exciton diffusion. This unequivocally demonstrates its superior hole transport rate. Such a characteristic is highly favorable for the generation and collection of charges in OSCs, ultimately conferring them with exceptional optoelectronic performance.
Figure 3
Figure 3.
The TA image and various decay times of D18:3TT-m-2F (a, b), D18:3TT-o-2F (d, e); Singlet exciton decay dynamics with different excitation fluence for neat films of 3TT-m-2F (c) and 3TT-o-2F (f).
In addition, we further explored the impact of exciton diffusion on charge transport performance. As shown in Figs. 3c and f, by combining fs-TA spectroscopy measurements with the exciton-exciton annihilation (EEA) model, we estimated the exciton diffusion length (LD) [29,42,43]. According to the EEA model, excitons primarily undergo two quenching mechanisms: Defect-assisted recombination and bimolecular exciton-exciton annihilation recombination. These two processes jointly determine the diffusion coefficient (D) and further influence the exciton diffusion length. We selected 750 nm as the excitation wavelength and investigated the dynamic evolution of excitons by adjusting the excitation intensity. The results revealed that an increase in excitation fluence accelerated the decay rate of excitons, and the overall evolution process could be well-fitted into a rate equation model. By integrating experimental results with theoretical analysis, we obtained LD values of 13.40 and 17.10 nm for 3TT-m-2F and 3TT-o-2F, respectively (Table S3 in Supporting information). It is evident that 3TT-o-2F exhibits a larger diffusion length, indicating superior performance in charge transport.
We further employed grazing-incidence wide-angle X-ray scattering (GIWAXS) to investigate the packing and orientation of the neat acceptor films and blend films. After signal normalization, as illustrated in Fig. 4a, the 3TT-o-2F thin film exhibits significantly higher scattering intensity in the out-of-plane (qz) direction compared to the 3TT-m-2F thin film. As can be observed from both the 1D profiles and 2D images, both acceptor molecules display distinct (010) peaks in the out-of-plane direction, indicating a predominant in-plane orientation. As shown in Fig. 4b, the (010) π-π stacking diffraction peaks for the neat 3TT-m-2F and 3TT-o-2F thin films are located at 1.70 and 1.72 Å−1, respectively. Consequently, 3TT-o-2F demonstrates a π-π stacking distance of 3.65 Å, which is slightly shorter than that of 3TT-m-2F (3.69 Å). Additionally, both the D18:3TT-m-2F and D18:3TT-o-2F blend films exhibit a predominantly in-plane molecular orientation with intense (010) diffraction peaks. Furthermore, the crystal coherence lengths (CCLs) [44] are calculated to be 19.27 and 25.40 Å for D18:3TT-m-2F and D18:3TT-o-2F blend films, respectively (Table S4 in Supporting information). Compared to 3TT-m-2F, 3TT-o-2F exhibits a shorter intermolecular π-π stacking distance, along with a significantly increased CCL in its blend film. This optimized molecular ordering characteristic reflects its strong crystallinity, which in turn leads to higher carrier mobility in the device and provides a structural basis for efficient charge transport.
Figure 4
Figure 4.
(a) 2D GIWAXS patterns and (b) 1D scattering profiles of the neat 3TT-m-2F and 3TT-o-2F films and the corresponding blend films.
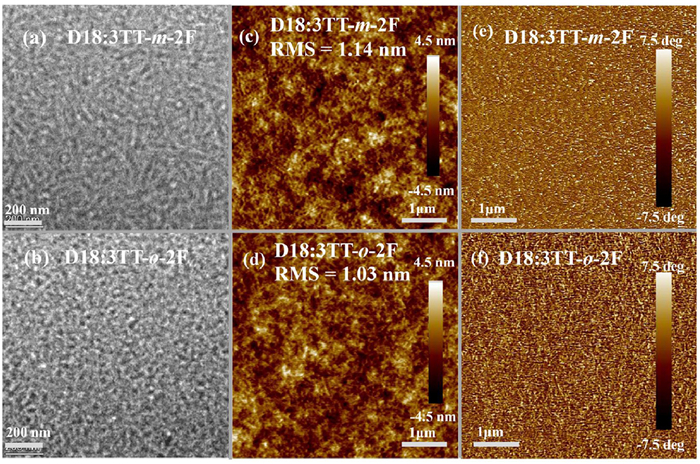
To gain a more profound understanding of the photovoltaic performance exhibited by different acceptors, we utilized transmission electron microscopy (TEM) and atomic force microscopy (AFM) to conduct in-depth characterizations of the bulk microstructure and surface morphology of the blend films. The corresponding results are presented in Fig. 5. As shown in Figs. 5a and b, in comparison with the coarse fiber structure of the D18:3TT-m-2F blend film, the D18:3TT-o-2F blend film demonstrates more homogeneous morphological features, characterized by a finer and more densely packed nanofiber network. Furthermore, as illustrated in Figs. 5c and d, through high-precision measurement, the surface roughness of the D18:3TT-o-2F blend film is measured to be 1.03 nm, which is significantly lower than the 1.14 nm measured for the D18:3TT-m-2F blend film. Simultaneously, the outcomes of atomic force microscopy phase imaging, as shown in Figs. 5e and f, indicate the existence of fine and closely-arrayed fibrous crystallites within the D18:3TT-o-2F blend film. This finding strongly corroborates the observations made via TEM. The D18:3TT-o-2F blend film showcases a more optimized bicontinuous network structure. Such a structure is highly conducive to the efficient transport of charges, ultimately conferring upon it exceptional photovoltaic performance.
Figure 5
Figure 5.
TEM and AFM images of D18:3TT-m-2F (a, c, e), D18:3TT-o-2F blend films (b, d, f).
In conclusion, we have successfully designed and synthesized two asymmetric NFREA materials, designated as 3TT-m-2F and 3TT-o-2F, respectively. These materials are structural isomers resulting from the introduction of two fluorine atoms at different substitution positions on the side chains. The adoption of asymmetric molecular architectures and side-group fluorination strategies exerts a profound influence on the electronic characteristics and aggregation behaviors of these materials. Specifically, the MPI of the ortho-difluoro configuration is markedly higher than that of its meta-difluoro counterpart. Compared with 3TT-m-2F, 3TT-o-2F exhibits distinct features, including a redshift in the absorption spectrum, enhanced molecular packing density, and an extended exciton diffusion length. Moreover, the D18:3TT-o-2F blend film exhibits a well-defined nanofiber network morphology. This unique structure significantly promotes efficient charge migration, thus enabling the achievement of a high charge mobility. As a result, the photovoltaic device based on D18:3TT-o-2F achieves an impressive PCE of 17.16%, along with a Voc of 0.89 V, a Jsc of 24.16 mA/cm2, and an FF of 78.72%. In sharp contrast, the device based on 3TT-m-2F has a relatively lower PCE of 15.36%. In essence, this study has significantly elevated the photovoltaic performance of acceptor materials through the strategic introduction of fluorine atoms into the side chains and the adoption of asymmetric molecular designs. The findings offer highly valuable references and insights for the rational design and optimization of high-performance NFREA materials in the field of OSCs.
The authors declare that they have no known competing financial interests or personal relationships that could have appeared to influence the work reported in this paper.
Acknowledgments
Financial support from the National Natural Science Foundation of China (Nos. 22375024, 21975031, 52433007, and 52173174), the Natural Science Foundation of Shandong Province (No. ZR2022YQ45), the Taishan Scholars Program (Nos. tstp20221121 and tsqnz20221134), The Beijing Natural Science Foundation (No. 2244073), Supported by State Key Laboratory of Bio-Fibers and Eco-Textiles (Qing-dao University) (No. RZ2200002821) is acknowledged.
Supplementary materials
Supplementary material associated with this article can be found, in the online version, at doi:10.1016/j.cclet.2026.112438.
Figure 1
(a) UV–vis absorption spectra of 3TT-m-2F and 3TT-o-2F in chloroform solutions. (b) UV–vis absorption spectra of their corresponding thin films. (c) Energy band diagrams of 3TT-m-2F and 3TT-o-2F. (d) ESP distributions and calculated MPI values of the side groups of 3TT-m-2F and 3TT-o-2F. (e) ESP distributions and calculated MPI values for the entire molecular systems of 3TT-m-2F and 3TT-o-2F. (f) Optimal molecular conformations of 3TT-m-2F and 3TT-o-2F calculated via DFT.
Figure 2
Performance and photoelectric characteristics of the 3TT-m-2F and 3TT-o-2F based devices, (a) J-V curves, (b) EQE spectra, (c) EQEEL curves, (d) dependence of Jph on Veff and (e) dependence of Voc on Plight. (f) The detailed Eloss of OSCs.
Figure 3
The TA image and various decay times of D18:3TT-m-2F (a, b), D18:3TT-o-2F (d, e); Singlet exciton decay dynamics with different excitation fluence for neat films of 3TT-m-2F (c) and 3TT-o-2F (f).


 DownLoad:



 下载:


 下载:

