Figure 1.
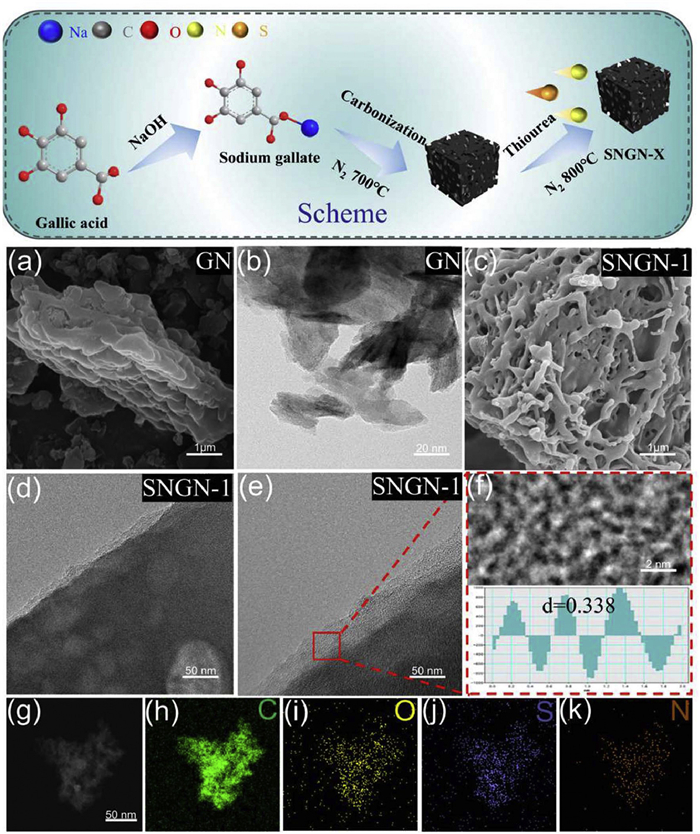
Microstructural characterization. (a) GN. (b) HRTEM images of GN. (c) SEM visualization of SNGN-1. (d, e) HRTEM. (f) The magnified view of a local area in (e). (g) HAADF of SNGN-1. (h-k) EDS mapping of C, O, S, and N.
Enhanced Na+ adsorption by S-N Co-doped porous carbon from sodium gallate toward high-performance dual-carbon sodium-ion hybrid capacitors
Haoyang Peng , Rumeng Ji , Zehui Liu , Yongjie Bai , Minjie Wang , Xiaodan Huang

Battery-type materials with exceptional charge storage capacity and capacitive materials featuring fast electrochemical dynamics continue to attract significant attention in the field of energy storage [1,2]. However, both material categories suffer from inherent limitations in power or energy density, which impede their capacity to satisfy the dual demands of high power and energy densities simultaneously [3-5].
Heteroatom doping (e.g., S and N) has been demonstrated as one of the most potent approaches to enhance Na-storage performance of carbon-based anode materials [6-8]. Given its high radius of covalent bonding, sulfur can efficiently elongate the interlayer spacing of carbon materials [9], thereby enabling reversible sodiation/desodiation of sodium ions between the carbon layers [10-13]. Furthermore, the interaction between thio-moieties and sodium-ions in reversible pseudocapacitive reactions provides additional reversible capacity, offering a key pathway to enhance electrode electrochemical performance [14].
Hence, sulfur-incorporated carbon anodes are considered a rational strategy to optimize kinetics pertaining to sodium-ion hybrid capacitors. In the carbon framework, the predominant sulfur-doped configurations were C-S-C (thiophene-type sulfur), C-SOx-C (oxidized sulfur, x = 1, 2, 3), and C-SH (thiol group), which govern the sodium storage mechanism [15], while the doping of nitrogen atoms boosts the electronic conductivity and electron-donating capability of carbon materials by introducing extrinsic defects (e.g., lattice distortions), which act as conductive pathways and active sites to enhance these properties synergistically [16].
Sodium gallate, a gallic acid-derived salt precursor, has abundant oxygen-containing groups and a well-defined structure. It not only provides sufficient carbon for graded porous carbon frameworks but also facilitates uniform S/N doping. In this study, we synthesized gallic acid-derived S, N co-doped porous carbon, whose unique structural design enables the simultaneous achievement of high heteroatom doping, maintenance of structural stability, and clear elucidation of the hybrid energy storage mechanism. The gallic acid-derived S, N co-doped porous carbon (SNGN-1), featuring 1.31% sulfur and 4.02% nitrogen contents, a specific surface area as high as 867 m2/g, as well as an interlayer spacing of 0.338 nm. As the anode for SIBs, SNGN-1 exhibits excellent sodium storage performance, with an initial reversible capacity of 585 mAh/g under 0.1 A/g. The all-carbon SIHC [17] constructed with SNGN-1 as the anode demonstrates remarkable performance: a high capacity of up to 110.13 mAh/g at low current densities; a retained capacity of 42.78 mAh/g under 5 A/g; a capacity retention rate of still 81.8% after 10,000 cycles under high current conditions; and a power density of 165.2 W/kg when the energy density reaches 218.6 Wh/kg. Compared with conventional sodium-ion batteries, SNGN-1 achieves an overall enhancement in electrochemical performance.
Scheme demonstrates the synthesis approach toward sulfur and nitrogen enrichment graded porous carbon nano-networks (SNGN-X). Specifically, gallic acid and NaOH were homogenized in deionized water, freeze-dried, then carbonized at 700 ℃. After impurity removal, gallate's initial carbonized product (GN) was obtained. Finally, doping with thiourea gave SNGN-X (X = thiourea-to-carbon mass ratio).
The micromorphology of the sodium-gallate carbonized sample and the sample with a doping ratio of 1 (GN and SNGN-1) was investigated by SEM and TEM analyses. As depicted in Fig. 1a, the sample exhibits a "droplet-like" particle stacking morphology, with particle lengths of 400–900 nm and widths of 200–400 nm. Fig. S1 (Supporting information) reveals that among all sulfur-nitrogen co-doped samples, SNGN-1 features a loose porous structure. Fig. 1b presents the SEM micrographs of SNGN-1, which was derived from high-level sulfur-nitrogen co-doping and secondary carbonization of GN. SNGN-1 displays an overall "nano-network" configuration with thinner architectures and prominently etched edges. Notably, the introduction of sulfur-nitrogen elements results in a smoother surface for SNGN-1. In addition, the surface micromorphology of the samples was characterized by means of TEM. Fig. 1c shows that GN exhibits a tiered stacked structure. Figs. 1d and e present more detailed HRTEM images of SNGN-1, revealing disordered lattice stripes that confirm its amorphous structure [18]. The interlayer spacing of SNGN-1, calculated from the lattice fringes, was 0.338 nm, a value larger than that of natural graphite (0.335 nm) (Fig. 1g). This increase in the interlayer distance of SNGN-1 may be attributed to the elevated level of structural defects resulting from sulfur-nitrogen doping [19,20]. In addition, EDS mapping was used to investigate the distribution of major elements in SNGN-1. As shown in Figs. 1h–k, the major elements (carbon, oxygen, sulfur, and nitrogen) were uniformly distributed throughout the SNGN-1 samples, the successful embedding of sulfur and nitrogen elements into the carbon structure was verified.
Microporous structural characteristics of thiourea-doped samples with varying mass ratios (denoted as SNGN-X) were presented in Fig. S2 and Table S1 (Supporting information). As illustrated, the pore volume of the samples exhibits a tendency to first increase and then decrease with the elevation of thiourea doping ratio. Among these samples, SNGN-1 (doping ratio = 1) displays the largest void volume of 0.648 cm3/g. This feature facilitates ion diffusion kinetics and thereby enhances electrochemical performance.
As shown in Fig. 2a, GN and SNGN-1 exhibit characteristic type IV nitrogen adsorption-desorption isotherms characterized by H3 hysteresis loops, this feature was indicative of the presence of a hierarchical porous structure dominated by mesopores [21]. In addition, SSA determined of GN and SNGN-1 were 225 and 867 m2/g, respectively (Fig. 2b). Sulfur-nitrogen doping induced a significant increase in specific surface area, and derived pore-size distributions revealed obvious differences between the two samples. For a deeper evaluation of the influence of S-N doping-induced effects on the channel structure of SNGN-1, the channel volumes of heterogeneous pore morphologies were quantified, and the results were presented in Fig. 2c. Notably, the microporous volume (V< 2 nm, 0.3 cm3/g vs. 0.036 cm3/g), mesoporous volume (V2-50 nm, 0.212 cm3/g vs. 0.027 cm3/g), and macroporous volume (V> 50 nm, 0.1 cm3/g vs. 0.038 cm3/g) of SNGN-1 were all higher than those of GN. During calcination, sulfur exists as sulfur vapor, sulfur oxides, and sulfates, reacting with the carbon framework to disrupt its order and form new pores. Such an increase in meso– and macropore volumes facilitates rapid sodium-ion diffusion and enhances sodium storage capacity [22].
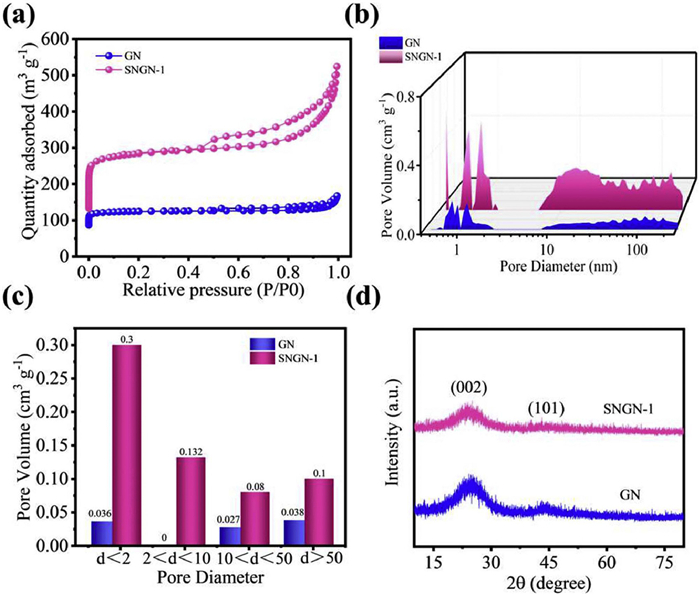
Fig. 2d displays XRD patterns for GN and SNGN-1. The amorphous nature of both samples was further confirmed by the broadened (002) and (101) diffraction signal peaks at 22° and 43°, which were consistent with the HRTEM results. Due to the erosive effect of elemental sulfur, the (002) peak intensity of SNGN-1 was significantly reduced compared to GN, indicating a more disordered carbon structure in SNGN-1 [23].
Fig. 3a presents the Raman of GN and SNGN-1. The D band corresponds to approximately 1345 cm-1 and the G band to approximately 1575 cm-1, with such slight peak shifts attributed to doping. As an indicator of the level of graphitization for carbon-derived anodes, the ID/IG ratio of SNGN-1 (1.045) was higher than that of GN (0.954), indicating a higher carbon defect density and lower graphitization degree. The structure with numerous defects of SNGN-1 was beneficial for improvement in rate performance [24,25].
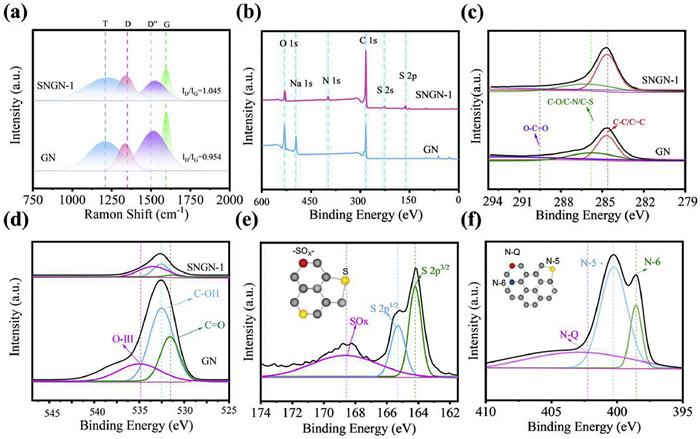
XPS measurements were characterized the elemental compositions of GN as well as SNGN-1 surfaces. As depicted in Fig. 3b, GN exhibits characteristic peaks equivalent to C 1s (284.7 eV), O 1s (529.8 eV), and Na 1s (513 eV) [26]. In contrast, SNGN-1 displays additional peaks of S 2p (165 eV), S 2s (226.7 eV), and N 1s (401 eV) besides Na 1s [27], confirming the successful introduction of sulfur and nitrogen elements into GN. Notably, quantitative analysis (Table S2 in Supporting information) reveals that SNGN-1 contains as high as 1.31% sulfur and 4.02% nitrogen, values exceeding most reported sulfur/nitrogen contents in sulfur-nitrogen-doped carbon-based anodes [28-31]. This finding verifies the successful introduction of sulfur and nitrogen into the carbon framework [32]. A further analysis of the functional group contents was conducted. Results from the deconvolution of C 1s were shown in Fig. 3c. The spectrum exhibits three characteristic peaks at 284.7, 285.8, and 289.1 eV, relating to C–C/C=C, C–O/C–S/C–N, and O–C=O groups. For the O 1s spectrum, three oxygen-containing groups C=O, C–OH, and carboxyl groups were identified at 530.9, 531.5, and 535.2 eV, respectively (Fig. 3d). In Fig. 3e, three prominent peaks at 164.2, 165.4, and 168.7 eV were observed. The peaks at 164.2 and 165.4 eV were assigned to sulfur atoms in the C-S-C 2p1/2 and 2p3/2 orbitals, respectively, while the peak at 168.7 eV corresponds to oxidized sulfur in C-SOX-C. Among these, the covalent incorporation of sulfur atoms induces the expansion of interlayer spacing, and the dominant C-S-C 2p3/2 component provides additional electrochemical active sites, thereby contributing to the enhancement of capacitance [33]. The contents of the three elements sulfur-containing functional groups were 29.90%, 40.18%, and 29.90%, respectively. The high proportion of C-S-C 2p3/2 indicates that elemental sulfur has formed covalent bonds with the carbon skeleton. As shown in Fig. 3f and Table S3 (Supporting information), three prominent peaks at 398.6, 400.4, and 402.1 eV were detected. Specifically, the peaks at 398.6 and 400.4 eV were assigned to pyridinic-N (N-6, 22.10%) and pyrrolic-N (N-5, 53.40%), respectively. The dominant N-5 acts as an electrochemically active group, capable of undergoing Faradaic reactions with Na+ to provide additional capacity. Furthermore, the characteristic peak at ~402.1 eV was assigned to graphitic-N (N-Q, 24.49%), a moiety rich in lone pair electrons that effectively boosts the material's electrical conductivity. The C-S-C bonds enhance the electrolyte wettability and accelerate ion diffusion, while N–5 provides additional active sites for pseudocapacitive Na+ adsorption, collectively promoting the capacitance-dominated storage mechanism [34].
Electrochemical performance of SNGN-1 serving as a SIHC anode was assessed via cyclic voltammetry (CV) as well as galvanostatic charge-discharge (GCD). As illustrated in Fig. S3 (Supporting information), SNGN-1 exhibits superior sodium storage performance compared to other samples. Fig. 4a shows the initial three CV curves of SNGN-1 measured at 0.5 mV/s: The curves for the three cycles nearly overlap, featuring a sharp reversible reduction peak at 0.1 V, primarily attributed to sodium-ion intercalation. Furthermore, two reversible cathodic peaks were observed in the CV curves of subsequent cycles at ~1.43 V and ~1.84 V, along with four reversible anodic peaks at ~0.10, 1.57, 1.82, and 2.19 V. The cathodic peak at ~1.43 V (Cath-1) and anodic peak at ~1.57 V (Ano-2) are ascribed to the pseudocapacitive Faradaic reactions between pyrrolic N (N–5) and Na+. The cathodic peak at ~1.84 V (Cath-3) and anodic peak at ~1.82 V (Ano-3) originate from the surface redox reactions of C-S-C bonds (thiophene-type sulfur) with Na+, while the anodic peak at ~2.19 V (Ano-4) is attributed to the reversible interactions between oxidized sulfur (C-SOx-C) and Na+. The introduction of nitrogen alters the electron cloud density of carbon materials, imparting local positive charges to bind anions; sulfur, through valence state changes, participates in redox reactions and increases the number of electrochemical active sites [35]. The nearly overlapping curves across cycles indicate that SNGN-1 maintains stable reversibility [36,37]. Fig. 4b shows the GCD profiles of SNGN-1 at 0.1 A/g for the first three cycles. During initial cycling, the discharge and charge capacities were 650.2 and 670.7 mAh/g, which is attributed to the delayed activation of additional active sites [38]. This efficiency was significantly higher than that of the GN sample; the rate performance of the SNGN-1 anode, as illustrated in Fig. 4c, exhibits notable stability with varying current densities—when the current density increases from 0.1 A/g to 5 A/g, its reversible charge capacity decreases from 585 mAh/g to 160.6 mAh/g, and more importantly, once the current density is reduced back to 1 A/g, the reversible capacity can be restored to 245.9 mAh/g, a phenomenon that clearly demonstrates the SNGN-1 anode's excellent rate capability and reversibility, mainly attributed to its structural stability and hierarchical porous architecture. Beyond rate performance, further investigation into the SNGN-1 anode's cycling stability was conducted at two typical current densities: Specifically, at 0.1 A/g, it maintains a stable reversible storage capacity of 500.88 mAh/g after 10 cycles with a coulombic efficiency approaching 74.6%, while for comparison, the GN sample shows much lower reversible capacities after the same 10 cycles (only 153.3 mAh/g at 0.1 A/g and 40.8 mAh/g at 5 A/g), further highlighting the superior electrochemical performance of the SNGN-1 anode.
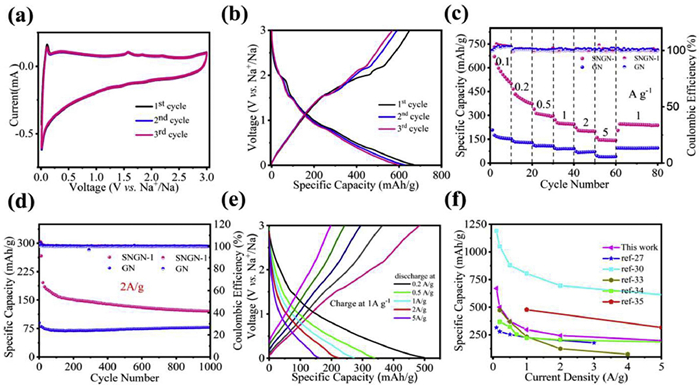
As shown in Fig. 4d, prolonged cycling of SNGN-1 at a high current density of 2 A/g for over 1000 consecutive cycles reveal a stable reversible capacity of 121 mAh/g, with negligible capacity decay from the 200th to 1000th cycle. Sulfur-nitrogen co-doping and pore volume synergistically enhanced the material's sodium storage capacity, rate performance, and cycling stability by optimizing ion transport, increasing active sites, and reinforcing the capacitive energy storage mechanism. These results demonstrate that SNGN-1 demonstrates high reversible capacity, remarkable rate capability, and a lengthy cycle life, indicating that Na+ intercalated in SIBs can be fully deintercalated at high current densities.
To ensure sufficient and uniform sodiation/activation of the electrode while enabling accurate evaluation of capacity retention and kinetic characteristics at different discharge rates. Fig. 4e displays the discharge profile of SNGN-1 across a range of current densities after charging at 1 A/g. Notably, SNGN-1 retains a specific discharge capacity of 160 mAh/g even at a high current density of 5 A/g, confirming its superior sodium storage performance. As illustrated in Fig. 4f, such exceptional electrochemical performance outperforms numerous previously reported carbon-based anode materials for SIHCs or SIBs.
To further clarify the reaction types and energy storage mechanisms, CV tests were performed on SNGN-1, as depicted in Fig. 5a. The contribution of capacitive effects was investigated via CV at varying scan rates:
|
|
(1) |
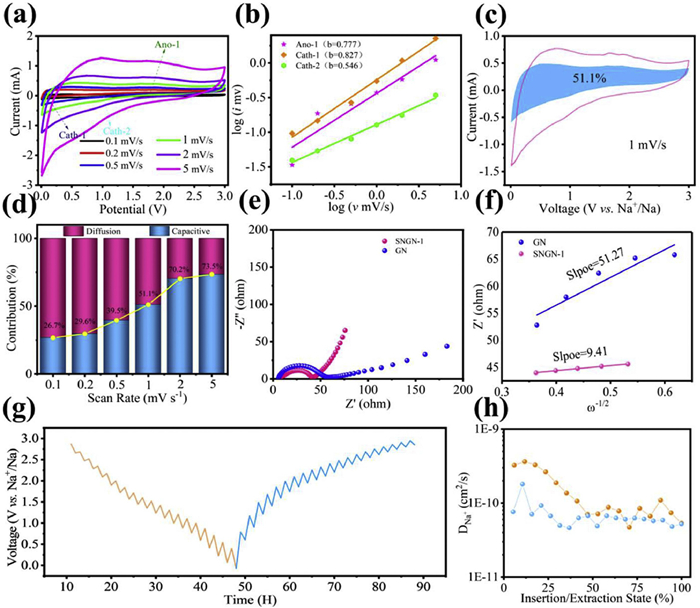
i represented the peak current, v denoted the scan rate, and a and b were fitting parameters. Plotting logi against logv allows for the determination of the fitting parameters a and b. As shown in Fig. 5b, the measurement results indicate that the b-value of the Cath-2 cathodic peak was 0.546. The b-value of the Ano-1 anodic peak is 0.777, and this result indicates that the sodium storage behavior at the corresponding potential is dominated by capacitive effects [39].
The following formulas were further used to quantify the proportions of battery-behavior capacity and capacitive-behavior capacity:
|
|
(2) |
As shown in Fig. 5c, SNGN-1 exhibits a 51.1% capacitive contribution at 1 mV/s (blue area). Fig. 5d illustrates the deconvoluted faradaic and capacitive current components of SNGN-1, where k1v and k2v1/2 denote the faradaic and capacitive current responses, respectively, quantified by fitting parameters k1 and k2. Notably, the capacitive proportion increases from 26.7% to 29.6%, 39.5%, 51.1%, 70.2%, and 73.5% as the scanning rate escalates through 0.1, 0.2, 0.5, 1, 2, and 5 mV/s, indicating that sulfur-containing nitrogen functional groups dominate the capacitive behavior at high rates. This unique sodium storage mechanism endows SNGN-1 with enhanced sodium-ion kinetics, thereby improving its rate performance.
The EIS characterization of the SNGN-1 post-1000 cycles was shown in Fig. 5e. In the high-frequency region, the charge transfer resistance (Rct) of SNGN-1 is significantly lower than that of GN. As illustrated in Fig. 5f, compared to GN, SNGN-1 shows smaller σ, confirming that sulfur doping enhances ionic conductivity and Na+ diffusion, endowing SNGN-1 with superior rate capability.
For the SNGN-1 electrode in a Na-ion half-cell GITT test (Fig. 5g), the Na+ diffusion coefficients (DNa+) during sodiation and desodiation ranged from 3.6 × 10⁻¹⁰ cm2/s to 3.58 × 10⁻¹¹ cm2/s, demonstrating rapid Na+ diffusion kinetics in SNGN-1. This behavior was ascribed to the smaller ionic radius of Na+, which enables intercalation into carbon interlayers with lower energy barriers and reduced resistance, thus facilitating fast kinetic processes during sodium storage.
Notably, Fig. 5h reveals that DNa+ exhibits a distinct trend: A moderate increase, followed by a decline, a slow rise, and subsequent repeated decline, ultimately reaching a minimum as sodiation progresses. This phenomenon was attributed to preferential Na+ intercalation at the SNGN-1 surface over the carbon interlayer. Initially, Na+ occupies surface sites, then diffuses into internal structural defects. During this process, DNa+ decreases due to resistance from pre-anchored ions. With the increase in diffusion distance, DNa+ reaches a minimum but slightly increases afterward, likely due to adsorption on internal pore surfaces, which enhances ion transport pathways.
The GITT was employed to measure the DNa+ of SNGN-1, with the method relying on voltage relaxation measurements during current pulse intervals to derive ionic mobility parameters. According to Eq. S3 (Supporting information), the calculated DNa+ values during sodiation and desodiation processes reached up to 3.6 × 10⁻¹⁰ cm2/s, indicating rapid Na+ diffusion kinetics in SNGN-1.
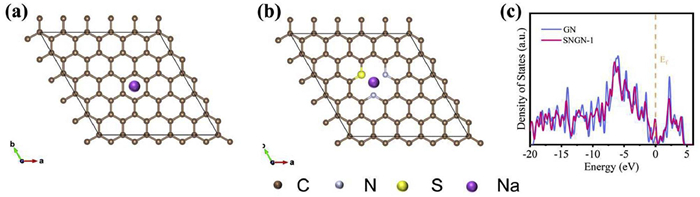
In this study, first-principles calculation methods were employed to systematically evaluate the adsorption energy of sodium ions (Na+) on the material surface and the density of states (DOS) of the system. Among these parameters, the adsorption energy served as a key indicator for measuring the adsorption stability of Na+ on the material surface, while the density of states could effectively characterize the charge transfer capability within the material.
First-principles calculations were performed to investigate the sodium-ion adsorption behavior on the surfaces of both doped and undoped carbon samples (Figs. 6a and b). The calculation results showed that the adsorption energy (Ead) of Na+ on the nitrogen/sulfur co-doped porous carbon (SNGN-1) material was −1.936 eV. In contrast, the adsorption energy of the undoped porous carbon (GN) material was −0.709 eV. This result clearly confirmed that N/S co-doping could significantly enhance the adsorption stability of the material towards Na+. The underlying mechanism was presumably closely related to the chemical bonds formed in the material framework after heteroatom doping. From the DOS spectrum of the N/S co-doped system (Fig. 6c), it could be observed that after the introduction of heteroatoms, the intensities of the valence band and conduction band peaks near the Fermi level were significantly enhanced [40]. This phenomenon indicated an increase in the number of electronic states at the Fermi level, which could effectively improve the electrochemical conductivity and chemical reaction activity of the material. This enhanced adsorption capability gives rise to an increased number of pseudocapacitive active sites, which correlates well with the elevated capacitive contribution ratio observed in the experimental results above. To further balance the reaction kinetics between the cathode and anode, high-performance SIHCs were fabricated by optimizing the mass ratio of active materials. Specifically, SIHCs with cathode-to-anode mass ratios of 1:0.5, 1:1, and 1:1.5 were designed for electrochemical performance evaluation, and the optimal ratio was determined via supplementary Fig. S4 (Supporting information). At a current density of 1 A/g, the SIHC with a 1:1 mass ratio exhibited the longest discharge time, which directly indicates its highest reversible specific capacity. Therefore, this cathode-to-anode mass ratio was selected to construct the APE-2//SNGN-1 all-carbon SIHC.
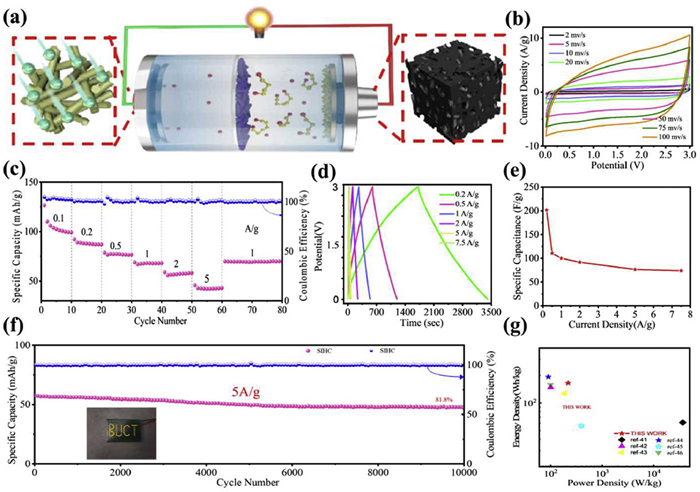
KOH-activated phosphorus-doped porcine-derived carbon, denoted as APE-2. To evaluate the practical applicability of SNGN-1 in SIHCs, Fig. 7a shows APE-2 and SNGN-1 were assembled act as the cathode & anode in that order, to fabricate an SIHC device (denoted as APE-2∥SNGN-1). As illustrated in Fig. 7b, the CV of APE-2∥SNGN-1 exhibit a rhomboid shape with no distinct polarization. To systematically evaluate the structural stability and electrochemical reversibility of the electrode material after undergoing high-rate cycling stress. The rate performance in Fig. 7c demonstrates that APE-2∥SNGN-1 delivers an impressive reversible specific capacity of 110.1 mAh/g at 0.1 A/g, maintaining 45.7 mAh/g even at 5 A/g. This excellent rate capability of APE-2∥SNGN-1 stems from the fast kinetics of both the APE-2 cathode and SNGN-1 anode. The GCD were nearly linear (Figs. 7d and e), confirming a capacitor-dominated energy storage mechanism. Fig. 7f demonstrated that APE-2∥SNGN-1, which exhibited excellent cycling performance, retained 81.8% of its original capacity after 10,000 cycles with a current density of 5 A/g. The energy density and power density of the APE-2∥SNGN-1 device are depicted in the Ragone plot (Fig. 7g and Table S4 in Supporting information), achieving impressive values of 165.2 Wh/kg and 218.6 W/kg [41-46]. More importantly, the fully charged APE-2∥SNGN-1 device can power a "BUCT" pattern composed of dozens of soldered LEDs (inset in Fig. 7f), which demonstrates substantial application prospects in the field of high-performance energy storage.
In this study, SNGN-1 was prepared by introducing heteroatoms after the controllable synthesis of sodium gallate. As the anode of a sodium-ion half-cell, it exhibits excellent performance, with a reversible capacity of 585 mAh/g at 0.1 A/g and 160 mAh/g at 5 A/g. Sulfur and nitrogen doping enhances sodium storage performance by improving ionic conductivity and reinforcing capacitive mechanisms. The all-carbon sodium-ion hybrid capacitor constructed with SNGN-1 and APE-2 achieves a power value density of 165.2 W/kg at energy-storage density of 218.6 Wh/kg, which exhibits an ultra-long cycle life of up to 10,000 cycles at a current density of 2 A/g and shows significant application prospects.
The authors declare that they have no known competing financial interests or personal relationships that could have appeared to influence the work reported in this paper.
Haoyang Peng: Writing – original draft, Methodology, Investigation, Formal analysis, Data curation. Rumeng Ji: Methodology. Zehui Liu: Investigation. Yongjie Bai: Investigation. Minjie Wang: Writing – review & editing, Methodology, Investigation, Formal analysis, Data curation, Conceptualization. Xiaodan Huang: Writing – review & editing, Methodology, Conceptualization.
This work was supported by the National Natural Science Foundation of China (No. 22209087), Young Backbone Teacher Training Program of Henan Province Undergraduate Colleges (No. 2024GGJS133), the Key Science and Technology Project of Henan Province (No. 252102230087). The authors also acknowledge the financial support from the Australian Research Council, the University of Queensland and Flinders University.
Supplementary material associated with this article can be found, in the online version, at doi:
H. Chen, C. Zhao, H. Yue, et al., Chin. Chem. Lett. 36 (2025) 109650. doi: 10.1016/j.cclet.2024.109650
Q. Xia, K. Yan, K. Jin, et al., Chin. Chem. Lett. 36 (2025) 110406. doi: 10.1016/j.cclet.2024.110406
Z. Jia, Y. Duan, X. Chen, et al., Adv. Sci. 12 (2025) e06532. doi: 10.1002/advs.202506532
Z. Yang, H. Xue, Y. Zhang, et al., J. Energy Storage 129 (2025) 117377. doi: 10.1016/j.est.2025.117377
H. Peng, H. Liu, C. Li, et al., Chin. Chem. Lett. 36 (2025) 109556. doi: 10.1016/j.cclet.2024.109556
S. Liang, X. Wang, R. Qi, et al., Adv. Funct. Mater. 32 (2022) 2201675. doi: 10.1002/adfm.202201675
Y. Liu, Y. Guo, Y. Zhang, et al., Angew. Chem. Int. Ed. 64 (2025) e202505469. doi: 10.1002/anie.202505469
K. Kang, Y. Liu, J. Duan, et al., Small 21 (2025) 2412698. doi: 10.1002/smll.202412698
Q. Zhang, P. Man, B. He, et al., Nano Energy 67 (2020) 104212. doi: 10.1016/j.nanoen.2019.104212
J. Liang, Y. Peng, Z. Xu, et al., Chin. Chem. Lett. 36 (2025) 110452. doi: 10.1016/j.cclet.2024.110452
X. Yuan, S. Chen, J. Li, et al., Carbon Energy 3 (2021) 615–626. doi: 10.1002/cey2.98
H. Wan, X. Hu, J. Colloid Interface Sci. 558 (2020) 242–250. doi: 10.1016/j.jcis.2019.09.124
Y. Sun, M. Lian, X. Guo, et al., J. Energy Chem. 112 (2026) 435–443. doi: 10.1016/j.jechem.2025.08.041
Y. Wang, Y. Fang, Y. Chen, et al., Small 21 (2025) 2502544. doi: 10.1002/smll.202502544
G. Zhao, D. Yu, H. Zhang, et al., Nano Energy 67 (2020) 104219. doi: 10.1016/j.nanoen.2019.104219
B. Yan, L. Lin, C. Sun, et al., J. Mater. Chem. A 10 (2022) 17185–17198. doi: 10.1039/D2TA05119B
H. Peng, H. Li, Y. Liu, et al., ACS Omega 10 (2025) 49199–49206. doi: 10.1021/acsomega.5c08616
M. Lee, N. Lee, G. Kwon, et al., Small 21 (2025) 2502368. doi: 10.1002/smll.202502368
Y. Guo, H. Wang, C. Yang, et al., Adv. Funct. Mater. 35 (2025) 2510286. doi: 10.1002/adfm.202510286
X. Liang, X. Song, H.H. Sun, et al., Nat. Commun. 16 (2025) 3505. doi: 10.1038/s41467-025-58637-1
D. Qiu, C. Kang, A. Gao, et al., ACS Sustain. Chem. Eng. 7 (2019) 14629–14638. doi: 10.1021/acssuschemeng.9b02425
X. Zhao, Y. Li, Y. Wang, et al., Nat. Commun. 16 (2025) 5718. doi: 10.1038/s41467-025-60823-0
W. Qiu, Z. Chen, Z. Liu, et al., Adv. Funct. Mater. 35 (2025) 2422106. doi: 10.1002/adfm.202422106
Z. Huo, H. Fang, S. Lin, et al., Adv. Energy Mater. 15 (2025) 2501288. doi: 10.1002/aenm.202501288
S. Wu, J. Zhou, Q. Li, F. Wu, Adv. Funct. Mater. 35 (2025) 2507916. doi: 10.1002/adfm.202507916
J. Dong, Y. Dong, X. Cheng, et al., ACS Appl. Mater. Interface 17 (2025) 18319–18328. doi: 10.1021/acsami.4c22245
Q. Meng, L. Pan, C. Zhang, et al., New J. Chem. 46 (2022) 13866–13873. doi: 10.1039/D2NJ01823C
J. Li, Z. Ding, L. Pan, et al., Carbon 173 (2021) 31–40. doi: 10.1016/j.carbon.2020.10.092
Z.Y. Feng, K.K. Liu, B. Jin, et al., Ceram. Int. 47 (2021) 29941–29948. doi: 10.1016/j.ceramint.2021.07.168
S. Kandula, B. Sik Youn, J. Cho, et al., Chem. Eng. J. 439 (2022) 135678. doi: 10.1016/j.cej.2022.135678
Q. Li, Y.N. Zhang, S. Feng, et al., Int. J. Energy Res. 45 (2021) 7082–7092. doi: 10.1002/er.6294
X. Chen, S. Kong, D. Yu, et al., Carbon Neutral. 4 (2025) e70019.
L. Tao, Y. Yang, H. Wang, et al., Energy Storage Mater. 27 (2020) 212–225. doi: 10.1016/j.ensm.2020.02.004
M. Chen, B. Liang, X. He, et al., ACS Appl. Mater. Interface 17 (2025) 33770–33782. doi: 10.1021/acsami.4c22430
D. Pan, Y. Liu, M.A. Muhammad, et al., Energy Storage Mater. 80 (2025) 104392. doi: 10.1016/j.ensm.2025.104392
Y. Wang, Y. Zhang, J. Shi, et al., Energy Storage Mater. 18 (2019) 366–374. doi: 10.1016/j.ensm.2018.08.014
J. Song, J. Han, H.C. Ju, et al., Small Method 10 (2025) 2500671.
W. Qiu, Z. Chen, Z. Liu, et al., Adv. Funct. Mater. 35 (2025) 2422106. doi: 10.1002/adfm.202422106
J. Liang, J. Sun, X. Cao, et al., Adv. Sci. 12 (2025) 2502241. doi: 10.1002/advs.202502241
X. Zhao, Y. Li, Y. Wang, et al., Nat. Commun. 16 (2025) 5718. doi: 10.1038/s41467-025-60823-0
J. Xu, S. Dou, W. Zhou, et al., Nano Energy 95 (2022) 107015. doi: 10.1016/j.nanoen.2022.107015
L. Wei, T. Cao, D. Li, et al., ACS Appl. Mater. Interfaces 14 (2022) 17547–17559. doi: 10.1021/acsami.2c02644
H. Wang, Y. Wang, Y. Liu, et al., ACS Appl. Mater. Interface 14 (2022) 56919–56929. doi: 10.1021/acsami.2c19347
S. Dong, L. Wu, M. Xue, et al., ACS Appl. Energy Mater. 4 (2021) 1568–1574. doi: 10.1021/acsaem.0c02758
X. Yuan, S. Qiu, X. Zhao, ACS Appl. Mater. Interface 13 (2021) 34238–34247. doi: 10.1021/acsami.1c07535
J. Lin, J. Liu, L. Shao, et al., ACS Appl. Mater. Interface 17 (2025) 38089–38099. doi: 10.1021/acsami.5c07479

Figure 1 Microstructural characterization. (a) GN. (b) HRTEM images of GN. (c) SEM visualization of SNGN-1. (d, e) HRTEM. (f) The magnified view of a local area in (e). (g) HAADF of SNGN-1. (h-k) EDS mapping of C, O, S, and N.

Figure 2 (a) N2 adsorption-desorption isotherms of GN and SNGN-1. (b) Pore size distribution. (c) Pore size histograms. (d) XRD.

Figure 3 GN and SNGN-1 of (a) Raman spectra. (b) XPS survey spectra. (c) C 1s. (d) O 1s. (e) S 2p. (f) N 1s.

Figure 4 Electrochemical properties of SNGN-1 in Na half-cell. (a) First three CV curves at 0.1 mV/s. (b) Initial three GCD curves at 0.1 A/g. (c) Rate capability. (d) Ultralong cycling stability at 2 A/g. (e) GCD curves of SNGN-1 charged at 1 A/g and discharged at varying current densities. (f) Comparison performance with other carbon-based anodes.

Figure 5 (a) CV curves at various scan rates. (b) Determination of b-values for cathodic and anodic peak currents. (c) Capacitive (blue region) and faradaic (white region) current contributions at 1 mV/s. (d) Normalized ratio of capacitive to faradaic capacities for SNGN-1 at different scan rates. (e) EIS analysis. (f) Linear fits of Z′ vs. ω−1/2 in the low-frequency region. (g) Schematic representation of the GITT curve for SNGN-1 in a Na+ half-cell. (h) Variation of DNa+ during discharge and charge processes.

Figure 6 First-principles calculations for Na+ adsorption behavior on the carbon surface of (a) GN, (b) SNGN-1. (c) Corresponding density of states of GN and SNGN-1.

Figure 7 (a) Schematic illustration of the APE-2//SNGN-1 SIHC device. (b) CV curves at various scan rates. (c) Rate capability. (d, e) GCD curves and specific capacity at different current densities. (f) Cycling stability at 2 A/g (inset: digital photograph of LEDs powered by the SIHC). (g) Ragone.

 扫一扫看文章

扫一扫关注我们
 DownLoad:
 下载:
下载:
 下载:
下载: