Engineering Research Center of Ministry of Education for Geological Carbon Storage and Low Carbon Utilization of Resources, Beijing Key Laboratory of Materials Utilization of Nonmetallic Minerals and Solid Wastes, National Laboratory of Mineral Materials, Hebei Key Laboratory of Resource Low-carbon Utilization and New Materials, School of Materials Science and Technology, China University of Geosciences (Beijing), Beijing 100083, China
b.
School of Materials Science and Engineering, Beijing Institute of Technology, Beijing 100081, China
c.
Institute of Molecular Plus, Department of Chemistry, Tianjin University, Tianjin 300072, China
Received Date:
19 December 2025 Accepted Date:
08 January 2026 Revised Date:
06 January 2026 Available Online:
15 July 2026
Abstract:
Supported catalysts are an effective approach in proton exchange membrane water electrolysis (PEMWE) owing to their enhanced metal-support interfacial interaction. We propose a novel high-temperature shock (HTS) technique by Joule-heating to construct an electronic coupling interface between IrO2 nanoclusters catalysts and TiO2 support (IrO2/TiO2-HTS). The HTS strategy features an ultrafast heating rate and compresses the synthesis time from hours to seconds (2 h to 60 s). The as-prepared catalyst features uniformly embedding the ultrafine IrO2 nanoclusters enrich oxygen vacancies within the redox-active metal oxide matrix, yielding exceptional mass activity and ultrastable performance. The mass activity of the catalyst is 1081 A/gIr at 1.6 V vs. RHE, 13 times higher than of commercial IrO2, and it demonstrates operation time for over 1100 h at 10 mA/cm2 with a voltage decay rate of only 40 μV/h. This HTS strategy offers a scalable route to accelerate vacancy engineering and strong metal oxide-support interaction (SMOSI) formation, enabling high activity at reduced Ir loading and long-term stability under acidic conditions. The approach is general and can be extended to other supported binary oxides, opening opportunities for the development of additional high–performance OER catalysts and PEM–relevant electrolysis systems.
Proton exchange membrane water electrolysis (PEMWE) has been considered as a promising technology for the production of green hydrogen in a decarbonized future owing to its high current density, hydrogen purity, and conversion efficiency [1–4]. However, its widespread application is hindered by the reliance on rutile-type IrO2, which typically requires iridium (Ir) loadings usually as high as 2-4 mgIr/cm2 [5,6]. The scarcity-induced high cost of iridium creates a significant barrier to large-scale application [7]. This challenge is clearly outlined by the U.S. Department of Energy (DOE) 2026 technical targets, which call for a substantial reduction in noble metal loading to 0.5 mg/cm2 while achieving 3.0 A/cm2 @ 1.8 V in PEMWE [8]. This highlights the urgent need to enhance the intrinsic catalytic activity of iridium. To address this challenge, developing supported catalysts [9,10] has become an effective strategy to improve iridium utilization by exposing more catalytic sites and providing robust anchoring of nanoparticles. Representative catalysts such as IrO2@TiO2 [11], Ir/CeOx [12], and IrO2@TaOx@TaB [13] show enhanced catalytic performance. Support materials such as TiO2 [14], SnO2 [15–17], TaOx [18,19], MnO2 [20], Co3O4 [21], and NbOx [22–24] can suppress catalyst agglomeration and dissolution, thereby mitigating the loss of active sites.
In recent years, the synthesis of supported iridium-based catalysts has been extensively investigated, including high-temperature annealing [18,25–27], photo/electrodeposition [28,29], co-precipitation [14,20], and wet-chemical reduction [12,30]. Yu et al. [31] employed wet-chemical reduction to synthesize an amorphous IrOx layer on a hollow TiO2 porous structure. However, post-annealing at 150 ℃ for 1 h was still required to achieve long-term stability (600 h@10 mA/cm2). Wang et al. [26] developed low Ir-loading catalysts via the Adams fusion method, which exhibited stable operation for over 500 h at 500 mA/cm2 in a PEM electrolyzer. Nevertheless, the synthesis involved a 3 h heating process with high energy consumption. Similarly, Wang et al. [32] constructed a continuous 15 nm IrOx coating layer through one-step annealing, achieving both a p-n junction interface and a conductive network. However, this approach suffered from high energy consumption and prolonged processing time. Zhang et al. [12] employed the polyol reduction method to synthesize an Ir/CeOx catalyst demonstrating outstanding durability with a voltage decay of 1.33 µV/h over 6000 h. Nonetheless, this strategy required ultrasonic assistance and prolonged aging time (3 h). Overall, the synthesis of these advanced supported catalysts reveals their own set of difficulties. Conventional approaches typically require protracted processing times, high energy consumption, and complex steps that can leave residues or cause undesirable particle agglomeration. Consequently, developing an ultrafast synthesis protocol that enables uniform anchoring of active sites and strong interfacial interactions is highly desirable.
The Joule heating-triggered high-temperature shock (HTS) strategy reported by Chen et al. [33–35] is characterized by an ultra-rapid heating/cooling rate (>105 K/s). This technique not only shortens synthesis times from hours to seconds but also reduces energy consumption [36]. Moreover, the rapid, non-equilibrium reaction kinetics can stabilize ultrafine nanoparticles and introduce a high density of beneficial defects (e.g., oxygen vacancy and Frank dislocation) [37,38]. Oxygen vacancies, in particular, can tune the electronic configuration of the catalyst and decrease charge-transfer resistance. Such modulation helps reduce the adsorption energy of catalytic intermediate species and lower the energy barrier of the rate-determining step (RDS), leading to substantial improvements in catalytic activity [39,40]. The HTS technique has been extensively employed in the rapid synthesis of binary alloys, high-entropy alloys. and supported electrocatalysts. For instance, Huang et al. [41] converted Ir precursors to IrO2 clusters (IrO2@Co(OH)2-NF) via a two-step Joule-heating process. The process preserved the layered support matrix and cluster active sites while strengthening electronic coupling between clusters and the support. Gao et al. [42] employed a millisecond HTS technique to synthesize carbon-supported Ir3Ni alloy nanoparticles with an average size of 4.85 nm, achieving a mass activity of 2.37 A/mgIr. Similarly, Chen et al. [43] prepared a dislocation-strained IrNi alloy via a non-equilibrium HTS route, where high-energy surfaces induced by dislocations can efficiently inhibit surface reconstruction. Cui et al. [44] developed a liquid-HTS synthesis of high-entropy alloys (PtCoNiRuIr) in 60 s with controlled composition and lattice strain. Zhou et al. [45] successfully synthesized Fe0.15Co0.40Ni0.05Pt0.32Pd0.08 high-entropy alloys via rapid pulsed heating avoiding metal segregation and immiscibility in a multi-metal system. The HTS technique enables precise regulation of metal-support interfaces and defect distributions at the nanoscale, underpinning it as an irreplaceable approach for interface engineering. However, the HTS strategy is limited to single-phase construction with no systematic investigation into the correlation between crystal phase and catalytic activity. Additionally, the rapid atomic migration during HTS leads to a failure to directional exposure of high-active facets.
Applying the HTS strategy, we synthesized a high-density IrO2 catalyst supported on a TiO2 matrix (IrO2/TiO2-HTS) in only 60 s. This approach facilitates the formation of highly dispersed IrO2 nanoclusters with an average size of 1.95 nm, which are enriched with oxygen vacancies. The developed HTS strategy synergistically constructs a stable structure with ultrafine clusters, high defect density, and robust interfaces, all of which collectively contribute to the excellent catalytic performance. The as-prepared catalyst demonstrates outstanding oxygen evolution reaction (OER) activity and acid corrosion resistance. The versatility of the HTS method is further shown by its applicability to other systems, such as Ru-doped IrO2/TiO2. This work, therefore, provides a new and efficient route for the rational design and ultrafast synthesis of advanced supported catalysts for PEMWE.
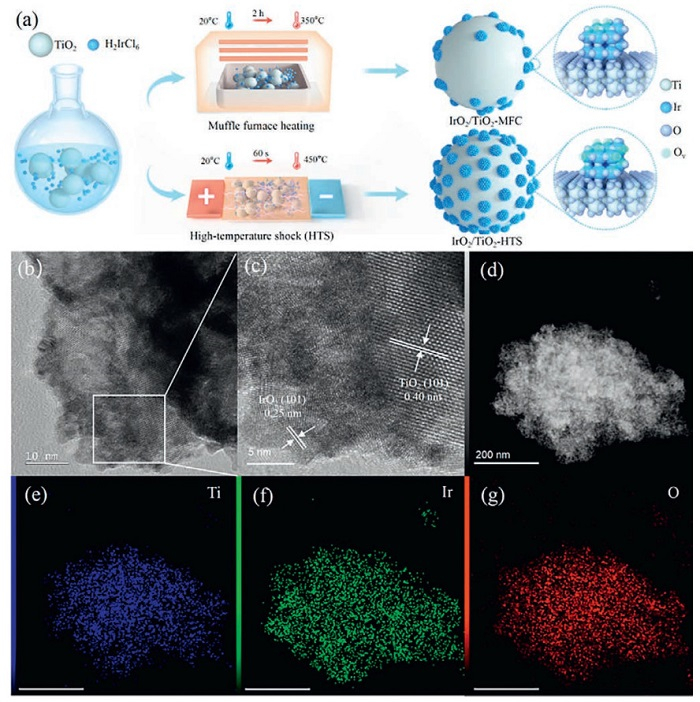
As schematically shown in Fig. 1a, we report a molten-salt-assisted approach for the fabrication of supported IrO2 catalysts (IrO2/TiO2-HTS) via Joule heating-triggered HTS technique in a NaNO3 oxidation environment. In contrast to the reported TiO2-supported IrO2 catalysts (e.g., W-TiO2@IrO2, IrO2@TiO2, and Ir/a.TiO2) [46–48] prepared previously by mechanical agitation and conventional calcination (tube furnace, muffle furnace, etc.). We first utilized HTS technique to synthesize IrO2/TiO2 catalyst for acidic water electrolysis, greatly reducing the preparation time (Table S1 in Supporting information). Detailed experimental procedures are provided in Supporting information. As illustrated in Fig. 1a, the synthesis initiates with electrostatic attraction of a negatively charged iridium precursor onto the positively charged surface of the TiO2 support, facilitating the bottom-up encapsulation of iridium precursor within TiO2 nanoislands (Fig. S1 in Supporting information). A key benefit of the HTS method lies in its rapid and uniform heating, which is visually confirmed by a uniform yellow light across the HTS substrate (Fig. S2 in Supporting information). In contrast, conventional muffle furnace heating depends on slower thermal conduction [49]. The Joule-heating strategy achieves a heating rate of 26 K/s for 450 ℃ and a subsequent quenching rate of 15 K/s, significantly reducing the synthesis time from 2 h to just 60 s (Figs. S3 and S4 in Supporting information).
Figure 1
Figure 1.
(a) Schematic diagram of TiO2 supported IrO2 nanocluster difference in the muffle furnace and HTS sample. (b, c) Transmission electron microscopy (TEM) image. (d-g) STEM images with corresponding elemental mapping images.
The ultrafast processing kinetically suppresses crystal growth and phase separation, which are common issues in prolonged high-temperature fabrication. The rapid duration time enables precise control of the catalyst’s microstructure, resulting in the formation of ultrasmall IrO2 particles, abundant oxygen vacancies, and strong interfacial coupling. The HTS approach allows for a higher metal oxide loading with homogeneous distribution compared to equilibrium-driven synthesis. Moreover, the versatility of the HTS strategy was confirmed by its successful application to other systems, including IrO2/TiO2 nanosheets and Ru-doped IrO2/TiO2 (Figs. S5-S8 in Supporting information). The supported binary oxides, which showed no signs of metal segregation, proved its broad applicability for designing advanced supported catalysts. Furthermore, the adaptability of this methodology demonstrates its broad applicability to other support (e.g., TiN, MnO2, Co3O4, and SnO2) and dopants (e.g., transition metal elements (TEMs) and rare earth elements (REEs)), co/multi-doping, and high-entropy oxides (HEOs) strategies for supported IrO2-based systems. Artificial intelligence (AI)-assisted synthesis can provide precise guidance for high-throughput catalyst design, thereby significantly enhancing catalyst fabrication efficiency.
Physicochemical analyses were performed to analyze the structure and morphology of the synthesized IrO2/TiO2-HTS catalyst. Transmission electron microscopy (TEM) images displayed that the anatase TiO2 support consists of spheroidal nanoparticles (25.7 nm) with a lattice spacing of 0.358 nm, corresponding to the (101) plane (Fig. S9 in Supporting information) [50]. Nitrogen adsorption-desorption analysis suggested a porous structure with a high specific surface area of 80.88 m2/g and an average pore size of 21.26 nm (Fig. S10 in Supporting information). Such porosity is beneficial for PEMWE as it facilitates mass transport and bubble detachment from the active sites [51]. Compared with commercial IrO2, the HTS-synthesized IrO2 nanoclusters preferentially expose the (101) crystal facet, whereas commercial IrO2 predominantly exposes the less active (110) facet with an average particle size of 12.8 nm (Figs. S11 and S12 in Supporting information). Previous studies have shown the (101) facet has a lower energy barrier for the oxygen evolution reaction, suggesting superior intrinsic activity [27].
Further TEM analysis confirmed the uniform dispersion of ultrafine IrO2 nanoclusters, with an average particle size of 1.95 nm, across the TiO2 support (Figs. 1b and c, Fig. S13 in Supporting information). High-resolution imaging clearly showed an intimate contact interface between the IrO2 ((101) and (200) facets) and the TiO2 (101) facet (Figs. 1b and c, Fig. S13) [11]. This well-defined interface is critical for promoting efficient electron transport and enhancing catalytic stability. Energy-dispersive X-ray spectroscopy (EDX) mapping confirmed the homogeneous distribution of elements, with mass ratios of 44.06% Ir, 20.75% Ti, and 35.19% O (Figs. 1d-g, Fig. S14 and Table S2 in Supporting information). The higher density of Ir relative to the muffle-furnace sample (36.55% Ir in Figs. S15 and S16 in Supporting information) highlights the superior dispersion capability and strong anchoring effect of the TiO2 support for IrO2. Additionally, inductively coupled plasma optical emission spectroscopy (ICP-OES) results showed elemental contents slightly higher than EDS results, with Ir and Ti mass fractions of 45.27% and 28.24%, respectively (Table S3 in Supporting information). The surface properties were evaluated using water contact angle measurements (Fig. S17 in Supporting information) [52]. Compared with the muffle-furnace route (CA = 16.6°), the HTS-derived catalysts displayed a smaller contact angle (CA = 9.1°), indicative of a super-hydrophilic surface. A super-hydrophilic surface facilitates intimate contact between the aqueous electrolyte and solid electrode, promoting bubble detachment and avoiding the active sites from being blocked.
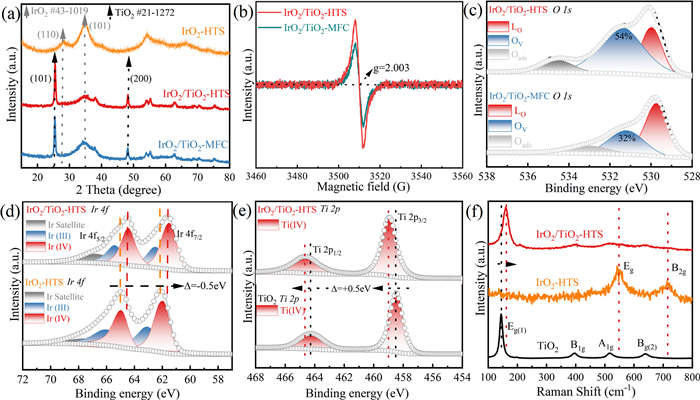
To gain deeper insights into the structural evolution of the catalysts, X-ray diffraction (XRD) patterns of anatase TiO2 matrix, commercial IrO2 (Com IrO2), IrO2 prepared by HTS (IrO2-HTS), IrO2/TiO2-MFC and IrO2/TiO2-HTS were employed to analyze the crystal structure. For the TiO2 matrix (Fig. S18 in Supporting information), it was found that all the diffraction peaks match well with characteristic peaks of anatase TiO2 (PDF #21-1272), where the diffraction peak in the 2θ range of 25.28° corresponds to the (101) facet of anatase TiO2. The IrO2-HTS sample show similar crystal structures with rutile IrO2 (PDF #43-1019). Two characteristic peaks at 28.0° and 34.7° were attributed to the (110) and (101) planes of IrO2. Additionally, compared with Com IrO2, the characteristic peaks of IrO2-HTS showed a progressive broadening indicating ultrasmall size (Figs. S12 and S19 in Supporting information). Furthermore, the XRD patterns of the IrO2/TiO2 composites (Fig. 2a) displayed two distinct characteristic peaks that correspond to the (101) and (200) facets of TiO2. A broadened diffraction peak in the 2θ range of 30°-40° was also observed, which corresponds to the (101) facet of IrO2 [53]. In fact, IrO2 signals in the IrO2/TiO2 composites are hard to distinguish clearly in Fig. 2a. The main reason for this phenomenon is that the small-sized IrO2 nanoclusters induce diffraction peak broadening, together with the preferential exposure of the highly active (101) facet. This finding is consistent with the XRD results mentioned earlier. These observations demonstrate the successful synthesis of IrO2/TiO2 composites featuring ultrasmall IrO2 nanoclusters.
Figure 2
Figure 2.
Structural characterization of IrO2/TiO2-HTS. (a) XRD patterns of IrO2/TiO2-HTS and IrO2/TiO2-MFC. (b) EPR spectra of IrO2/TiO2-HTS and IrO2/TiO2-MFC. (c) High-resolution XPS O 1s spectra of IrO2/TiO2-HTS and IrO2/TiO2-MFC. (d) High-resolution XPS Ti 2p spectra of IrO2/TiO2-HTS and pureTiO2. (e) High-resolution XPS Ir 4f spectra of IrO2/TiO2-HTS and IrO2-HTS. (f) Raman spectra of IrO2-HTS, pure TiO2 and IrO2/TiO2-HTS. TiO2 matrix exhibited four Raman peaks at 143, 396, 516 and 638 cm-1, assigned to the Eg(1), B1g, A1g and Eg(2) modes, respectively. These vibrations originate from symmetric stretching, symmetric bending, and asymmetric bending of the anatase TiO2. IrO2-HTS showed two characteristic peaks at 546 and 714 cm-1, corresponding to Eg and B2g stretching modes of Ir – O bonds.
The electronic structure and defect concentration of the catalysts were investigated to understand the origins of the enhanced catalytic performance. Electron paramagnetic resonance (EPR) spectroscopy exhibited a distinct signal at g = 2.003, which is characteristic of oxygen vacancy (Ov). The signal intensity was higher for the IrO2/TiO2-HTS catalyst than for its counterpart prepared by a conventional muffle furnace (IrO2/TiO2-MFC), suggesting that the HTS process introduces a higher concentration of oxygen vacancies (Fig. 2b and Fig. S20 in Supporting information). This finding was further supported by X-ray photoelectron spectroscopy (XPS), where XPS survey spectrum shows the presence of Ir, Ti, and O signals for IrO2/TiO2-HTS (Fig. S21 in Supporting information). High-resolution O 1s spectra showed that the relative area of the peak associated with oxygen vacancies (531.45 eV) was significantly larger for IrO2/TiO2-HTS (54%) than for IrO2/TiO2-MFC (32%) (Fig. 2c) [54]. The generation of these oxygen vacancies is critical, because they can accelerate charge transfer, improve electrical conductivity, and enhance oxygen evolution reaction (OER) activity [39]. Further XPS analysis provided direct evidence of strong electronic interactions between the catalyst and the support. The Ti 2p peaks for IrO2/TiO2-HTS shift positively of 0.5 eV relative to pure TiO2 matrix [55], while the Ir 4f peaks shifted negatively by 0.5 eV compared with unsupported IrO2-HTS (Figs. 2d and e) [39,56] The Ir 4f spectra showed the coexistence of Ir4+ and Ir3+ species in IrO2/TiO2-HTS, indicating an increase in the oxidation state of titanium and a corresponding reduction in the oxidation state of iridium, consistent with electron transfer from support to the catalyst (Ti → O → Ir). This charge redistribution is a signature of strong metal oxide-support interaction (SMOSI). This conclusion was further supported by Raman spectroscopy (Fig. 2f). In the composite catalyst, the primary Eg(1) vibrational mode of TiO2 displayed a blue shift. This shift provides additional evidence of the modified electronic environment at the IrO2/TiO2 interface, and is consistent with the charge transfer identified by XPS [57,58].
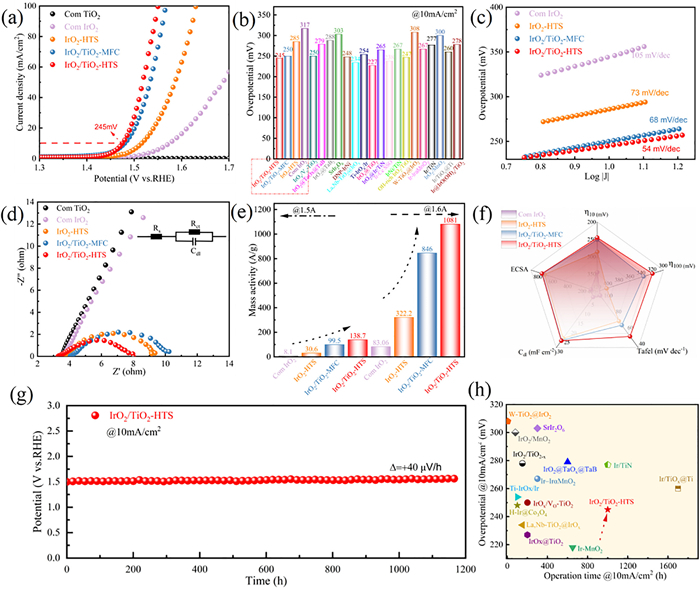
To evaluate the electrocatalytic performance for the acidic OER, the synthesized IrO2/TiO2-HTS catalyst was tested in a 0.5 mol/L H2SO4 electrolyte and compared against several control samples. The Hg/Hg2SO4 reference electrode was calibrated using the hydrogen evolution reaction (HER) method, yielding a potential of 0.652 V vs. RHE (Fig. S22 in Supporting Information). As shown in Fig. 3a, linear sweep voltammetry (LSV) curves revealed that IrO2/TiO2-HTS demonstrates the highest OER activity. It required an overpotential of only 245 mV to achieve a current density of 10 mA/cm2, outperforming IrO2/TiO2-MFC (250 mV), IrO2-HTS (285 mV) and commercial IrO2 (317 mV). This enhanced activity, which surpasses that of many recently reported Ir-based catalysts (e.g., SrIr2O6 [59]) and supported Ir-based catalysts (e.g., IrO2/TiO2-x, Ir-IrɑMnO2, and IrO2@TaOx@TaB [19,60,61]) (Fig. 3b and Table S4 in Supporting information), is attributed to the combination of ultrafine IrO2 nanoclusters, a high concentration of oxygen vacancies, and a stable catalyst-support interface. It is widely recognized that the turnover frequency (TOF) serves as a reliable indicator of intrinsic catalytic activity. As shown in Fig. S23 (Supporting information), the TOF values of all the catalysts gradually increase with increasing overpotential. Notably, IrO2/TiO2-HTS possesses the highest TOF values across the whole overpotential, indicating its superior intrinsic activity. The reaction kinetics were further assessed using Tafel analysis, where IrO2/TiO2-HTS exhibited a slope of 54 mV/dec, significantly lower than that the control sample (Fig. 3c), indicating more favorable reaction kinetics. This is consistent with its higher double-layer capacitance (Cdl) of 26.3 mF/cm2 and larger electrochemically active surface area (ECSA), which confirm a greater number of exposed active site (Fig. S24 in Supporting information). Furthermore, electrochemical impedance spectroscopy (EIS) showed that IrO2/TiO2-HTS possessed the lowest charge-transfer resistance (Rct = 2.5 Ω), confirming its excellent electronic conductivity (Fig. 3d). Consequently, the catalyst achieved a mass activity of 1081 A/gIr at 1.6 V vs. RHE, a value 13 times higher than that of commercial IrO2 (Fig. 3e). Radar plots comparing overpotential at 10 and 100 mA/cm2, ECSA, Cdl, and Tafel slopes, further highlight the superior OER kinetics of IrO2/TiO2-HTS (Fig. 3f).
Figure 3
Figure 3.
Comparison of acidic OER performance of catalysts in 0.5 mol/L H2SO4 electrolyte (Commercial IrO2, pure TiO2, IrO2-HTS, IrO2/TiO2-MFC and IrO2/TiO2-HTS). (a) LSV curves. (b) Overpotential comparison at 10 mA/cm2 with previously reported Ru-, Ir- and RuIr-based acidic OER catalysts. (c) Tafel plots. (d) Nyquist plots obtained at 1.5 V vs. RHE in the frequency range of 0.1-100 kHz, the inset shows the equivalent circuit model. (e) MA of Com IrO2, IrO2-HTS, IrO2/TiO2-MFC, IrO2/TiO2-HTS at 1.45 and 1.5 V vs. RHE. (f) Radar chart summarizing crucial parameters including Cdl, Tafel slope, ECSA and overpotential at 10 and 100 mA/cm2. (g) Chronopotentiometric stability tests of IrO2-HTS and IrO2/TiO2-HTS at 10 mA/cm2. (h) Comparison of activity (overpotential at 10 mA/cm2) and durability (operation time at 10 mA/cm2) with recently reported Ru-, Ir- and RuIr-based catalysts.
The durability of the catalysts, a critical parameter for practical applications, was evaluated through long-term chronopotentiometry tests. The IrO2/TiO2-HTS catalyst demonstrated exceptional stability, operating continuously for 1165 h at a constant current density of 10 mA/cm2 with a voltage decay of only 40 μV/h (Fig. 3g). In stark contrast, the IrO2-HTS and IrO2/TiO2-MFC catalysts failed after only 363 h and 70 h, respectively (Fig. S25 in Supporting information). Moreover, IrO2/TiO2-HTS catalyst could maintained stable operation for over 45 h (Fig. S26 in Supporting information). The structural integrity of the IrO2/TiO2-HTS catalyst was confirmed by minimal iridium leaching (4.4% after 100 h and 6.4% after 300 h), and post-mortem XPS analysis, which showed that the Ir oxidation states and oxygen vacancy concentration was preserved (Table S5 and Fig. S27 in supporting information). The strong interaction between IrO2 and the TiO2 support is credited for this enhanced durability. The overall performance profile of the HTS-synthesized catalyst in terms of both activity and stability is superior to many recently reported Ir-based systems (Fig. 3h and Table S6 in Supporting information). The TEM image and corresponding EDX analyses after OER (Fig. S28 in Supporting Information) verified that the IrO2 clusters remained uniformly distributed on the TiO2 surface, and negligible structural or compositional changes were detected, indicating its excellent durability and structural integrity during OER.
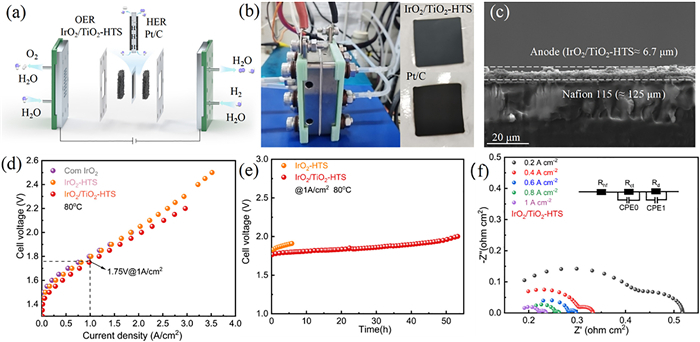
To assess its viability in a practical device, the IrO2/TiO2-HTS catalyst was integrated as the anode in a membrane electrode assembly (MEA) for a full-cell PEMWE test. The schematic configuration of the PEMWE device is shown in Fig. 4a, consisting of a proton exchange membrane N115, catalyst layer (CL), gas diffusion layer (GDL), and bipolar plate (BP). The MEA as the core component in PEMWE is composed of the proton exchange membrane, CL and GDL, and prepared via a catalyst-coated membrane (CCM) spraying technique for water electrolysis. As shown in Fig. 4b, both anode and cathode layer were uniformly coated, where anode employed IrO2/TiO2-HTS with Ir loading of 1 mgIr/cm2 and cathode employed commercial Pt/C with Pt loading of 0.35 mgPt/cm2. The cross-sectional scanning electron microscope (SEM) of MEA presented the anode catalyst layer thickness of 6.7 μm and corresponding elemental mapping confirmed the homogeneous distribution of Ir, Ti and O, indicating a compact and well-integrated catalysts layer (Fig. 4c and Fig. S29 in Supporting information). After optimizing the operating temperature and water flow rate (Figs. S30 and S31 in Supporting information), the performance of the MEA was evaluated. At 80 ℃, the MEA incorporating the IrO2/TiO2-HTS catalyst required a cell voltage of only 1.75 V to achieve a current density of 1 A/cm2, surpassing the performance of MEAs based on IrO2-HTS and commercial IrO2 (Fig. 4d). Furthermore, the device demonstrated stable operation for 50 h at this high current density (Fig. 4e). These results validate the practical potential of the ultrafast HTS synthesis method for producing highly active and durable electrocatalysts for industrial-scale green hydrogen production. The EIS are performed at different current densities and the impedance of MEA decreases as the current density increases (Fig. 4f).
Figure 4
Figure 4.
PEMWE performance. (a) Schematic diagram of PEMWE device. (b) Digital photograph of PEMWE setup, showing the anode and cathode catalysts layer coated via CCM technique. (c) Cross-sectional SEM image of the MEA. (d) PEMWE performance evaluation form polarization curves. (e) Chronopotentiometric test at 1 A/cm2 in the PEM electrolyzer. (f) EIS test under different current density.
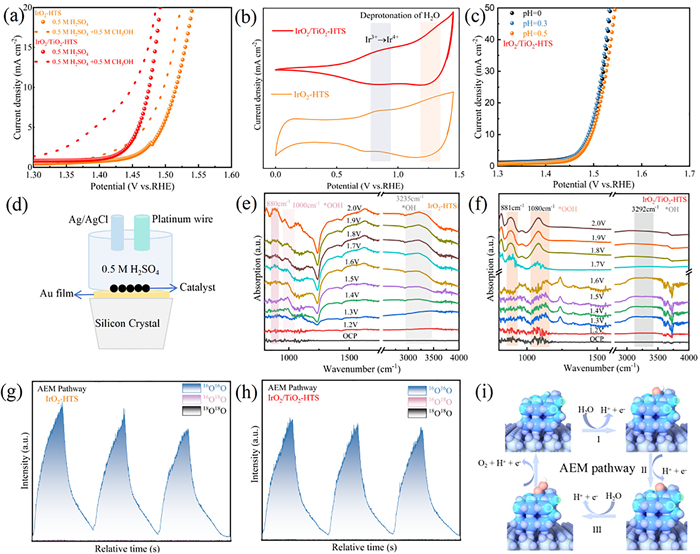
To determine the origin of the enhanced catalytic performance of IrO2/TiO2-HTS catalyst, a combination of electrochemical and in situ analytical techniques was employed. The adsorption behaviors of oxygen intermediates, which is a critical factor in OER activity, was first investigated. The methanol oxidation reaction (MOR) was used as a probe, as the electrophilic *OH intermediate, the first species formed during OER, readily reacts with nucleophilic methanol. A stronger *OH adsorption on the catalyst surface leads to a more pronounced MOR current [62–64]. When methanol was introduced, a significantly larger increase in current density was observed for IrO2/TiO2-HTS compared to IrO2-HTS confirming stronger *OH adsorption on the supported catalyst (Fig. 5a) [21,65,66]. Furthermore, cyclic voltammetry (CV) revealed two distinct pairs of redox peaks for both catalysts, corresponding to the formation of intermediates via water deprotonation (Fig. 5b) The catalytic activity of IrO2/TiO2-HTS was also found to be independent of pH, a characteristic feature of the adsorbate evolution mechanism (AEM) (Fig. 5c) [67].
Figure 5
Figure 5.
OER mechanism analysis of IrO2/TiO2-HTS. (a) LSV curve of IrO2/TiO2-HTS and IrO2-HTS catalysts in 0.5 mol/L H2SO4 electrolyte with/without 0.5 mol/L CH3OH. (b) Cyclic voltammetry (CV) curve of IrO2/TiO2-HTS and IrO2-HTS catalysts in 0.5 mol/L H2SO4 electrolyte at scan rate of 50 mV/s within 1-1.4 V vs. RHE. (c) pH dependence on the LSV curve for IrO2/TiO2-HTS in H2SO4 electrolyte. (d) In situ ATR-SEIRAS schematic diagram. (e) In situ ATR-SEIRAS analysis of the IrO2-HTS catalysts. (f) In situ ATR-SEIRAS analysis of the IrO2/TiO2-HTS catalysts. (g) DEMS analysis of the IrO2-HTS catalysts. (h) DEMS analysis of the IrO2/TiO2-HTS catalysts. (i) Schematic illustration of the OER mechanism for IrO2/TiO2-HTS.
To obtain direct experimental evidence of the reaction pathway, in-situ spectroscopic and mass spectrometry analyses were performed. In situ attenuated total reflection surface-enhanced infrared absorption spectroscopy (ATR-SEIRAS) (Fig. 5d and Fig. S32 in Supporting information) was used to monitor surface species under different potential. For both IrO2/TiO2-HTS and IrO2-HTS, vibrational bands corresponding to of *OH (3200 cm-1) and *OOH (880 and 1000 cm-1) intermediates were observed as the potential at was increased from 1.2 V to 2.0 V vs. RHE (Figs. 5e and f). The direct observation of these species provides strong support for the AEM pathway. To definitively rule out the participation of lattice oxygen, in situ differential electrochemical mass spectrometry (DEMS) was conducted using 18O isotope labeling (Fig. S33 in Supporting information). After pre-adsorbing 18O-containing species onto the catalyst surface, the OER was carried out in an H216O electrolyte. For both catalysts, the evolved oxygen consisted exclusively of 32O2 (16O – 16O), with no detectable 36O2 (18O – 18O) signal (Figs. 5g and h). Collectively, these results confirm that the OER on the IrO2/TiO2-HTS catalyst proceeds via the AEM pathway, where all oxygen atoms in the evolved O2 originate from water molecules rather than the catalyst lattice (Fig. 5i).
Overall, we developed a rapid, cost-effective, and scalable HTS technique for fabricating TiO2-supported IrO2 catalysts with abundant oxygen vacancies. The versatility was confirmed by successful extension to binary system, such as Ru-doped IrO2/TiO2. The as-prepared IrO2/TiO2-HTS catalyst exhibits outstanding electrocatalytic performance, achieving a mass activity of 1081 A/gIr at 1.6 V vs. RHE in 0.5 mol/L H2SO4. Furthermore, the catalyst has the lowest Tafel slope and minimal charge-transfer resistance, confirming rapid electron transfer and superior electrocatalytic kinetics. Chronopotentiometric tests at 10 mA/cm2 showed that IrO2/TiO2-HTS remained stable for 1165 h with a voltage decay of 40 μV/h. The post-reaction characterizations confirmed minimal noble metal leaching, indicating better stability than reference catalysts. This study establishes an effective route for ultrafast synthesis of high-performance supported catalysts and advanced their potential for practical application in proton exchange membrane water electrolysis.
Declaration of competing interest
The authors declare that they have no known competing financial interests or personal relationships that could have appeared to influence the work reported in this paper.
This work was supported by the National Natural Science Foundation of China (Nos. 22479011 and 12205165), High-performance Computing Platform of China University of Geosciences Beijing, and 2025 Graduate Innovation Found Project of China University of Geosciences, Beijing.
Supplementary materials
Supplementary material associated with this article can be found, in the online version, at doi:10.1016/j.cclet.2026.112375.
[1]
Y. Du, J. Liu, J. Chen, et al., Adv. Energy Mater. 15 (2025) 2404113. doi: 10.1002/aenm.202404113
H. Zhang, F. Yi, M. Xu, et al., Int. J. Hydrogen Energy 168 (2025) 151059.
[61]
X. Teng, K. Zhang, Z. Yang, et al., Electrochim. Acta 549 (2026) 148065.
[62]
C. Wang, X. Wu, H. Sun, et al., Energy Environ. Sci. 18 (2025) 4276–4287. doi: 10.1039/d5ee00281h
[63]
J. Dai, Z. Shen, Y. Chen, et al., J. Am. Chem. Soc. 146 (2024) 33663–33674. doi: 10.1021/jacs.4c11477
[64]
X. Chen, H. Ma, X. Wang, et al., J. Am. Chem. Soc. 147 (2025) 20600–20611. doi: 10.1021/jacs.5c03577
[65]
Y. Qin, X. Niu, R. Zhao, et al., ACS Catal. 14 (2024) 12970–12981.
[66]
L. Xu, L. Lu, N. Xu, et al., Angew. Chem. Int. Ed. 64 (2025) e202510965.
[67]
L. Wang, S.F. Hung, S. Zhao, et al., Nat. Commun. 16 (2025) 3502. doi: 10.3390/app15073502
Figure 1
(a) Schematic diagram of TiO2 supported IrO2 nanocluster difference in the muffle furnace and HTS sample. (b, c) Transmission electron microscopy (TEM) image. (d-g) STEM images with corresponding elemental mapping images.
Figure 2
Structural characterization of IrO2/TiO2-HTS. (a) XRD patterns of IrO2/TiO2-HTS and IrO2/TiO2-MFC. (b) EPR spectra of IrO2/TiO2-HTS and IrO2/TiO2-MFC. (c) High-resolution XPS O 1s spectra of IrO2/TiO2-HTS and IrO2/TiO2-MFC. (d) High-resolution XPS Ti 2p spectra of IrO2/TiO2-HTS and pureTiO2. (e) High-resolution XPS Ir 4f spectra of IrO2/TiO2-HTS and IrO2-HTS. (f) Raman spectra of IrO2-HTS, pure TiO2 and IrO2/TiO2-HTS. TiO2 matrix exhibited four Raman peaks at 143, 396, 516 and 638 cm-1, assigned to the Eg(1), B1g, A1g and Eg(2) modes, respectively. These vibrations originate from symmetric stretching, symmetric bending, and asymmetric bending of the anatase TiO2. IrO2-HTS showed two characteristic peaks at 546 and 714 cm-1, corresponding to Eg and B2g stretching modes of Ir – O bonds.
Figure 3
Comparison of acidic OER performance of catalysts in 0.5 mol/L H2SO4 electrolyte (Commercial IrO2, pure TiO2, IrO2-HTS, IrO2/TiO2-MFC and IrO2/TiO2-HTS). (a) LSV curves. (b) Overpotential comparison at 10 mA/cm2 with previously reported Ru-, Ir- and RuIr-based acidic OER catalysts. (c) Tafel plots. (d) Nyquist plots obtained at 1.5 V vs. RHE in the frequency range of 0.1-100 kHz, the inset shows the equivalent circuit model. (e) MA of Com IrO2, IrO2-HTS, IrO2/TiO2-MFC, IrO2/TiO2-HTS at 1.45 and 1.5 V vs. RHE. (f) Radar chart summarizing crucial parameters including Cdl, Tafel slope, ECSA and overpotential at 10 and 100 mA/cm2. (g) Chronopotentiometric stability tests of IrO2-HTS and IrO2/TiO2-HTS at 10 mA/cm2. (h) Comparison of activity (overpotential at 10 mA/cm2) and durability (operation time at 10 mA/cm2) with recently reported Ru-, Ir- and RuIr-based catalysts.
Figure 4
PEMWE performance. (a) Schematic diagram of PEMWE device. (b) Digital photograph of PEMWE setup, showing the anode and cathode catalysts layer coated via CCM technique. (c) Cross-sectional SEM image of the MEA. (d) PEMWE performance evaluation form polarization curves. (e) Chronopotentiometric test at 1 A/cm2 in the PEM electrolyzer. (f) EIS test under different current density.
Figure 5
OER mechanism analysis of IrO2/TiO2-HTS. (a) LSV curve of IrO2/TiO2-HTS and IrO2-HTS catalysts in 0.5 mol/L H2SO4 electrolyte with/without 0.5 mol/L CH3OH. (b) Cyclic voltammetry (CV) curve of IrO2/TiO2-HTS and IrO2-HTS catalysts in 0.5 mol/L H2SO4 electrolyte at scan rate of 50 mV/s within 1-1.4 V vs. RHE. (c) pH dependence on the LSV curve for IrO2/TiO2-HTS in H2SO4 electrolyte. (d) In situ ATR-SEIRAS schematic diagram. (e) In situ ATR-SEIRAS analysis of the IrO2-HTS catalysts. (f) In situ ATR-SEIRAS analysis of the IrO2/TiO2-HTS catalysts. (g) DEMS analysis of the IrO2-HTS catalysts. (h) DEMS analysis of the IrO2/TiO2-HTS catalysts. (i) Schematic illustration of the OER mechanism for IrO2/TiO2-HTS.

 DownLoad:

 下载:
下载:


 下载:
下载:
