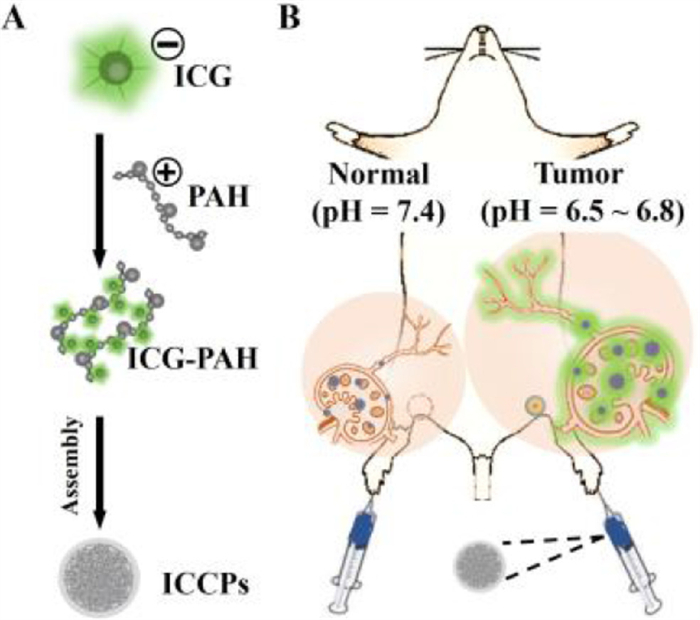
Scheme 1.
Schematic diagram of ICCPs. (A) Construction of ICCPs. (B) Precise imaging of tumor metastases in LNs.

Rapid and precise intraoperative identification of metastatic lymph nodes using a pH‑activated nanoprobe
Qian Jia , Haohao Yan , Yuanyuan Jia , Shuying Liu , Yanbin Feng , Bingqian Chen , Changhong Shi , Xiaojie Xu , Ruili Zhang , Zhongliang Wang


Lymph node (LN) metastasis is the most critical prognostic factor in oncology, directly impacting patient survival rates [1,2]. In breast cancer, for instance, regional metastasis to axillary LNs diminishes the five-year survival rate by approximately 28%–40%. The status of sentinel LNs (SLNs), which are the first LNs to receive drainage from a primary tumor, is key to predicting metastasis and guiding postoperative therapy [3,4]. Clinically, sentinel LN biopsy and intraoperative LN tracing are the gold standard for assessing lymphatic metastasis. However, these methods possess significant limitations. Sentinel LN biopsy is an invasive and time-consuming procedure, requiring at least 40 min wait for the results. Meanwhile, LN tracing techniques often employ radioactive isotopes like Tc99m, which invariably raise concerns about radiation exposure among cancer patients, despite their relatively low radiation dose [5-7]. Intraoperative guidance is a common strategy to locally administer a blue dye, such as Evans blue. However, the emission wavelengths of these dyes fall within the visible range of the human eye, which may stain the surgery area into blue and affect surgical operations. These small molecular blue dyes are also likely to migrate rapidly from SLNs toward the secondary echelon LNs, thus cause false-positive signals [8,9]. Intraoperative fluorescence imaging has emerged as a promising alternative for lymphatic imaging. The near-infrared (NIR) dye indocyanine green (ICG), as a Food and Drug Administration (FDA) approved agent, has been widely adopted for both preclinical and clinical SLNs imaging. Nevertheless, as a small-molecule dye, ICG suffers from two fundamental drawbacks. First, its low molecular weight leads to rapid leakage from lymphatic vessels and nodes, and long-term imaging. Second, ICG lacks tumor specificity. ICG cannot effectively differentiate between normal and metastatic LNs, which severely constrains its utility in precision diagnostics [10-12]. Therefore, there is a significant need to develop an ideal lymphatic imaging probe capable of identifying metastatic LNs and providing real-time, high-precision guidance for surgeons.
Although lymphatic-specific biomarkers for metastasis remain scarce, the distinct metabolic profile of tumor cells offers a novel strategic avenue. Compared with normal LNs, metastatic LNs exhibit increased fatty acid consumption, leading to elevated carbon dioxide metabolism. Concurrently, the oxygen consumption rate of metastatic cancer cells rises, further promoting tissue acidification and a low-pH microenvironment [13-16]. Therefore, extracellular low pH can also serve as a potential biomarker for detecting metastatic LNs [17-21]. The tumor-activatable probe that fluorescently labels tumor while minimizing background signals from surrounding healthy tissues is needed to overcome the limitations of fluorescence imaging of tumor using free NIR dyes for accurate and effective tumor resection [22-27]. However, employing a pH-sensitive imaging probe for tracking metastatic LNs in vivo is less explored.
In this study, we introduce a reinventing strategy to re-engineer the conventional NIR dye ICG, enabling it to be specifically "switched on" within tumor lesions for specific and sensitive identification of metastatic LNs in vivo. We have integrated the nonspecific accumulation properties of ICG with a pH-ultrasensitive calcium phosphate (CaP) nanocarrier to fabricate a tumor acidity-activatable NIR fluorescent probe named ICCPs (Scheme 1). By design, ICG molecules are densely packed within the ICCPs nanostructure, leading to a profound suppression of their fluorescence via an aggregation-caused quenching (ACQ) effect (the "OFF" state). This ensures that the ICCPs probe silent in the blood and normal tissues. However, upon accumulation in the acidic tumor microenvironment via passive targeting [28,29], the CaP rapidly disassembles in response to the low pH, triggering the release of ICG molecules. The liberated ICG subsequently recovers its intense fluorescence signal (the "ON" state), thereby precisely labeling the tumor site. Through a comprehensive series of in vitro and in vivo experiments, we systematically validated the pH-responsive capability of the ICCPs probe and its imaging efficacy in the metastatic LNs model. Compared to clinically utilized agents, free ICG and Evans blue, the ICCPs probe demonstrated superior specificity, achieving a precise differentiation between normal and metastatic LNs. Our probe can not only identify primary tumors with high specificity but also accurately visualize metastatic foci. We therefore propose ICCPs as a highly promising clinical translation tool for the precision imaging of lymphatic metastasis and enhancing intraoperative surgical navigation.
The synthesis and characterization of the ICCPs probe were foundational to this study. The fabrication process employed a two-step approach. First, monodisperse CaP nanoparticles were synthesized through mineralization of calcium hydroxide and sodium phosphate dibasic in the presence of template molecules within water-in-oil microemulsions. Subsequently, ICG was loaded into the preformed CaP nanoparticles via electrostatic adsorption. Following successful synthesis, the core functionality of the probes, their pH-activated fluorescence, was investigated. The optical properties of the ICCPs were analyzed in buffers (pH 7.4) and acidic tumor microenvironment (pH 6.7) conditions (Figs. 1A and B). At pH 7.4, the ultraviolet-visible (UV–vis) absorption spectrum of the ICCPs solution displayed a broad absorption band from 600 nm to 900 nm, characteristic of aggregated ICG molecules. Correspondingly, the fluorescence emission at 810 nm was significantly quenched (the "OFF" state). Upon acidification to pH 6.7, a dramatic change was observed. The broad absorption band resolved into a sharp, intense peak at 790 nm, indicative of monomeric ICG. This was accompanied by a nearly 100-fold increase in fluorescence intensity at 810 nm (the "ON" state), along with an expected red-shift of the emission maximum.
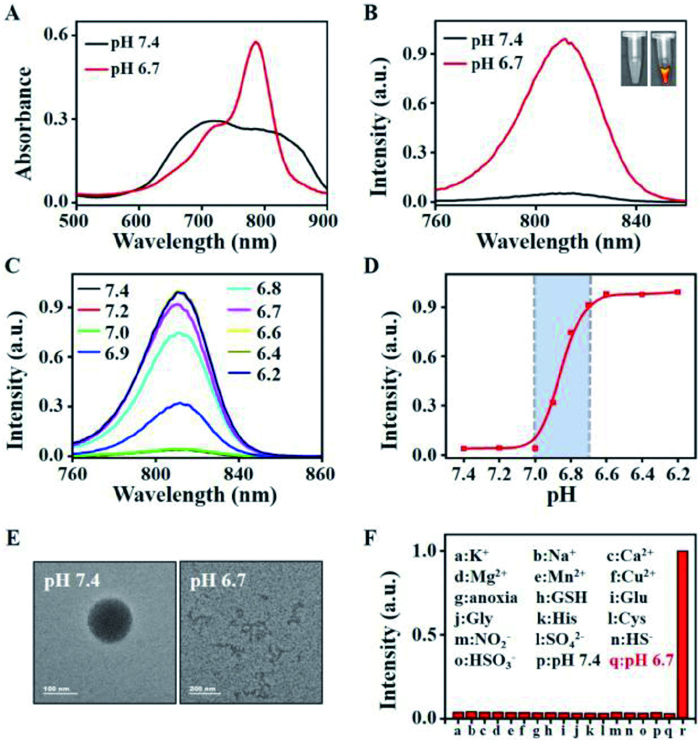
To further define the activation profile, the fluorescence response of the ICCPs was evaluated across a range of pH values. As shown in Fig. 1C, the fluorescence intensity exhibited a sharp, sigmoidal increase as the pH dropped. Critically, the activation occurs within a very narrow pH window of 6.7–7.0, which perfectly matches the acidity of the tumor extracellular milieu, while remaining inactive at the slightly alkaline pH of normal tissues (Fig. 1D). This ultrasensitive response over a 0.3 pH unit span highlights the probe's potential for precise differentiation between tumor and adjacent healthy tissue. This pH-triggered activation is driven by the structural disassembly of the probe. As confirmed by transmission electron microscopy (TEM) and dynamic light scattering (DLS) (Fig. 1E, Figs. S1A and B in Supporting information), while the ICCPs maintained their 100 nm spherical structure at pH 7.4, they rapidly dissolved into small, irregular fragments in the acidic buffer. This confirms that the acidic environment destabilizes the CaP matrix, releasing the aggregated ICG molecules and thus "switching on" their fluorescence.
Furthermore, the probe's selectivity was assessed. The fluorescence of ICCPs was tested against various biologically relevant analytes. Only the acidic condition (pH 6.7) induced an abrupt fluorescence turn-on, while other analytes caused no significant change (Fig. 1F). This demonstrates the probe's high selectivity and its potential to function reliably in a complex biological environment. Finally, the stability of the ICCPs was evaluated. The hydrodynamic size of the probes remained nearly unchanged over 72 h when incubated in water, fetal bovine serum (FBS), 1640 medium, and medium supplemented with 10% FBS (Fig. S1C in Supporting information). This excellent stability is crucial for ensuring the probe's integrity during systemic circulation in vivo before reaching the tumor site. We further evaluated the photostability of ICCPs probe under continuous laser irradiation. As shown in Fig. S1D (Supporting information), the fluorescence intensity of ICCPs at pH 7.4 remained stable after 1 h of continuous irradiation, whereas free ICG and ICCPs at pH 6.7 (disassembled ICCPs) showed a rapid fluorescence decrease. This result indicates that the CaP encapsulation effectively improves the photostability of ICG. Collectively, these results confirm that the ICCPs is a stable, and highly selective nanoprobe with an ultrasensitive pH-activation mechanism tailored for the specific detection of the acidic tumor microenvironment.
To confirm the activation mechanism of ICCPs is directly linked to the aberrant acid metabolism of cancer cells, a series of cell-based experiments were conducted. First, 4T1 breast cancer cells were treated with either oxamate, a lactate dehydrogenase inhibitor that suppresses acid production, or ryanodine, an activator of the electron transport chain that promotes glycolysis and thus increases lactate levels before being incubated with ICCPs probe. As shown by fluorescence microscopy (Fig. 2A), the cells treated with inhibitor oxamate exhibited almost no NIR fluorescence. In the contrast, the cells treated with activator ryanodine displayed a strong NIR fluorescence signal, which was comparable to that observed when 4T1 cells were directly incubated in an acidic buffer (pH 6.7), as shown in Fig. S2 (Supporting information). These results provide direct evidence that the ICCPs probe is an acid metabolism responsive system at the cellular level.
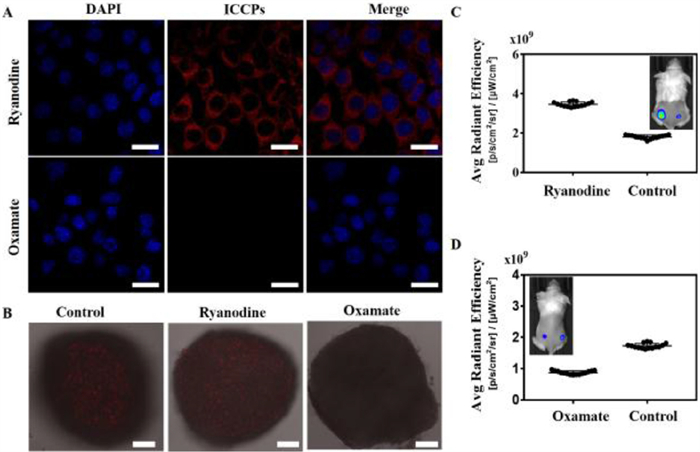
To further validate this in a more physiologically relevant model, the probe's performance was evaluated in 3D tumor spheroids of 4T1 cells. The fluorescence imaging of the cell spheres through which incubating ICCPs with 3D cell spheres of 4T1 cells were observed with the confocal microscope. As shown in Fig. 2B, a significant NIR fluorescence signal near the core of the spheroid, with only very weak signals at the periphery. This spatial distribution of fluorescence correlates perfectly with the known metabolic gradient in 3D spheroids, where the hypoxic core accumulates higher levels of acidic byproducts. This observation was further confirmed by treating the spheroids with the same metabolic modulators. Treatment with the activator ryanodine caused the fluorescent region to expand from the core towards the periphery, with an overall increase in signal intensity. Conversely, treatment with the inhibitor oxamate significantly weakened the fluorescence signal in the core and nearly abolished it in the periphery. These cellular-level experiments demonstrated that the activation mechanism of ICCPs probe was based on sensing the acidic microenvironment generated by the abnormal metabolism of tumor cells. The imaging mechanism of the ICCPs probe was investigated by modulating the acid production of 4T1 cells prior to in vivo imaging. As shown in Figs. 2C and D, the probe's fluorescence intensity directly correlated with the acidity of the tumor microenvironment. Treatment with ryanodine resulted in a 2-fold enhancement of the fluorescence signal compared to the control. In contrast, treatment with oxamate led to a signal reduction of approximately 50%. These opposing results provide strong evidence that the ICCPs probe functions by responding to the acidic tumor microenvironment, confirming its design validity and its potential for detecting acidic tumors.
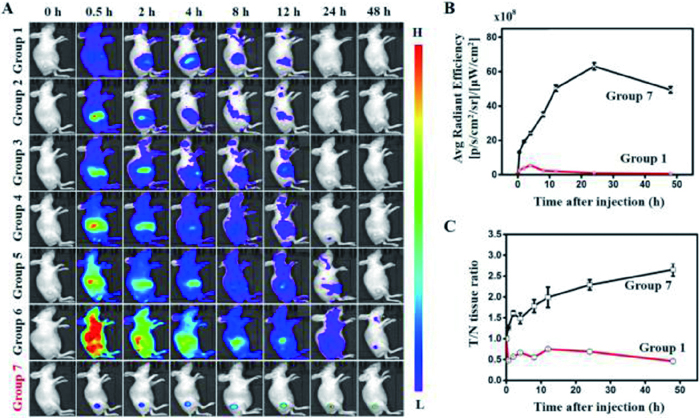
Encouraged by the good pH-responsiveness of ICCPs in vitro and at the cellular level, the in vivo tumor imaging capability of the ICCPs probe was evaluated in comparison against the clinically used "always-on" free ICG. Animal procedures for this study were reviewed and approved by the Institutional Animal Care and Use Committee of the Fourth Military Medical University (approval No. 20230462). Before that, we comprehensively examined the biosafety of ICCPs via multiple key measurements, including cytotoxicity (Fig. S3 in Supporting information), multiple physiological indicators in the blood biochemistry, hematology (Fig. S4 in Supporting information), and histologic examination (Fig. S5 in Supporting information). These results demonstrated that the introduction of ICCPs did not cause severe damage to the treated mice, implying the good biosafety of ICCPs in vivo. 4T1 subcutaneous xenograft tumor-bearing mice were intravenously administered either ICCPs or free ICG at various concentrations, and NIR fluorescence was monitored for 48 h. As shown in Fig. 3A, the two probes exhibited strikingly different imaging outcomes. The ICCPs group demonstrated exceptional performance, with a strong and specific fluorescence signal appearing at the tumor site as early as 0.5 h post-injection. Crucially, background fluorescence in non-target tissues was minimal, providing a high-contrast image from the outset. The tumor signal continued to intensify, peaking at 24 h, which confirms efficient tumor accumulation and subsequent pH-triggered activation of the ICCPs probe. In contrast, all free ICG groups were hampered by a poor signal-to-noise ratio. At lower concentrations (8–80 µg/mL), the dye was rapidly cleared from circulation, and the tumor signal became undetectable by 24 h. At higher concentrations (200–1000 µg/mL), the mice exhibited intense but systemic fluorescence, particularly in the liver and skin, which completely obscured the tumor. A clear tumor outline could only be resolved after a prolonged period (8–48 h) once systemic clearance had sufficiently reduced the high background. Quantitative analysis underscored the superiority of the pH-activated strategy. Despite being administered at the same ICG molar equivalent (8 µg/mL), the ICPP group produced a significantly higher fluorescence intensity at the tumor site compared to the free ICG group (Fig. 3B). More importantly, this specific activation translated into a significantly enhanced tumor-to-normal tissue (T/N) contrast ratio for the ICCPs probe, as detailed in Fig. 3C, cementing their superiority for high-fidelity tumor imaging. Such prominent tumor recognition capability of ICCPs was also supported by ex vivo imaging of the tumors and major organs collected from mice that were sacrificed post injection. As shown in Fig. S6A (Supporting information), free ICG was rapidly cleared from the body, exhibiting no detectable fluorescence signals in either tumors or organs. In contrast, ICCPs maintained a strong fluorescence signal in tumor tissues even after 48 h. Quantitative analysis of the ex vivo organs further solidified these biodistribution differences (Figs. S6B–H in Supporting information). All these results demonstrated that the pH-responsive activated ICCPs probe effectively suppresses background signal, overcoming the primary limitation of conventional "always-on" ICG probe and enabling rapid, high specificity, and high sensitivity in vivo tumor imaging.
The influence of the ICG payload on in vivo imaging performance was also investigated. 4T1 tumor-bearing mice were injected with ICCPs probe loaded with varying molar amount of ICG. The results (Fig. S7 in Supporting information) showed that all detectable ICCPs formulations were successfully activated at the tumor site, and a higher ICG loading amount resulted in both a stronger fluorescence signal and an earlier detection time. This indicates that while the inherent pH-responsive mechanism is independent of the payload, a higher ICG loading is critical for achieving optimal signal intensity and rapid imaging. Finally, to assess the universality of the ICCPs probe, its imaging capability was tested in mice bearing subcutaneous tumors derived from a wide array of cancer cell lines (PC-3, Panc-1, A549, U87, MCF-7, and SGC-7901). As shown in Fig. S8 (Supporting information), the ICCPs probe successfully illuminated all tumor types, demonstrating their broad applicability. Furthermore, the probe was effective in visualizing tumors of various sizes, ranging from small nodules (8 mm3) to large masses (388 mm3) (Fig. S9 in Supporting information). These comprehensive data establish that ICCPs probe is a versatile and robust platform for detection of diverse tumor types and sizes, holding significant promise for broad clinical application.
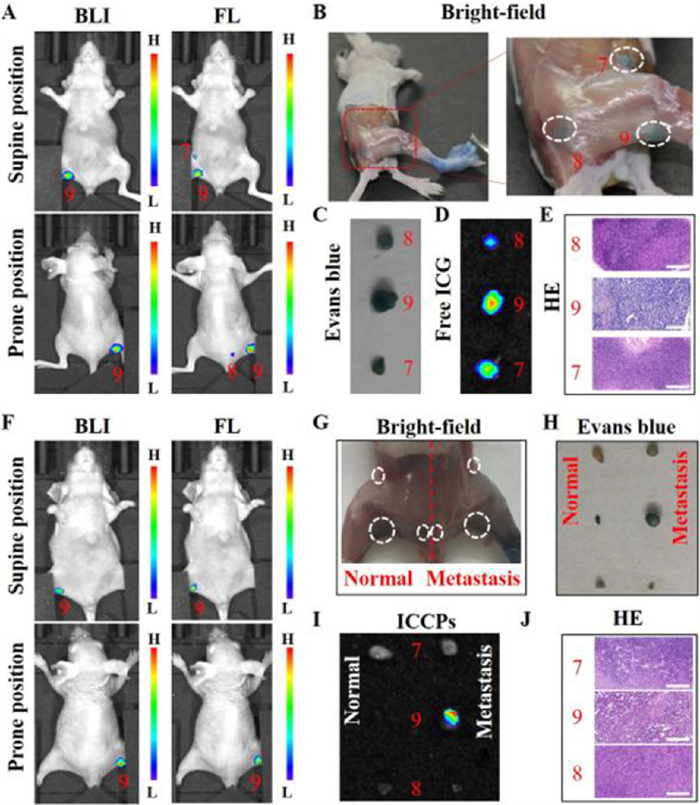
A critical challenge in oncology is distinguishing metastatic LNs from healthy ones, a task for which current clinical imaging agents are inadequate. To evaluate the potential of ICCPs probe to address this challenge, its performance was tested in a 4T1 breast cancer LN metastasis model (Fig. S10 in Supporting information). First, the precise location of the metastatic lesion was established using whole-body bioluminescence imaging, which specifically detects the luciferase-expressing cancer cells. As shown in Figs. 4A and F, the metastasis was unequivocally identified in the left popliteal LN (site 9). Subsequently, diagnostic capabilities of free ICG and ICCPs were assessed by injecting the two probes into the left footpad of the mice for NIR in vivo imaging. As expected for a simple drainage marker, free ICG rapidly migrated through the lymphatic system, illuminating not only the metastatic popliteal LN (site 9) but also the upstream, non-metastatic sciatic (site 8) and inguinal (site 7) LNs, indicating the inability of "always-on" dyes to differentiate between healthy and cancerous nodes. In contrast, when ICCPs probe was injected into the same footpad, a profoundly different result was observed. A strong NIR fluorescence signal was detected exclusively at the popliteal LN (site 9)-the known site of metastasis. No signal was observed in the healthy upstream LNs (site 7 and site 8), despite the probe necessarily passing through them. This indicates that the ICCPs probe remained in their quenched "OFF" state in the normal physiological environment of the healthy nodes but were specifically activated "ON" by the acidic microenvironment within the metastatic LN. The accuracy of this in vivo imaging was confirmed by ex vivo analysis of the LNs, which showed a perfect correlation between the in vivo fluorescence patterns and the dissected tissues (Figs. 4D and I). Furthermore, Evans blue was injected into the metastatic LN-side footpad of the free ICG group (Fig. 4B) and both footpads of the ICCPs group (Fig. 4G). Evans blue demonstrated similar characteristics to free ICG, failing to distinguish between normal and metastatic LNs. As illustrated in Figs. 4C and H, both the metastatic popliteal LN and the normal inguinal and sciatic LNs were stained blue by Evans blue. Hematoxylin-eosin (HE) staining results further confirmed that the site 9 contained a clear tumor lesion, while site 7 and site 8 were normal lymphatic tissues (Figs. 4E and J).
To confirm that this high specificity was not model-dependent, the probe's performance was validated in additional contexts. First, ICCPs probe were injected into both the cancerous and healthy contralateral footpads of the same mouse. As shown in Fig. S11 (Supporting information), a strong NIR signal appeared only in the metastatic popliteal LN, while the healthy node on the contralateral side remained non-fluorescent, reinforcing the probe's specificity. The perfect co-localization of the bioluminescence and ICCPs fluorescence signals further confirmed that the probe was activated precisely at the site of metastasis (Fig. S12 in Supporting information). The probe's utility was also confirmed in a more clinically relevant axillary LN metastasis model. Once again, ICCPs probe generated a strong fluorescence signal exclusively at the bioluminescence-positive metastatic axillary LN (site 6), while the adjacent healthy LNs exhibited no detectable fluorescence signals (Fig. S13 in Supporting information). In contrast, Evans Blue stained all nodes in the region indiscriminately (Fig. S14 in Supporting information), further underscoring the unique diagnostic capability of the pH-activatable ICCPs probe. Recognizing the clinical advantages of deeper tissue penetration, the probe's performance was evaluated in the NIR-Ⅱ window (1000–1700 nm). Despite ICG's emission peak being in the NIR-Ⅰ region, its broad spectrum provides sufficient signal for NIR-Ⅱ imaging. Following footpad injection, a high-contrast NIR-Ⅱ signal was clearly resolved from the metastatic popliteal LN, demonstrating the feasibility of using ICCPs for high-resolution, deep-tissue surgical guidance (Fig. S15 in Supporting information). To further assess the ability of ICCPs in detecting early-stage LN metastasis, 4T1-luc cells were injected into the footpads of BALB/c mice, followed by NIR-Ⅱ fluorescence imaging at 3, 6, 10, 14 and 21 days post-injection. As shown in Fig. S16A (Supporting information), fluorescence signals were first detected in site 9 at day 6, indicating the presence of early micrometastatic lesions. By day 10, fluorescence was detected in site 8, and by day 21, strong signals were observed in site 7, demonstrating the capability of the probe to monitor the progression of LN metastasis. Additionally, HE staining results (Fig. S16B in Supporting information) were consistent with the fluorescence imaging findings, further validating the accuracy of ICCPs for detecting metastatic LNs. Furthermore, the probe's activation also generated a robust photoacoustic (PA) signal at the metastatic LNs, confirming its potential for multi-modal imaging applications. Collectively, these comprehensive results demonstrate that ICCPs probe is a robust and highly specific tool for identifying metastatic LNs. Their pH-dependent activation mechanism overcomes the fundamental limitations of conventional tracers, enabling accurate, high-contrast detection across various site metastatic LN and advanced imaging modalities like NIR-Ⅱ and PA.
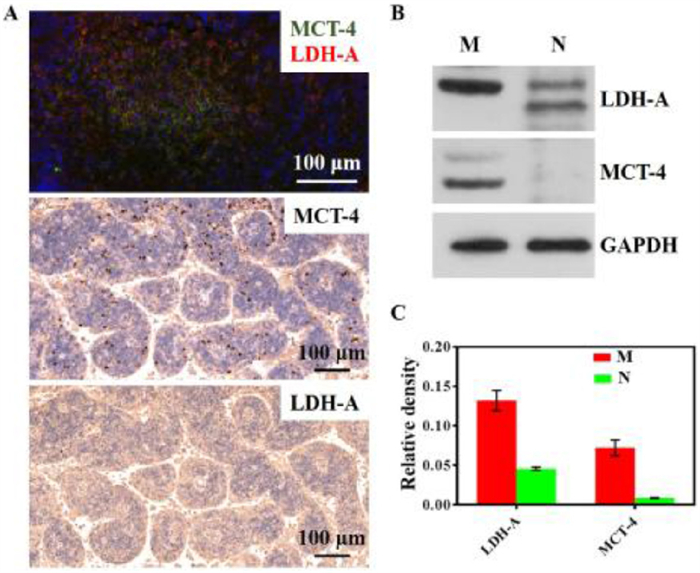
Finally, to anchor our imaging results in fundamental tumor biology, we investigated the molecular underpinnings of the acidic microenvironment within the metastatic lesions [30]. We analyzed the expression of two key proteins, lactate dehydrogenase A (LDH-A) and monocarboxylate transporter 4 (MCT-4), whose upregulation is a hallmark of the Warburg effect and is driven by hypoxia-inducible factor 1-alpha (HIF-1α) in acidic, hypoxic tumor regions. As confirmed by immunofluorescence, immunohistochemistry, and Western blot (WB), the metastatic LNs exhibited a dramatic overexpression of both LDH-A and MCT-4 compared to normal lymphatic tissue (Figs. 5A and B). Quantitative analysis of WB revealed that metastatic LNs contained 3.5-fold and 8-fold more LDH-A and MCT-4, respectively, than the normal LNs (Fig. 5C), indicative of the acidity of the lung tumor. By directly linking the probe's "turn-on" mechanism to this fundamental metabolic reprogramming, we not only validate its specificity but also establish its potential as a highly promising and rationally designed imaging agent for the precise detection of lymphatic metastasis.
In summary, we report the successful development of a tumor acidity-activatable NIR fluorescent nanoprobe, ICCPs, for the precise detection of LN metastasis-a persistent challenge in clinical oncology. Through systematic optimization of the probe’s composition and assembly, we engineered ICCPs to exhibit a sharp, pH-dependent conversion from a quenched to a highly fluorescent state. This design allows the probe to specifically respond to the acidic microenvironment of metastatic lesions while remaining "silent" elsewhere. Our findings confirm that ICCPs are activated only within cancerous tissues, dramatically reducing the non-specific background signal that plagues conventional dyes like ICG. As a result, ICCPs enabled reliable, high‑contrast imaging of primary tumors and, critically, metastatic foci within LNs. This work provides a highly promising "reinventing strategy" that expands the utility of ICG, offering a clear path toward more accurate cancer diagnosis and effective image-guided surgical intervention.
Qian Jia: Writing – original draft, Methodology, Investigation, Funding acquisition, Data curation, Conceptualization. Haohao Yan: Formal analysis, Data curation. Yuanyuan Jia: Validation, Software, Methodology, Formal analysis, Data curation. Shuying Liu: Formal analysis. Yanbin Feng: Visualization, Software, Formal analysis. Bingqian Chen: Visualization, Software, Methodology, Formal analysis. Changhong Shi: Methodology, Formal analysis, Conceptualization. Xiaojie Xu: Writing – review & editing, Writing – original draft, Supervision, Methodology, Investigation, Funding acquisition, Conceptualization. Ruili Zhang: Writing – review & editing, Supervision, Methodology, Formal analysis. Zhongliang Wang: Writing – review & editing, Supervision, Methodology, Investigation, Funding acquisition, Conceptualization.
The authors declare that they have no known competing financial interests or personal relationships that could have appeared to influence the work reported in this paper.
This work was funded by the National Natural Science Foundation of China (Nos. 22404131, W2411083, 82572430), the National Key Research and Development Program of China (No. 2022YFB3203800), the Natural Science Basic Research Program of Shaanxi (No. 2024JC-YBQN-0111), Guangdong Basic and Applied Basic Research Foundation (No. 2023A1515110803), the Postdoctoral Research Project of Shaanxi Province (No. 2023BSHEDZZ155), the Fundamental Research Funds for the Central Universities (Nos. ZYTS25102, TZJH2024047, ZYTS25107). We acknowledge Comprehensive Experimental Center for Chemistry and Bioscience, and the Instrumental Analysis Center of Xidian University for providing test equipment.
Supplementary material associated with this article can be found, in the online version, at doi:
S.A. Stacker, S.P. Williams, T. Karnezis, et al., Nat. Rev. Cancer 14 (2014) 159–172. doi: 10.1038/nrc3677
Z. Zhang, A.D. Colevas, W. Hara, et al., Nat. Rev. Clin. Oncol. 21 (2024) 449–467. doi: 10.1038/s41571-024-00892-0
J.C. Boughey, Y. Du, X. Shi, et al., JAMA 310 (2013) 1455–1461. doi: 10.1001/jama.2013.278932
S. Karaman, M. Detmar, J. Clin. Invest. 124 (2014) 922–928. doi: 10.1172/JCI71606
Z. Yang, R. Tian, J. Wu, et al., Cancer Res. 83 (2023) 3428–3441. doi: 10.3390/foods12183428
Z. Yang, Y. Ji, Q. Jia, et al., Mater. Today Bio 28 (2024) 101166. doi: 10.1016/j.mtbio.2024.101166
H. Bois, T.A. Heim, A.W. Lund, Sci. Immunol. 6 (2021) eabg3551. doi: 10.1126/sciimmunol.abg3551
K. He, C. Chi, D. Kou, et al., Transl. Res. 178 (2016) 74–80. doi: 10.1016/j.trsl.2016.07.010
V.V. Nandu, M.S. Chaudhari, Indian J. Surg. Oncol. 8 (2017) 109–112. doi: 10.1007/s13193-016-0616-z
C.L. Nguyen, M. Zhou, N. Easwaralingam, et al., Breast Oncol. 30 (2023) 6520–6527. doi: 10.1245/s10434-023-13824-6
S.Y. Jung, J.H. Han, S.J. Park, et al., Ann. Surg. Oncol. 26 (2019) 2409–2416. doi: 10.1245/s10434-019-07400-0
D. Murawa, C. Hirche, S. Dresel, et al., Br. J. Surg. 96 (2009) 1289–1294. doi: 10.1002/bjs.6721
M.G. Vander Heiden, L.C. Cantley, C.B. Thompson, Science 324 (2009) 1029–1033. doi: 10.1126/science.1160809
G. Bergers, S.M. Fendt, Nat. Rev. Cancer 21 (2021) 162–180. doi: 10.1038/s41568-020-00320-2
S. Pastorekova, R.J. Gillies, Cancer Metastasis Rev. 38 (2019) 65–77. doi: 10.1007/s10555-019-09799-0
E.R. Pereira, D. Kedrin, G. Seano, et al., Science 359 (2018) 1403–1407. doi: 10.1126/science.aal3622
N. Nishio, N.S. Vav Den Berg, S. Van Keulen, et al., Nat. Commun. 10 (2019) 5044. doi: 10.1038/s41467-019-13076-7
Z.T. Bennett, Q. Feng, J.A. Bishop, et al., Theranostics 10 (2020) 3340–3350. doi: 10.7150/thno.41239
Z. Wang, H. Xia, B. Chen, et al., Angew. Chem. Int. Ed. 60 (2021) 14512–14520. doi: 10.1002/anie.202102044
P. Wu, Y. Zhu, S. Liu, et al., ACS Cent. Sci. 7 (2021) 2039–2048. doi: 10.1021/acscentsci.1c01066
F. Shan, T. Zhang, C. Liao, et al., Chin. Chem. Lett. 34 (2023) 108402. doi: 10.1016/j.cclet.2023.108402
J. Zhang, B. He, Y. Hu, et al., Adv. Mater. 33 (2021) e2008071. doi: 10.1002/adma.202008071
Q. Jia, R. Zhang, Y. Wang, et al., Sci. Bull. 67 (2022) 288–298. doi: 10.1016/j.scib.2021.11.003
X.H. Zhang, Y. Qin, H.C. Zhang, et al., Chin. Chem. Lett. 36 (2025) 110715. doi: 10.1016/j.cclet.2024.110715
T. Ma, Y. Hou, J. Zeng, et al., J. Am. Chem. Soc. 140 (2018) 211–218. doi: 10.1021/jacs.7b08900
W. Li, W. Gao, M. Wen, et al., Chin. Chem. Lett. 36 (2025) 110803. doi: 10.1016/j.cclet.2024.110803
Y. Zhan, S. Ling, H. Huang, et al., Angew. Chem. Int. Ed. 60 (2021) 2637–2642. doi: 10.1002/anie.202011903
Z. Huang, F. Fu, C. Deng, et al., Chin. Chem. Lett. 37 (2026) 111993. doi: 10.1016/j.cclet.2025.111993
Y. Hong, Y. Yang, C. Wang, et al., Anal. Chem. 96 (2024) 14320–14325. doi: 10.1021/acs.analchem.4c02289
Q. Jia, R. Zhang, H. Yan, et al., Angew. Chem. Int. Ed. 62 (2023) e202313420. doi: 10.1002/anie.202313420

Scheme 1 Schematic diagram of ICCPs. (A) Construction of ICCPs. (B) Precise imaging of tumor metastases in LNs.

Figure 1 pH-responsive characteristics of ICCPs. (A) UV–vis absorption spectra of ICCPs at pH 7.4 (black) and 6.7 (red). (B) Fluorescence emission spectra of ICCPs at pH 7.4 (black) and 6.7 (red). (C) Normalized fluorescence intensity of ICCPs across pH values from 7.4 to 6.0. (D) Fluorescence intensity as a function of pH. (E) Representative TEM images of ICCPs at pH 7.4 and 6.7. (F) Normalized fluorescence intensity of ICCPs at pH 7.4, pH 6.7, and in the presence of other biomolecules.

Figure 2 ICCPs responses to drug-induced modulation of glycolytic metabolism in cancer cells. (A) Confocal luminescence images of 4T1 cells following treatment with ryanodine or oxamate. Scale bar: 20 µm. (B) Confocal luminescence images of 4T1 multicellular clusters (MCs) following treatment with ryanodine or oxamate. Scale bar: 100 µm. (C, D) Luminescence images of BALB/c mice subcutaneously injected with 105 4T1 cells treated with ryanodine or oxamate in the left rear thigh muscle and 105 untreated 4T1 cells in the right rear thigh muscle (control). DAPI, 4′,6-diamidino-2-phenylindole.

Figure 3 In vivo optical imaging following injection of different concentrations of ICG or ICCPs. (A) Whole-body optical imaging of BALB/c nude mice bearing subcutaneous 4T1 tumors at various time points after probes injection. Groups 1–7: 1–6. Free ICG (8, 40, 80, 200, 400, 1000 µg/mL); 7. ICCPs (loading ICG 8 µg/mL). (B) Quantified fluorescence signal intensities for Groups 1 and 7 at the indicated time points after intravenous administration, corresponding to panel (A). (C) The tumor/tissue contrast (T/N) for Groups 1 and 7 at the indicated time points after i.v. administration, corresponding to panel (A). Data represents the mean ± SD (n = 3 biologically independent experiments).

Figure 4 Whole-body optical imaging of popliteal LN metastases in 4T1-luc tumor-bearing mice. (A) Representative bioluminescence (left) and fluorescence (right) images of popliteal LN metastases in 4T1-luc tumor-bearing mice after intraplantar injection of ICG into the hind paws. (B) Representative bright-field images of LNs after intraplantar injection of Evans blue into the hind paws. (C) Ex vivo images of LNs following Evans blue injection into the hind paws. (D) Ex vivo fluorescence images of LNs following ICG injection into the hind paws. (E) Representative HE staining of LNs corresponding to panel (D). (F) Representative bioluminescence (left) and fluorescence (right) images of popliteal LN metastases in 4T1‑luc tumor-bearing mice after intraplantar injection of ICCPs into the hind paws. (G) Representative bright-field images of LNs after intraplantar injection of Evans blue into the hind paws at normal and metastasis sides. (H) Ex vivo images of LNs following Evans blue into the hind paws on the normal and metastatic sides. (I) Ex vivo fluorescence images of LNs following ICCPs injection into the hind paws at normal and metastasis sides. (J) Representative HE staining of LNs from the metastatic side, corresponding to panel (I). Scale bar: 200 µm.

Figure 5 The specificity of ICCPs for tumor extracellular pH-responsive imaging. (A) Immumofluorescence staining and immunohistochemical staining of MCT-4 and LDH-A. Scale bar: 100 µm. (B) WB of MCT-4 and LDH-A expression in normal LN (denoted as N) and metastatic LN (denoted as M). (C) Quantitative analysis of MCT-4 and LDH-A expression. GAPDH, glyceraldehyde-3-phosphate dehydrogenase.

 扫一扫看文章


扫一扫关注我们
 DownLoad:
 下载:
 下载: