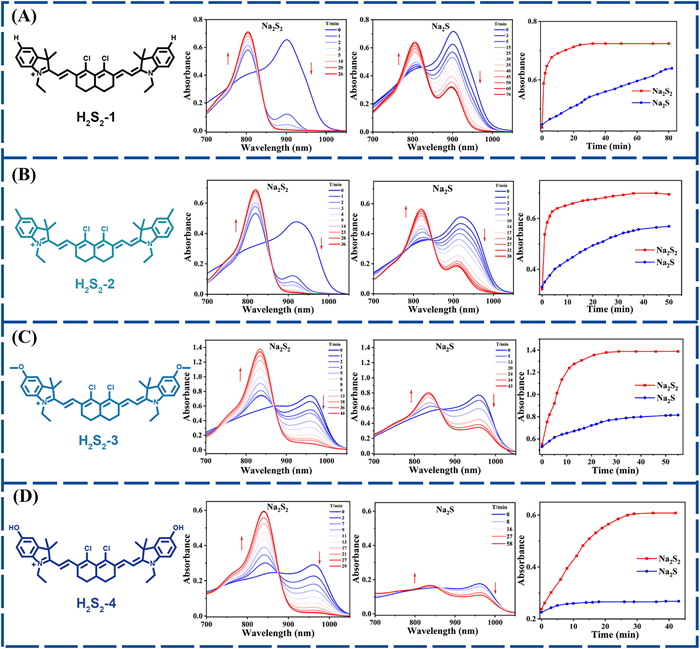
Figure 1.
Time-dependent absorption changes of 10 µmol/L H2S2–1 (A), H2S2–2 (B), H2S2–3 (C), and H2S2–4 (D) in the presence of 50 µmol/L Na2S2.

Electronic tuning of cyanine for highly specific dual ratiometric NIR-Ⅱ fluorescence/photoacoustic imaging of H2S2 in vivo
Zhenni Lin , Bangping Hu , Qinian Liu , Yujie Huang , Xing-Can Shen , Hua Chen


Reactive sulfur species (RSS) are a family of sulfur containing molecules that play vital roles in biological systems and are involved in diverse signal transduction pathways [1]. Typical RSS include biological thiols [2,3], hydrogen sulfide (H2S) [4-10], hydrogen polysulfides (H2Sn, n > 1), persulfides, polysulfides [11,12], and S-modified cysteine adducts [13], among others. As research in this field advances, certain biological effects in some physiological and pathological processes previously ascribed to H2S have been found to be mediated by H2S2 [14], which exhibits stronger nucleophilicity and reducibility than biological thiols or H2S. For instance, H2S2 is implicated in processes such as tumor suppressor activation, cardiovascular regulation, ion channel and transcription factor modulation, protein S-persulfidation, inflammation, and antioxidant responses [15-17]. Despite its significant biological importance, research on H2S2 remains in its nascent stages, with many unresolved questions persisting. Therefore, the development of effective tools for bioimaging of H2S2 in vivo with high specificity and high sensitivity is of great significance, especially deepening our understanding of its physiological functions in complex biological systems.
Traditional methods such as ultraviolet (UV) spectroscopy, colorimetry, chromatography, and mass spectrometry are hard for real-time monitoring and in situ tracking of H2Sn dynamics [18-20]. As an alternative, fluorescence-based approaches, especially when coupled with molecular probes, offer visual imaging and non-destructive analytical capabilities for the detection of chemical species within living systems [21-24]. To date, several molecular probes for monitoring H2Sn in living systems have been reported [17,25-40], but most of these probes often suffer from limitations such as poor selectivity for polysulfides over other sulfur species, sluggish kinetics, susceptibility to esterase-mediated hydrolysis, and the generation of cytotoxic byproducts. These drawbacks compromise the accuracy and reliability of H2Sn detection in complex biological systems. To overcome these challenges, recently, our group have discovered an H2S2-mediated dithiole formation reaction that showed selectivity for H2S2 [39,41]. However, we observed that upon prolonged reaction time (particularly beyond 1 h, Fig. 1), the novel 1,3-dichloro recognition motif also exhibited a degree of unresolved cross-reactivity with H2S. Consequently, the development of reliable probes capable of achieving highly specific detection of H2S2 in vivo remains an urgent challenge.
In this work, we designed and synthesized a series of H2S2-activated near-infrared-Ⅱ (NIR-Ⅱ) cyanine molecular probes, namely H2S21–4, which regulated the aromatic nucleophilic substitution reaction between the 1,3-dichloro moiety and the dual sulfhydryl groups of H2S2 through the electronic effect of substituents (Scheme 1). As expected, the dual ratiometric NIR-Ⅱ fluorescence (FL)/photoacoustic (PA) probe, H2S2–4, performed best among the four probes designed due to the strong electron-donating effect of the hydroxyl substituents, demonstrating selective recognition of H2S2 over H2S with robust ratiometric responses in both NIR-Ⅱ fluorescence (I890/I1020, 42-fold increase) and photoacoustic imaging (PA840/PA960, 4.49-fold enhancement). Moreover, H2S2–4 has been successfully applied to monitor endogenous H2S2 dynamics in Escherichia coli (E. coli)-induced acute peritonitis and hindlimb infection mouse models with high accuracy and reliability in vivo. Furthermore, this study elucidates an electronic tuning strategy that can be generalized to the design of advanced probes for precision imaging H2S2.
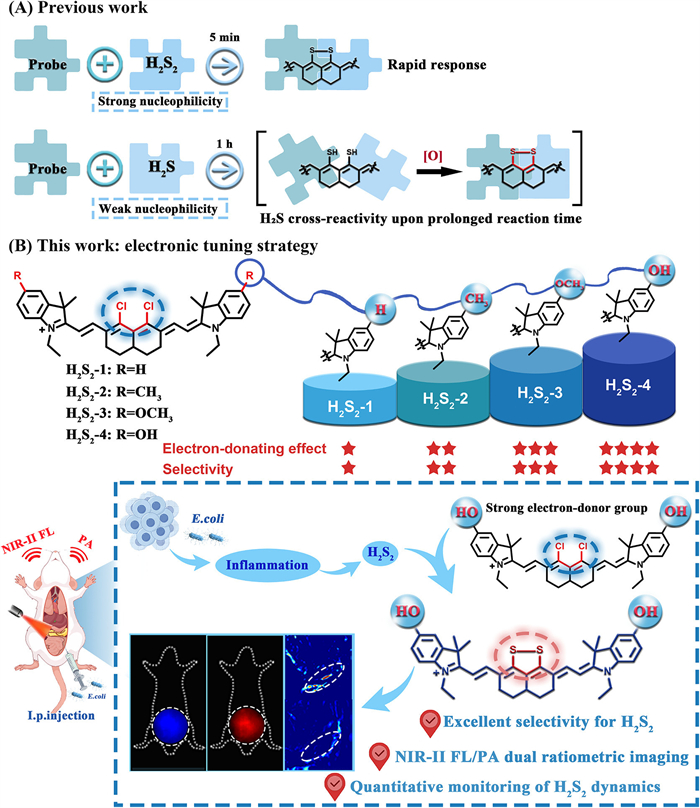
Given that H2S2 exhibits stronger nucleophilicity than H2S [11], traditional fluorescent probes demonstrate high reactivity toward both species, making it challenging to design highly specific H2S2 probes. Generally, modulating the electron donating ability of the aromatic moiety may reduce the nucleophilic reactivity, thereby enabling the development of high-performance probes for H2S2 imaging. In light of the aforementioned considerations, we propose an electron tuning strategy for designing highly specific H2S2 probes. To validate our hypothesis, we designed and synthesized four probes with different electron-donating groups (H, CH3, OCH3, and OH). As illustrated in the ultraviolet-visible (UV–vis) spectroscopic tests (Fig. 1, Figs. S1 and S2 in Supporting information), H2S2–1 reacted rapidly with H2S2 and H2S, with selective differences for a short period of time (Fig. 1A); however, with the prolongation of time (≥60 min), it showed obvious unresolved cross-reactivity with H2S, underscoring the need for further optimization. For compounds H2S2–2 and H2S2–3, this enhancement in electron-donating ability resulted in slower spectroscopic response kinetics toward H2S2 and H2S, accompanied by a gradual increase in selectivity (Figs. 1B and C). Ultimately, the introduction of a hydroxy group with electron-donating ability onto the NIR-Ⅱ cyanine (Scheme 1 and Scheme S1 in Supporting information) endowed the probe (H2S2–4) with the ability to remain inert toward H2S for an extended period (≥60 min) while maintaining reactivity toward H2S2 (Fig. 1D). Additionally, the probe further exhibited excellent stability in phosphate-buffered saline (PBS) and saline (Fig. S3 in Supporting information). Considering both reactivity and selectivity, H2S2–4 was selected as the optimal probe for subsequent studies.
The NIR-Ⅱ FL/PA dual-ratiometric responses of H2S2–4 to H2S2 were evaluated by means of UV–vis absorption spectroscopy, fluorescence spectroscopy, and PA spectroscopy (Tables S1-S4 in Supporting information). As presented in Fig. 2A, the UV–vis absorption spectra of H2S2–4 showed that as the concentration of H2S2 increased, the absorption peak at 960 nm weakened, while a new absorption signal appeared at 840 nm. A robust linear relationship (Fig. 2E) provided additional confirmation that H2S2–4 acts as a colorimetric probe for H2S2. Fluorescence titration spectra, which were obtained under different H2S2 concentration conditions (Fig. 2B), showed a reduction in emission intensity at 1020 nm and the emergence of a new emission peak at 890 nm. The 130 nm emission shift and well-separated dual-emission bands verified the outstanding NIR-Ⅱ fluorescence ratiometric response of H2S2–4 toward H2S2. The fluorescence intensity ratio (I890/I1020) exhibited a 42-fold increase and showed a linear dependence on H2S2 concentration (Fig. 2F). The computed detection limit (3σ/k) for H2S2 via H2S2–4, calculated on the basis of the fluorescence ratio, was determined to be approximately 38.8 nmol/L. This result indicates that H2S2–4 is capable of effectively detecting H2S2 at relatively low concentrations. The selectivity of the probe toward biologically relevant interfering substances was evaluated further. Of note, when Na2S and NaClO were applied together, a significant absorption change was observed which is attributed to the in situ generation of H2S2 from H2S and ClO− (Fig. 2C). A panel of RSS, including glutathione (GSH), cysteine (Cys), homocysteine (Hcy), S2O32−, SO42−, Na2S, Na2S4, and S8 did not trigger any significant enhancement in the fluorescence ratio (Fig. 2D).
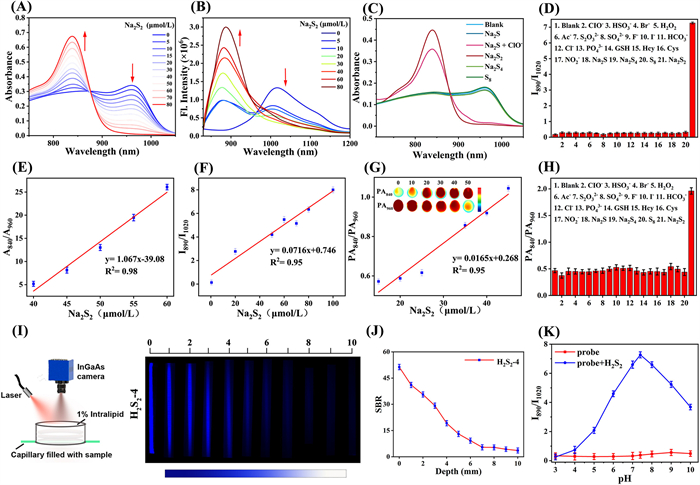
PA imaging of H2S2–4 solution samples revealed that under excitation at 840 nm, the PA signal exhibited a significant increase upon titration with Na2S2; by contrast, the PA signal under excitation at 960 nm underwent a decrease during this titration process. With the concentration of Na2S2 rising from 0 to 80 µmol/L, the PA840/PA960 ratio increased in a nearly linear manner, from roughly 0.43 ± 0.03 to 1.93 ± 0.07. Additionally, PA840/PA960 showed roughly a 4.49-fold increase (Fig. 2G and Fig. S4 in Supporting information).
Additionally, in vitro PA selectivity experiments demonstrated that interfering species did not bring about significant changes in the PA840/PA960 ratio (Fig. 2H), which was consistent with the fluorescence selectivity results. Thus, H2S2–4 demonstrated excellent specificity for H2S2 in dual-ratiometric NIR-Ⅱ FL/PA detection. Furthermore, we examined the impact of pH on the reaction of H2S2–4 with H2S2. As presented in Fig. 2K, after addition of Na2S2, H2S2–4 retained efficient functionality across a pH range spanning weakly acidic to alkaline conditions. Taken together, these results unequivocally demonstrate that H2S2–4 is suitable for the detection of H2S2 via the dual-ratiometric NIR-Ⅱ FL/PA mode in vitro.
To clarify the potential reaction mechanism, we further verified the reaction of H2S2–4 with Na2S2 via electrospray ionization mass spectrometry (ESI-MS) (Fig. S5 in Supporting information), confirming the reactivity of H2S2–4 toward H2S2. Additionally, we selected H2S2–1 as the model compound. As shown in Fig. S6 (Supporting information), ESI-MS analysis of the reaction mixture of H2S2–1 and Na2S verified the Na2S2-induced response mechanism. After adding Na2S2 to the H2S2–1 solution, a molecular ion peak was observed at [M]+ = 591.2864 (Fig. S7 in Supporting information). In contrast, when Na2S was added to the H2S2–1 solution, the intermediate ion peak at [M]+ = 593.2874 and the post-response compound ion peak at [M]+ = 591.2869 were sequentially detected over time (Fig. S6), further confirming that nucleophilic substitution occurs first, followed by dithiolane ring formation. Moreover, we used the Gaussian 09 program to calculate the natural bond orbital (NBO) charges of carbon atoms at specific sites in different probes; the NBO charge level is steadily decreasing (Fig. S8 in Supporting information). These results confirm the effectiveness of our proposed molecular regulation strategy.
Prior to evaluating the imaging potential of H2S2–4 for in vitro H2S2 detection, we assessed its tissue penetration ability by performing imaging on a liposome model using a capillary tube loaded with H2S2–4. This capillary tube was immersed in a 1% liposome solution. As shown in Fig. 2I, even at a depth of 6 mm in the 1% liposome solution, the wall of the tube containing H2S2–4 remained clearly distinguishable in the NIR-Ⅱ region, and its signal-to-background ratio (SBR) is as shown in Fig. 2J. These results demonstrate the superior imaging resolution and contrast of H2S2–4, establishing its suitability for in vivo deep-tissue imaging applications.
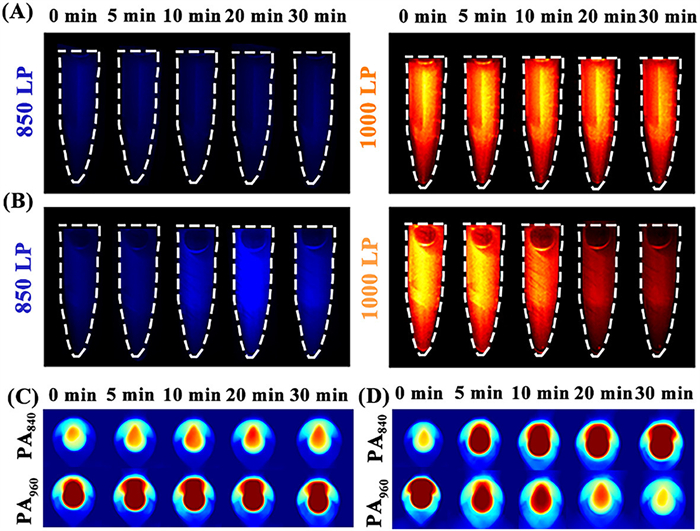
NIR-Ⅱ FL/PA dual-modality imaging can overcome the shortcomings of a single modality and achieve complementary advantages to further optimize the signal output of biological tissues [42-48]. In order to assess the capability of H2S2–4 for in vitro H2S2 detection, we first conducted NIR-Ⅱ FL/PA dual-ratiometric imaging experiments using centrifuge tubes (Fig. 3). When Na2S2 was absent, the NIR-Ⅱ fluorescence ratio of H2S2–4 showed little variation within the 0–30 min period, sustaining a value of roughly 1.71 ± 0.03 (Fig. 3A). After Na2S2 was added, the corresponding fluorescence ratio increased from 1.84 ± 0.03 to 4.22 ± 0.02 over time, representing an approximate 2.29-fold increase (Fig. 3B and Fig. S9A in Supporting information). Likewise, Fig. 3C demonstrates that the PA signal ratio of H2S2–4 alone stayed stable at approximately 0.55 ± 0.02; in contrast, following the addition of Na2S2, the PA ratio rose by a factor of 2.20 (reaching 1.21, Fig. 3D and Fig. S9B in Supporting information). These results revealed a significant change in the NIR-Ⅱ FL/PA ratio in tubes with added Na2S2, thus verifying the effectiveness of H2S2–4 in ex vivo H2S2 detection.
Biocompatibility of a probe serves as a fundamental requirement for in vivo imaging applications. Therefore, the biocompatibility of H2S2–4 underwent assessment. Initially, a standard cell counting kit-8 (CCK-8) assay was employed to evaluate the potential cytotoxicity of H2S2–4 in viable cells. As illustrated in Fig. S10A (Supporting information), even at a concentration of up to 25 µmol/L, cell viability remained above 80%, a result that verifies its favorable biocompatibility. Additionally, normal saline or H2S2–4 was administered via intravenous injection to the control group and the experimental mouse group, respectively. Through 7-day monitoring of the daily behavior of mice and recording of their body weight fluctuations, no deaths were detected, and no notable differences were found in body weight changes (Fig. S10B in Supporting information). Collectively, these findings demonstrate that the probe possesses outstanding biocompatibility and low toxicity, rendering it applicable for in vivo imaging in biological organisms.
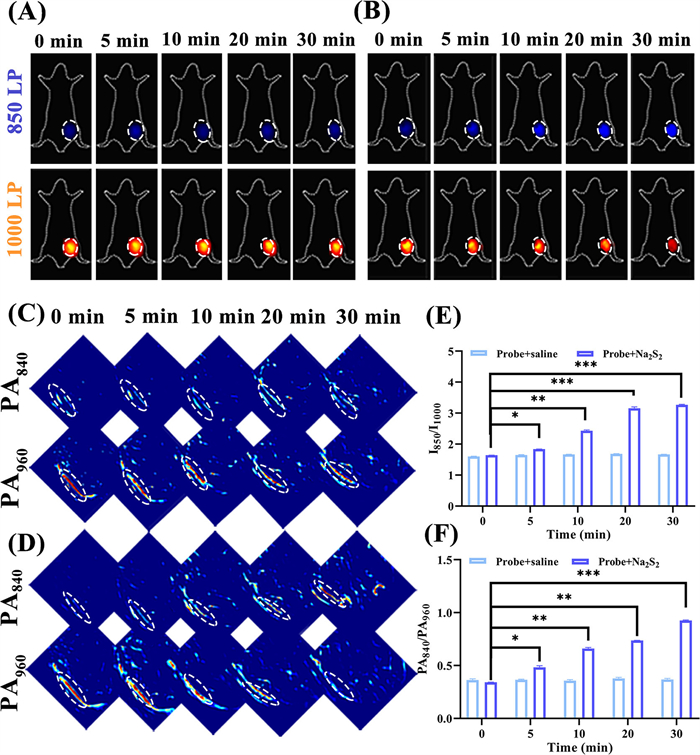
Subsequently, for assessing the in vivo detection capacity of H2S2–4 as a chemical tool for detecting exogenous H2S2, the probe and Na2S2 were administered to mice via subcutaneous injection. All animal experiments were approved by the Animal Ethics Committee of Guangxi Normal University. Variations in the NIR-Ⅱ fluorescence and PA dual-ratiometric signals of the probe were tracked for a 30-min period. The imaging results demonstrated that after the administration of the probe and saline, the NIR-Ⅱ ratio signal intensity (I850/I1000) exhibited no significant variation (Fig. 4A). In contrast, following the administration of the probe and exogenous Na2S2 (Fig. 4B), as time progressed, the NIR-Ⅱ FL signal intensity exhibited an upward trend at 850 nm, whereas a decrease was observed at 1000 nm. Moreover, the FL intensity ratio increased swiftly and achieved a steady state within a 30-min window. The I850/I1000 rose from 1.64 ± 0.02 to 3.25 ± 0.05, corresponding to an approximate 1.98-fold enhancement (Fig. 4E). Furthermore, the ratio in PA imaging showed a similar trend. In comparison, following the administration of the probe and saline, the mice displayed no notable variation in PA intensity in the two channels (Fig. 4C). However, as shown in Fig. 4D, following exposure to Na2S2, the PA signal intensity rose at 840 nm while declining at 960 nm. As a result, the PA ratio signal (PA840/PA960) increased from 0.35 ± 0.02 to 0.65 ± 0.03, corresponding to an approximate 1.85-fold enhancement (Fig. 4F). These experimental results further confirm the observation that H2S2–4 can effectively visualize exogenous H2S2 in vivo via NIR-Ⅱ FL/PA dual-ratiometric imaging.
Previous studies have shown that bacterial infection causes severe inflammation, leading to increased endogenous H2S2 levels [49,50]. Before conducting bacterial infection experiments, we examined the response of H2S2–4 to endogenous H2S2 using lipopolysaccharide (LPS, an inflammatory mediator) [51]. After LPS administration for 12 h, H2S2–4 was injected locally, and the NIR-Ⅱ fluorescence and photoacoustic dual-ratiometric signals of the probe were continuously monitored. As shown in Fig. S11 (Supporting information), imaging results showed no significant changes in the hind limbs of non-LPS-induced mice (Figs. S11A and C). In contrast, after LPS induction (Fig. S11B), the NIR-Ⅱ FL intensity at 850 nm increased over time, while that at 1000 nm decreased, with the NIR-Ⅱ ratio (I850/I1000) rising by 1.58-fold relative to the initial value (Fig. S11E). For ratiometric PA imaging, after LPS-induced endogenous H2S2 production (Fig. S11D), the PA intensity at 840 nm increased and that at 960 nm decreased, resulting in a 1.51-fold increase in the PA ratio (PA840/PA960) (Fig. S11F). These findings further confirm that H2S2–4 enables efficient in vivo visualization of endogenous H2S2 via NIR-Ⅱ FL/PA dual-ratiometric imaging.
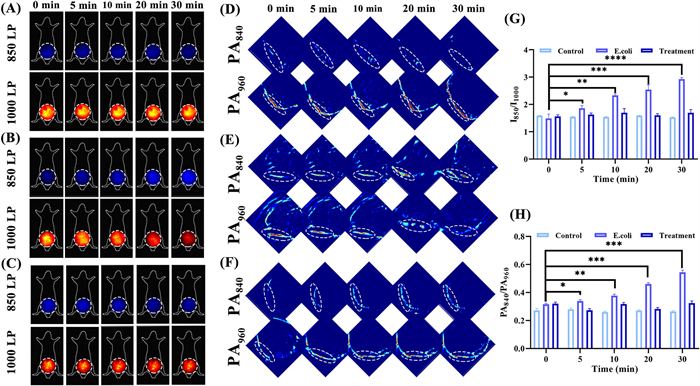
BALB/c mice (25−30 g) were divided into three groups: Control, experimental, and treatment groups. The experimental and treatment groups were given an intraperitoneal injection of E. coli (5 × 10⁶ CFU/mL) in accordance with previously reported protocols. Six hours after inoculation, the treatment group was administered ciprofloxacin once every 6 h for 7 consecutive days, after which NIR-Ⅱ fluorescence/photoacoustic dual-ratiometric imaging was performed. Imaging data revealed that the control and treatment groups showed no notable changes in abdominal NIR-Ⅱ ratiometric signal intensity (Figs. 5A and C). In contrast, the experimental group exhibited time-dependent variations in NIR-Ⅱ FL signals (Fig. 5B): The signal intensity increased in the 850 nm channel, decreased in the 1000 nm channel, and rose rapidly overall. The corresponding NIR-Ⅱ ratio (I850/I1000) increased from 1.52 ± 0.02 to 2.79 ± 0.05, representing an approximate 1.85-fold elevation (Fig. 5G). Consistent with this, ratiometric PA imaging exhibited similar trends. The control and treatment groups displayed no notable differences in PA intensity between the PA840 and PA960 channels (Figs. 5D and F). Notably, when E. coli triggered in vivo H2S2 generation (Fig. 5E), the PA signal intensity increased at 840 nm and decreased at 960 nm. As a result, the PA ratio signal (PA840/PA960) rose from 0.30 ± 0.02 to 0.53 ± 0.03, corresponding to a 1.77-fold enhancement (Fig. 5H). These findings confirmed the ability of H2S2–4 to efficiently visualize endogenous H2S2 produced during acute peritonitis in vivo.
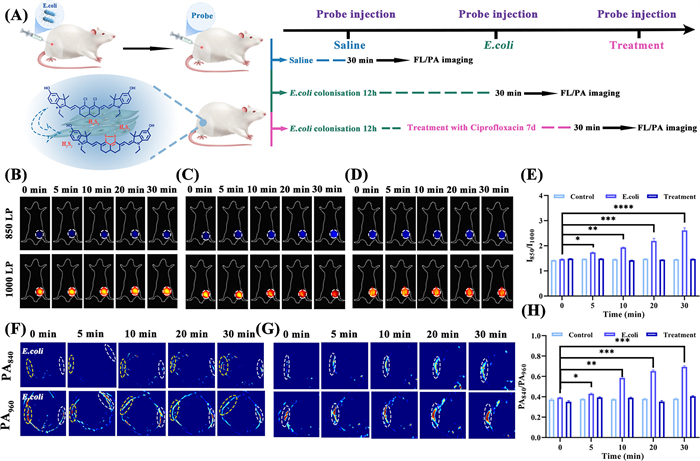
To further evaluate the performance of H2S2–4 in detecting bacterially induced endogenous H2S2 in vivo through the NIR-Ⅱ FL/PA dual-ratiometric imaging method, a hindlimb bacterial infection model was constructed (Fig. 6A). At 12 h post-inoculation, the treatment group was given ciprofloxacin every 6 h for 7 consecutive days, with NIR-Ⅱ FL/PA dual-ratiometric imaging subsequently performed. Imaging results demonstrated no significant changes in NIR-Ⅱ ratiometric signal intensity (I850/I1000) in the hindlimbs of control and treatment group mice (Figs. 6B and D). By comparison, the experimental group showed time-dependent changes in NIR-Ⅱ FL signals: Intensity increased at 850 nm and decreased at 1000 nm, with the overall FL intensity rising rapidly (Fig. 6C). Correspondingly, the NIR-Ⅱ ratio (I850/I1000) increased from 1.46 ± 0.02 to 2.52 ± 0.05, corresponding to an approximate 1.73-fold increase (Fig. 6E). Concurrently, ratiometric PA imaging exhibited a consistent trend: The control and treatment groups demonstrated no notable differences in PA intensity between the PA840 and PA960 channels (Figs. 6F-right and G). However, when E. coli induced in vivo H2S2 generation (Fig. 6F-left), the PA intensity increased at 840 nm and decreased at 960 nm, resulting in the PA ratio (PA840/PA960) rising from 0.40 ± 0.02 to 0.68 ± 0.03, an approximate 1.70-fold enhancement (Fig. 6H). These results further confirm that H2S2–4 can visualize endogenous H2S2 in a mouse model of inflammation induced by bacterial infection.
In conclusion, this study successfully addresses the challenge of selectively detecting H2S2 amidst competing RSS by electronic tuning of NIR-Ⅱ cyanine scaffold. Based on our strategy, a family of H2S2-activatable probes (H2S2–1 to H2S2–4) was rationally prepared in which substituent electronic effects regulate the aromatic nucleophilic substitution between the 1,3-dichloro moiety and H2S2’s dual sulfhydryl groups. Among these, the probe H2S2–4, equipped with strong electron-donating hydroxyl groups, demonstrated exceptional specificity for H2S2 over other biologically relevant sulfur species (including glutathione (GSH), cysteine (Cys), homocysteine (Hcy), Na2S, Na2S4, and S8). The probe H2S2–4 further exhibited robust dual ratiometric responses in both NIR-Ⅱ fluorescence and photoacoustic imaging, enabling precise and reliable quantification. The practical efficacy of H2S2–4 was confirmed through the successful monitoring of endogenous H2S2 dynamics in live mouse models of E. coli-induced acute peritonitis and bacterial hindlimb infection. More than a powerful tool for investigating H2S2-related pathophysiology, this work establishes a generalizable electronic-tuning strategy, paving the way for the rational design of advanced probes for precision deep-tissue imaging.
Zhenni Lin: Writing – review & editing, Writing – original draft, Formal analysis, Data curation, Conceptualization. Bangping Hu: Data curation, Conceptualization. Qinian Liu: Data curation, Conceptualization. Yujie Huang: Data curation, Conceptualization. Xing-Can Shen: Supervision, Funding acquisition. Hua Chen: Writing – review & editing, Writing – original draft, Validation, Supervision, Project administration, Methodology, Investigation, Funding acquisition, Formal analysis, Data curation, Conceptualization.
The authors declare that they have no known competing financial interests or personal relationships that could have appeared to influence the work reported in this paper.
This work was supported by the National Natural Science Foundation of China (No. 22167004), the Natural Science Foundation of Guangxi (No. 2023GXNSFFA026014), the National Natural Science Foundation of China (Nos. 22467004 and 22377018), the BAGUI Young Scholar Program of Guangxi, and the BAGUI Scholar Program of Guangxi, Innovation Project of Guangxi Graduate Education (No. XYCS2025106).
Supplementary material associated with this article can be found, in the online version, at doi:
G.K. Kolluru, R.E. Shackelford, X. Shen, et al., Nat. Rev. Cardiol. 20 (2023) 109–125. doi: 10.1038/s41569-022-00741-6
X. Chen, Y. Zhou, X. Peng, et al., Chem. Soc. Rev. 39 (2010) 2120–2135. doi: 10.1039/b925092a
D. Fass, C. Thorpe, Chem. Rev. 118 (2018) 1169–1198. doi: 10.1021/acs.chemrev.7b00123
G. Yang, L. Wu, B. Jiang, et al., Science 322 (2008) 587–590. doi: 10.1126/science.1162667
M.R. Filipovic, J. Zivanovic, B. Alvarez, et al., Chem. Rev. 118 (2017) 1253–1337.
A.V. Mishanina, M. Libiad, R. Banerjee, Nat. Chem. Biol. 11 (2015) 457–464. doi: 10.1038/nchembio.1834
B.C. Yu, Y.Q. Zheng, Z.N. Yuan, et al., J. Am. Chem. Soc. 140 (2018) 30–33. doi: 10.1021/jacs.7b09795
K.R. Olson, Y. Gao, F. Arif, et al., Redox Biol. 15 (2018) 74–85. doi: 10.1016/j.redox.2017.11.009
R. Wang, Physiol. Rev. 92 (2012) 791–896. doi: 10.1152/physrev.00017.2011
T.S. Bailey, M.D. Pluth, J. Am. Chem. Soc. 135 (2013) 16697–16704. doi: 10.1021/ja408909h
T. Ida, T. Sawa, H. Ihara, et al., Proc. Natl. Acad. Sci. U. S. A. 111 (2014) 7606–7611. doi: 10.1073/pnas.1321232111
P.K. Yadav, M. Martinov, V. Vitvitsky, et al., J. Am. Chem. Soc. 138 (2016) 289–299. doi: 10.1021/jacs.5b10494
C.E. Paulsen, K.S. Carroll, Chem. Rev. 113 (2013) 4633–4679. doi: 10.1021/cr300163e
H. Liu, M.N. Radford, C.T. Yang, et al., Br. J. Pharmacol. 176 (2019) 616–627. doi: 10.1111/bph.14330
N. Sen, B.D. Paul, M.M. Gadalla, et al., Mol. Cell 45 (2012) 13–24. doi: 10.1016/j.molcel.2011.10.021
D.H. Zhang, I. Macinkovic, N.O. Devarie-Baez, et al., Angew. Chem. Int. Ed. 53 (2014) 575–581. doi: 10.1002/anie.201305876
H. Dong, Q. Zhou, L. Zhang, et al., Angew. Chem. Int. Ed. 58 (2019) 13948–13953. doi: 10.1002/anie.201907210
C. Debiemme-Chouvy, C. Wartelle, F.X. Sauvage, J. Phys. Chem. B 108 (2004) 18291–18296. doi: 10.1021/jp046977y
J. Gun, A.D. Modestov, A. Kamyshny, et al., Microchim. Acta 146 (2004) 229–237. doi: 10.1007/s00604-004-0179-5
S. Koike, K. Kawamura, Y. Kimura, et al., Free Radic. Biol. Med. 113 (2017) 355–362. doi: 10.1016/j.freeradbiomed.2017.10.346
M. Yang, J. Fan, J. Du, et al., Chem. Sci. 11 (2020) 5127–5141. doi: 10.1039/d0sc01482f
Y. Yao, J. Chen, C. Yan, et al., J. Am. Chem. Soc. 147 (2025) 46953–46965. doi: 10.1021/jacs.5c10749
C. Yan, C. Liu, B. Liu, et al., Nat. Aging 5 (2025) 2532–2545. doi: 10.1038/s43587-025-01001-1
Y. Huang, L. Wang, Q. Huang, et al., Chin. J. Chem. 43 (2025) 2603–2612. doi: 10.1002/cjoc.70160
M. Xian, Y. Wang, C. Du, et al., Acc. Chem. Res. 58 (2025) 2804–2814. doi: 10.1021/acs.accounts.5c00483
K.G. Fosnacht, M.D. Pluth, Chem. Rev. 124 (2024) 4124–4257. doi: 10.1021/acs.chemrev.3c00683
X. Zhang, Y. Yang, L. Zhang, et al., Talanta 268 (2024) 125293. doi: 10.1016/j.talanta.2023.125293
Y. Zhou, Z. Gu, C. Liu, et al., Angew. Chem. Int. Ed. 61 (2022) e202114504. doi: 10.1002/anie.202114504
X. Zhang, L. Zhang, M. Gao, et al., J. Hazard. Mater. 396 (2020) 122673. doi: 10.1016/j.jhazmat.2020.122673
X. Luo, C. Zhang, C. Yue, et al., Chem. Sci. 14 (2023) 14290–14301. doi: 10.1039/d3sc04937j
J. Franz, M. Oelschlegel, J.P. Zobel, et al., J. Am. Chem. Soc. (2024) 11272–11288.
J. Zhang, M. He, M. Huang, et al., Angew. Chem. Int. Ed. 64 (2025) e202519021. doi: 10.1002/anie.202519021
X. Tan, J. Zhou, L. Yang, et al., J. Am. Chem. Soc. 146 (2024) 30422–30433. doi: 10.1021/jacs.4c10266
Z. Zheng, J. Gao, R. Wang, et al., ACS Nano 17 (2023) 22060–22070. doi: 10.1021/acsnano.3c08767
Z. Lv, J. Wang, J. Xu, et al., Adv. Healthcare Mater. 14 (2025) 2500273. doi: 10.1002/adhm.202500273
C. Liu, W. Chen, W. Shi, et al., J. Am. Chem. Soc. 136 (2014) 7257–7260. doi: 10.1021/ja502968x
J. Guo, S. Yang, C. Guo, et al., Anal. Chem. 90 (2017) 881–887.
W. Chen, E.W. Rosser, T. Matsunaga, et al., Angew. Chem. Int. Ed. 54 (2015) 13961–13965. doi: 10.1002/anie.201506887
B. Hu, Q. Liu, Y. Jiang, et al., Angew. Chem. Int. Ed. 64 (2025) e202418378. doi: 10.1002/anie.202418378
L. Sun, Z. Zheng, Z. Zhang, et al., Anal. Chem. 96 (2024) 20049–20056. doi: 10.1021/acs.analchem.4c04848
C. Zhao, X. Yang, Chin. J. Org. Chem. 45 (2025) 1419–1420. doi: 10.2147/copd.s503625
R.R. Zhang, X.Y. Ran, K.K. Yu, et al., Adv. Mater. 37 (2025) 2415891. doi: 10.1002/adma.202415891
W. Pan, M. Rafiq, W. Haider, et al., Coord. Chem. Rev. 514 (2024) 215907. doi: 10.1016/j.ccr.2024.215907
Y. Xu, C. Li, R. Xu, et al., Chem. Sci. 11 (2020) 8157–8166. doi: 10.1039/d0sc03160g
J. Huang, K. Pu, Angew. Chem. Int. Ed. 59 (2020) 11717–11731. doi: 10.1002/anie.202001783
B. Li, H. Liu, M. Zhao, et al., Angew. Chem. Int. Ed. 63 (2024) e202404093. doi: 10.1002/anie.202404093
Y. Zhang, S. Lei, Y. Pan, et al., Chin. Chem. Lett. 37 (2026) 110977. doi: 10.1016/j.cclet.2025.110977
H. Liu, Q. Sun, M. Dong, et al., Chin. Chem. Lett. 37 (2026) 111655. doi: 10.1016/j.cclet.2025.111655
K. Buscher, H. Wang, X. Zhang, et al., Nat. Commun. 7 (2016) 10828. doi: 10.1038/ncomms10828
Y. He, X. Wang, S. He, et al., ACS Nano 19 (2025) 6977–6992. doi: 10.1021/acsnano.4c14689
F. Di Lorenzo, K.A. Duda, R. Lanzetta, et al., Chem. Rev. 122 (2022) 15767–15821. doi: 10.1021/acs.chemrev.0c01321

Figure 1 Time-dependent absorption changes of 10 µmol/L H2S2–1 (A), H2S2–2 (B), H2S2–3 (C), and H2S2–4 (D) in the presence of 50 µmol/L Na2S2.

Scheme 1 Schematic illustrating the dual ratiometric NIR-Ⅱ FL/PA probe for H2S2 with unprecedented specificity based on electronic tuning strategy.

Figure 2 Time-dependent (A) absorption changes and (B) emission changes of 10 µmol/L H2S2–4 in the presence of 80 µmol/L Na2S2, λex = 808 nm. (C) Absorption changes of H2S2–4 in the presence of relevant reactive species. (D) The fluorescence selectivity of H2S2–4 toward different analytes in PBS. H2O2 (200 mmol/L), GSH (1 mmol/L), Hcy (100 mmol/L), Cys (60 mmol/L), Na2S (80 µmol/L), Na2S4 (80 µmol/L), S8 (80 µmol/L), Na2S2 (80 µmol/L) the concentrations of all other substances were 100 µmol/L, and the concentrations of all analytes mentioned later are consistent with those here. (E) Linear relationship between the absorption intensity ratio (A840/A960) and Na2S2 concentration. (F) Linear relationship between the fluorescence intensity ratio (I890/I1020) and Na2S2 concentration. (G) Linear relationship between the PA intensity ratio (PA840/PA960) and Na2S2 concentration, illustration: PA images of H2S2–4 solution responding with different Na2S2. (H) The PA selectivity of H2S2–4 toward different analytes in PBS. (I) Fluorescence images of capillaries filled with H2S2–4 (100 µmol/L) (λex = 808 nm (1100 mW/cm2)), 100 ms exposure time and a 1000 long pass (LP) filter, respectively, immersed in 1% intralipid with varying depth. (J) SBR for fluorescence imaging of H2S2–4 as a function of the intralipid depth in (I). (K) Fluorescence responses of the probe H2S2–4 (10 µmol/L) in the absence and presence of Na2S2 (80 µmol/L) under different pH values. Data are the mean ± SD (n = 3).

Figure 3 (A) Time-dependent NIR-Ⅱ ratiometric fluorescence imaging of probe H2S2–4 (100 µL, 100 µmol/L) in the absence of Na2S2. (B) Time-dependent NIR-Ⅱ ratiometric fluorescence imaging of probe H2S2–4 in the presence of Na2S2. (C, D) Time-dependent PA ratiometric imaging of probe H2S2–4 in the absence and presence of Na2S2. Data are the mean ± SD (n = 3).

Figure 4 NIR-Ⅱ ratiometric fluorescence imaging of the probe H2S2–4 (100 µmol/L, 100 µL) in the absence (A) and presence (B) of Na2S2 with the filters of 850 nm LP, and 1000 nm LP, respectively. PA ratiometric imaging of the probe H2S2–4 in the absence (C) and presence (D) of Na2S2. (E) NIR-Ⅱ fluorescence ratio (I850/I1000) corresponding to (A, B). (F) PA signal ratio (PA840/PA960) corresponding to (C, D). Note that the ratiometric signals (I850/I1000 and PA840/PA960) reflect relative changes in H2S2 levels. Quantitative analysis of the signal changes in different groups. Data are the mean ± SD (n = 3). Statistical analysis was performed using one-way ANOVA followed by multiple comparison tests. *P < 0.05, **P < 0.01, ***P < 0.001.

Figure 5 NIR-Ⅱ ratiometric fluorescence imaging of the probe H2S2–4 (100 µmol/L, 100 µL) in the absence (A) and presence (B) of E. coli induction and (C) ciprofloxacin treatment in mice. PA ratiometric imaging of the probe H2S2–4 in the absence (D) and presence (E) of E. coli induction and (F) ciprofloxacin treatment. (G) NIR-Ⅱ fluorescence ratiometric signal (I850/I1000) obtained from (A-C). (H) PA ratiometric signal (PA840/PA960) obtained from (D-F). Quantitative analysis of the signal changes in different groups. Data are the mean ± SD (n = 3). Statistical analysis was performed using one-way ANOVA followed by multiple comparison tests. *P < 0.05, **P < 0.01, ***P < 0.001.

Figure 6 (A) Schematic of E. coli-induced bacterial infections of the hindlimbs model in mice. NIR-Ⅱ ratiometric fluorescence imaging of the probe H2S2–4 (100 µmol/L, 100 µL) in the absence (B) and presence (C) of E. coli induction and (D) ciprofloxacin treatment in mice. (E) Corresponding FL intensity ratio (I850/I1000). (F) PA ratiometric imaging of the probe H2S2–4 in the absence (right) and presence (left) of E. coli induction and ciprofloxacin treatment (G). (H) Corresponding PA intensity ratio (PA840/PA960). Quantitative analysis of the signal changes in different groups. Data are the mean ± SD (n = 3). Statistical analysis was performed using one-way ANOVA followed by multiple comparison tests. *P < 0.05, **P < 0.01, ***P < 0.001, ****P < 0.0001.

 扫一扫看文章


扫一扫关注我们
 DownLoad:
 下载:
 下载: