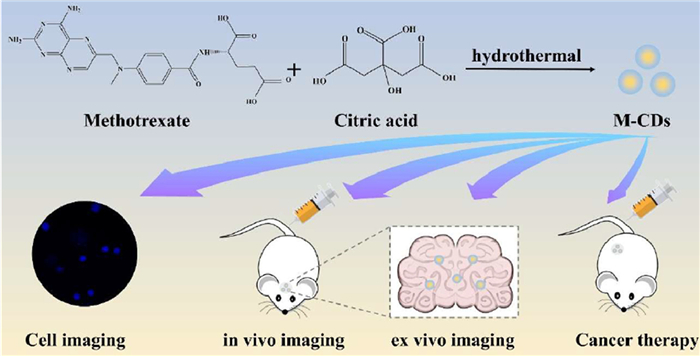
Scheme 1.
Schematic representation of the synthesis process and biomedical application of M-CDs.

Self-targeted carbon dots with intrinsic bioactivities for the treatment of lymphoma
Haolin Chen , Jieyi Chen , Xiaoyan Liu , Yinglin Xu , Hengyu Liu , Bo Xu , Dongjun Lin , Jun Wu


Recently, carbon dots (CDs) have emerged as a promising class of carbon nanomaterial, attracting significant research interest owing to their tunable fluorescence, excellent photostability, favourable biocompatibility, low toxicity, and remarkable photoluminescence quantum yield (PLQY) [1]. CDs are characterized by dimensions of <10 nm, demonstrating significant potential in the realm of nanobiotechnology, including drug delivery, bioimaging and biosensing, particularly in antibacterial, anticancer and antiviral therapies [2,3]. Owing to their small particle size, CDs can be rapidly cleared via renal metabolism, and their long-term biotoxicity is low [4]. Recently, CDs have attracted considerable attention for therapeutic applications due to their unique advantages. Notably, CDs can be synthesized from diverse raw materials [5,6]. Currently, the primary synthetic method for CDs are categorized as: “top-down” and “bottom-up” approaches [7,8]. The “bottom-up” approach carbonizes small molecules or polymers into CDs by solvothermal/hydrothermal [9], or microwave method [10]. Conversely, the top-down approach involves chemical exfoliation [11], electrochemical carbonization [12] or physical methods such as laser ablation [13]. Typically, the latter strategy is particularly suited for breaking down organic precursors with large carbon structure, such as apple juice [14], herbs [15], milk [16], honey [17], and leaves [18], into smaller CDs with different properties. Moreover, the resulting CDs often may retain the bioactivity of their precursors, which can potentially enhance properties inherent to the raw materials, such as luminescent spectra and specific absorption [19,20]. Using drugs as precursors to prepare CDs, which are endowed with fluorescence properties. Drug-derived CDs offer a distinct advantage by enabling integrated disease diagnosis and treatment while preserving the precursor drug's therapeutic effects [21,22]. This approach represents a promising strategy for developing multifunctional drug-derived CDs that serve as both nanocarriers and bioimaging agents. For example, anti-inflammatory CDs derived from aspirin (aspCDs) were fabricated, achieving blood-brain barrier (BBB) penetrating effects, retained anti-inflammatory properties and real-time drug visualization capabilities [23]. Adenosine- and aspirin-based CDs (AACDs) exhibit a synergistically greater impact on promoting osteogenesis than either precursor alone [24]. Metformin was employed as a precursor to synthesize CDs possessing high biocompatible, strong fluorescent, as well as targeted bioimaging and BBB penetration capabilities. Owing to their small size, CDs can readily to traverse the BBB, demonstrating significant potential for theranostics in brain diseases, such as brain tumors, Alzheimer, Parkinson, primary central nervous system lymphoma [25]. Additionally, several drug-derived CDs have been investigated for the treatment of anti-frostbite [26], gout [27], haemostasis [28], and antivenom [29]. In a prior study, gallic acid and tyrosine were employed as precursors to synthesize integrated GT-CDs via a hydrothermal method. These CDs exhibited intrinsic photothermal and tumor-specific biological activities, enabling their application in photothermal optical coherence tomography (PT-OCT) imaging and proving to be effective in tumor treatment [9].
Methotrexate (MTX) is a widely used antitumor agent in cancer therapy. Structurally analogous to folic acid, MTX functions as an antimetabolite by interfering with folate metabolism. However, MTX is associated with significant side effects especially in high-dose MTX (HD-MTX), such as renal insufficiency, which can seriously affect patients' quality of life [30]. Inspired by the previous studies, we developed novel M-CDs through a hydrothermal method, utilizing MTX and citric acid (CA) as starting materials. The resulting fluorescent M-CDs retain the inherent bioactivity of MTX, which can act as effective anticancer agents. Compared to free MTX, M-CDs exhibit not only bright fluorescence but also selective cytotoxicity against A20 mouse B cell lymphocyte cells. Intriguingly, our findings reveal that M-CDs possess the ability to cross the BBB in vivo. Altogether, novel fluorescent M-CDs based on MTX were successfully fabricated to penetrate BBB and bioimaging, as well as for cancer therapy (Scheme 1). These results highlight the potential of M-CDs as a multifunctional platform for treating brain tumors and central nervous system (CNS) lymphoma. Furthermore, this study lays the foundation for the design of integrated nanoplatforms for cancer theranostics.
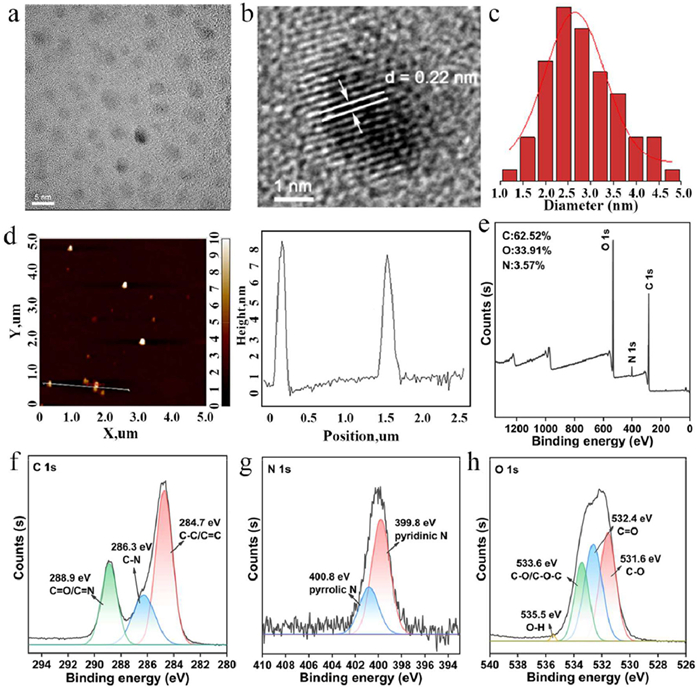
M-CDs were prepared by a straightforward one-pot hydrothermal reaction using MTX and CA as precursors. The morphology characterization by transmission electron microscopy (TEM) reveals the formation of well-dispersed nanoparticles with uniform spherical morphology, exhibiting an average diameter of 2.64 ± 0.07 nm (Figs. 1a–c). HRTEM analysis revealed distinct lattice fringes with a spacing of 0.22 nm (Fig. 1b), corresponding to the (100) plane of graphitic carbon [24]. The crystalline nature of M-CDs was further confirmed by fast Fourier transform (FFT) analysis (Fig. S1 in Supporting information). Additionally, atomic force microscopy (AFM) measurements indicated a particle height of ∼8 nm (Fig. 1d). X-ray photon spectroscopy (XPS) was employed to analyze the chemical compositions of the M-CDs. The survey XPS spectrum exhibits peaks at 294.34, 407.34 and 544.44 eV, corresponding to the presence of C 1s, N 1s, and O 1s elements (Fig. 1e). The high-resolution C 1s spectrum (Fig. 1f) exhibited peaks at 284.7, 286.3 and 288.9 eV, assigned to C—C/C═C, C—N, C═O/C═N, respectively. Correspondingly, the N 1s spectrum (Fig. 1g) displayed two peaks at 399.8 eV (pyridinic C3–N) and 400.8 eV (pyrrolic C2–N–H groups). Meanwhile, the O 1s spectrum (Fig. 1h) revealed four components at 531.6 eV (C—O), 532.4 eV (C═O), 533.6 eV (C—O/C—O-C) and 535.5 eV (O—H). These findings verify successful synthesis of M-CDs and preservation of precursor functional groups.
Fourier transformed infrared (FTIR) spectroscopy was employed to characterize the functional groups in M-CDs and MTX (Fig. 2a and Fig. S2 in Supporting information), where broad absorption at 3083 cm−1 is assigned to O—H stretching vibration and aromatic ═C—H stretching vibration. Furthermore, the presence of carboxyl groups (-COOH) is indicated by characteristic peaks at 1708 cm−1 (C═O stretch), the coupled C—O stretching/O—H in-plane bending vibrations at 1189 and 1403 cm−1. In addition, peaks at 1631 cm−1 (N—H in-plane bend) and 3484 cm−1 (N—H stretch) are characteristic of aromatic secondary amines. The peaks observed at 1029 cm−1 (C—N stretching vibration) and 834 cm−1 (N—H out-of-plane bending) correspond to a primary amide, confirming the presence of -NH2 groups. These functional groups originate from the precursor [31], which contains both -NH2 and -COOH. The results confirm the successful synthesis of M-CDs containing both -NH2 and -COOH functional groups, which contribute to the excellent aqueous dispersibility of the M-CDs. The UV–vis spectrum of M-CDs (Fig. 2b) exhibits two absorption peaks at 474 nm and 504 nm, which attributed to the n-π* transition of the carbon core, and surface states (C═N/C═O, C—O), respectively [32,33]. To gain further structural insights into M-CDs, 1H nuclear magnetic resonance (NMR) spectroscopy was performed (Fig. 2c). Deuterium-labeled DMSO–d6 (CD3SOCD3) was used as a solvent. The signals observed at δ 3.19–3.22 ppm (d, J = 1.1 Hz, 15H) and δ 3.39–3.47 ppm (m, 3H) may be attributed to hydrogen signals of amino or imine groups in MTX. These findings suggest the occurrence of esterification or amidation reactions during the synthesis process. The two signals δ 4.31–4.37 (dd, J = 5.4, 8.9, 4H) and δ 4.40–4.46 (dd, J = 8.1, 9.0, 4H) indicate that the resulting product may contain ester or amide groups and may be related to the structure of the carboxyl group of CA or the amino reaction of MTX. The signals at δ 5.68–5.73 ppm (d, J = 1.6 Hz, 5H) and δ 6.08–6.13 ppm (d, J = 1.7 Hz, 7H) suggest the presence of an aromatic ring, possibly derived from the benzene ring of MTX. These signals are consistent with aromatic ring signals in the reactants, suggesting that the aromatic ring portion of MTX is not completely lost and may remain in the product. δ 12.26–12.29 ppm (s, 3H) comes from the carboxyl hydrogen (-COOH) [34,35].
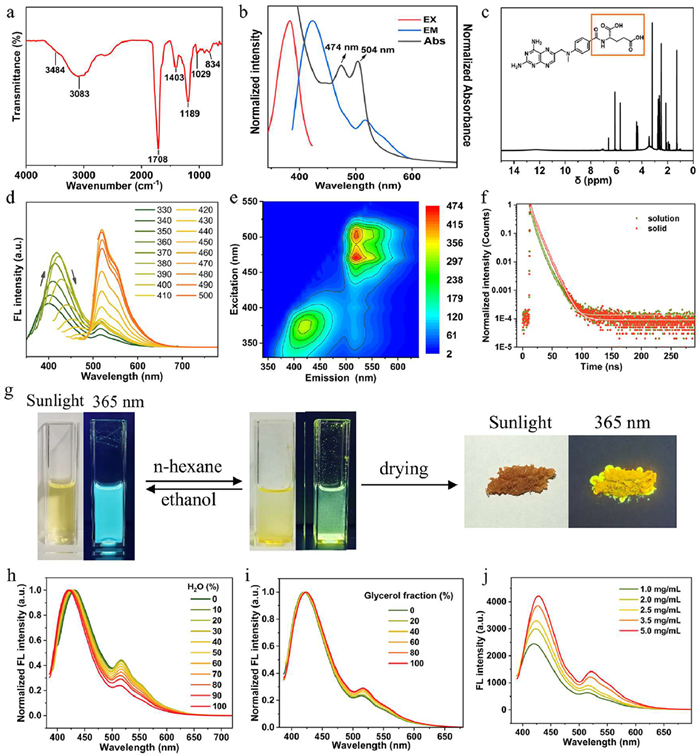
The fluorescence emission spectrum at the optimal excitation wavelength of 384 nm is presented in Fig. 2b. To further elucidate the photoluminescent (PL) properties of M-CDs, emission spectra were systematically acquired under different excitation wavelengths. As illustrated in Figs. 2d and e, the PL spectra of M-CDs exhibit a dual-band emission profile: (ⅰ) A broad, excitation-dependent blue emission band centered around 400 nm under λex = 330 nm, (ⅱ) a narrow, excitation-independent green emission band with a maximum at 520 nm, accompanied by a weaker shoulder peak at 550 nm. This distinct dual-emission behavior may be attributed to the presence of multiple surface defect states responsible for emission [36,37], which is consistent with most of the previously reported CDs [38,39]. Time-resolved photoluminescence measurements (Fig. 2f) demonstrated average lifetimes of 0.92 ns (aqueous solution) and 0.95 ns (solid state) for M-CDs when excited at 405 nm.
The solubility characteristics of M-CDs show a strong polarity dependence, being readily soluble in polar solvents but difficult to dissolve in non-polar solvents. As demonstrated in Fig. 2g, progressive addition of n-hexane to a clear M-CDs solution induces a phase transition from homogeneous solution to colloidal suspension. This process is accompanied by a diminishing blue fluorescence, followed by the appearance of a new yellow emission band. After purification and drying, the yielded M-CDs powder exhibited bright yellow solid-state fluorescence (SSF) under 365 nm UV excitation. To further investigate the solvent-dependent luminescence properties, we further examined the fluorescence behavior of M-CDs in water-DMSO mixed solvents at fixed concentration. As shown in Fig. 2h, increasing the DMSO fraction induces a red shift in the M-CDs' 425 nm emission peak while simultaneously enhancing fluorescence intensity at 516 nm. This behavior in water-DMSO mixtures arises from M-CDs aggregation in the poor solvent environment, indicating typical aggregation-induced emission (AIE) characteristics [40]. Furthermore, a highly viscous medium can restrict intramolecular motion (RIM) [41]. Consistent with this, the fluorescence (FL) emission of M-CDs measured in water-glycerol mixtures of varying proportions exhibits a similar phenomenon, as shown in Fig. 2i. Therefore, the RIM process is responsible for the observed AIE effect [42]. Furthermore, concentration-dependent studies further confirm the AIE characteristics, where significantly enhanced fluorescence emission intensity and absorption intensity are observed at higher concentrations (Fig. 2j and Fig. S3 in Supporting information). Quantum yield (QY) is a key indicator for evaluating imaging performance, and the QY of M-CD is 12.36%. Photographs of M-CDs aqueous solutions taken under sunlight and UV light reveal bright blue emission under UV irradiation (Fig. S4 in Supporting information). Additionally, blue fluorescence observed in A20 cells under 405 nm excitation confirms successfully cellular internalization M-CDs (Fig. S5 in Supporting information). To assess their bioimaging potential, we examined their fluorescence stability under continuous irradiation, varying pH conditions, ions aqueous solution, serum proteins, such as bovine serum albumin (BSA). As shown in Fig. S6 (Supporting information), M-CDs exhibited high photostability during prolonged light exposure. The fluorescence also remained stable across pH 4.0–7.0 (Fig. S7 in Supporting information), NaCl and KCl solution (Figs. S8 and S9 in Supporting information), which demonstrating excellent fluorescence stability for bioimaging applications. A systematic bathochromic shift (red shift) in both fluorescence excitation and emission wavelengths, along with a gradual decrease in fluorescence intensity, was observed with increasing BSA concentration (Figs. S10 and S11 in Supporting information). These spectroscopic changes are attributed to an interaction between the CDs and BSA [43].
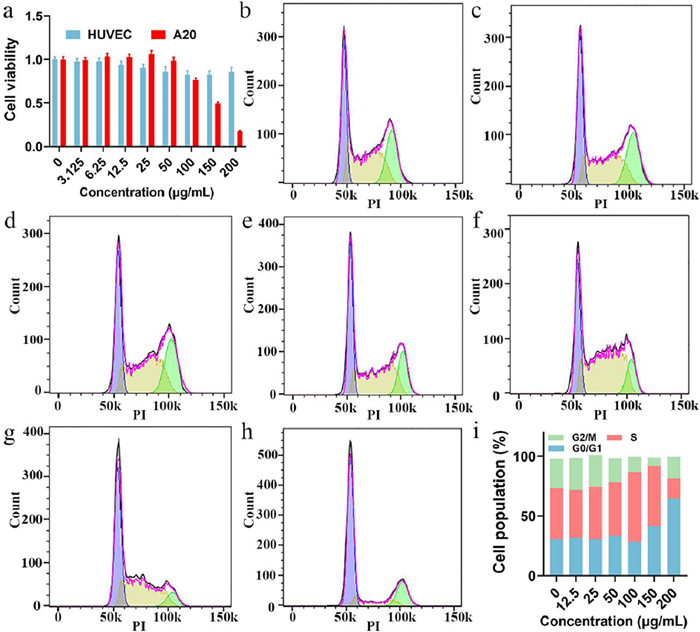
For biomedical applications, cytotoxicity and biosafety assessments of M-CDs are essential. Cell counting kit-8 (CCK8) assays were performed using A20 mouse B-cell lymphoma cells and human umbilical vein endothelial cells (HUVECs). As shown in Fig. 3a, M-CDs exhibited no apparent cytotoxicity toward either cell type at concentrations below 50 µg/mL. Notably, HUVECs maintained above 85% viability after 24 h incubation. In contrast, A20 cells showed concentration-dependent cytotoxicity, with viability decreasing from 100% to 17% at 200 µg/mL over 24 h. This selective cytotoxicity toward A20 cells over the normal HUVECs suggests potential therapeutic applications [9]. Cell cycle analysis was performed via flow cytometry by quantifying DNA content in G1, S, and G2/M phases [44]. In A20 cells treated with M-CDs (Figs. 3b–h), no considerable differences in cell cycle distribution were observed at concentrations below 50 µg/mL compared to control group. However, M-CDs with 100 µg/mL induced significant S-phase accumulation, with a higher percentage of cells in S-phase versus both control and lower-concentration groups. At higher concentrations (150–200 µg/mL), M-CDs promoted G1-phase arrest, demonstrating concentration-dependent cell cycle interference with potential therapeutic implications. Quantification of cell cycle phase distribution analysis is presented in Fig. 3i. Cell apoptosis was quantified using fluorescein isothiocyanate-labeled Annexin V/propidium iodide (Annexin V-FITC/PI) staining and flow cytometry. M-CDs induced minimal apoptosis in A20 cells, with no significant difference observed versus control group. Crucially, even at 200 µg/mL, M-CDs caused no substantial cell death after 24 h (Fig. S12 in Supporting information) or 48 h (Fig. S13 in Supporting information), confirming their superior biocompatibility.
For in vivo application, we evaluated the hemolysis of M-CDs first. The animals were performed in accordance with Sun Yat-sen University Institutional Animal Care and Use Committee guidelines (approval No. SYSU-IACUC-2022–001280). Notably, the M-CDs induced minimal hemolysis (<5%) even at 200 µg/mL, suggesting excellent biocompatibility (Fig. S14 in Supporting information). Next, biodistribution was assessed using an in vivo imaging system (Xenogen IVIS Spectrum, USA). Following intravenous injection of M-CDs, mice were sacrificed at designated time intervals and organs harvested for ex vivo imaging. As shown in Fig. 4a, M-CDs accumulated predominantly in major organs with minimal splenic and pulmonary uptake. Remarkably, tumor accumetration occurred within 2 h and strong fluorescence intensity of M-CDs persisted at 24 h, indicating effective tumor retention [45]. Fluorescence in the liver and kidneys gradually decreased by 12 h post-injection, consistent with systemic clearance of the CDs [46]. More importantly, strong M-CDs fluorescence in the brain demonstrates BBB penetration capability, establishing M-CDs as a promising multifunctional theranostic platform for brain diseases with significant clinical potential [25,44]. Quantitative biodistribution analysis is presented in Fig. 4b. Subsequently, the antitumor effect of M-CDs was evaluated in A20 tumor-bearing mice. Phosphate-buffered saline (PBS), MTX and M-CDs were administered into mice via tail vein injection, respectively. Tumor growth was monitored by digital vernier calipers, with relative tumor volume changes shown in Fig. 4c. The M-CDs treatment group (Group Ⅳ) demonstrated significant tumor growth suppression, whereas both Group Ⅰ (PBS) and Ⅱ (MTX) exhibited aggressive tumor growth over 12 days. After treatment, excised tumors were weighed 12 days post-treatment. As shown in Figs. 4d and e, M-CDs-treated mice (Group Ⅲ) demonstrated significantly lower tumor weights than PBS group, while Group Ⅳ showed enhanced therapeutic efficacy. The results of tumor weight were consistent with longitudinal tumor volume tracking data. The administration of highly toxic therapeutic interventions is often associated with adverse effects, such as weight loss. Notably, over the 12-day observation period, mice treated with M-CDs maintained relatively stable body weights, in sharp contrast to the marked reduction observed in the group administered with the MTX (Group Ⅱ) (Fig. 4f), which favorably demonstrates the superior safety profile of M-CDs and their potential to mitigate the adverse effects associated with MTX. Serum biochemical analysis (Fig. S15 in Supporting information) indicated that alanine transaminase (ALT), total bilirubin (TBIL), blood urea nitrogen (BUN) and creatinine (CREA) levels remained within normal ranges in all groups except Group Ⅱ. Notably, although Group Ⅱ showed slightly elevated values compared to other groups, all measured parameters remained within clinically acceptable limits, indicating no evidence of hepatic or renal dysfunction.
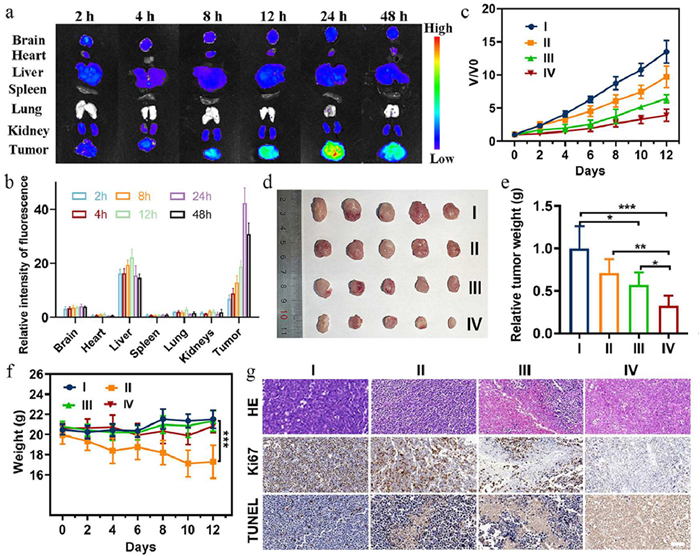
Additionally, tumor tissues were harvested for hematoxylin and eosin (HE), terminal deoxynucleotidyl transferase dUTP nick-end labeling (TUNEL), and immunohistochemical (IHC) staining. HE staining (Fig. 4g) reveals massive tumor cell necrosis in Group Ⅳ, whereas control tumors maintained structural integrity. As can be seen in Fig. 4g, Group Ⅳ also exhibited a significantly higher density of TUNEL-positive cells (estimating by DNA fragmentation) indicating the proliferation of A20 cells was inhibited. The further IHC staining by Ki-67 (marking a proliferation biomarker) in the M-CDs treated group profoundly verified that cell proliferation was inhibited. These findings establish an essential safety foundation for M-CDs-based nanomaterials in biomedical applications, highlighting their clinical advantage over conventional MTX therapy in translational considerations. After the treatment, H&E-stained sections of major organs (heart, liver, spleen, lung, kidneys and brain) were histopathologically evaluated. No significant tissue damage or inflammatory infiltration was observed (Fig. S16 in Supporting information).
In summary, we have successfully developed M-CDs via a one-step hydrothermal method. The M-CDs function as an integrated theranostic platform, which merging diagnostic capability (inherent fluorescence) with therapeutic function (preserved antitumor efficacy). Notably, they overcome a key limitation of the parent drug by exhibiting distinct BBB permeability. Meanwhile, it has been proved that M-CDs have superior biocompatibility in vitro and in vivo. Altogether, our work underscores the potential of drug-derived CDs in advancing precision oncology.
Haolin Chen: Writing – review & editing, Writing – original draft, Funding acquisition, Conceptualization. Jieyi Chen: Methodology, Investigation, Data curation, Conceptualization. Xiaoyan Liu: Methodology, Formal analysis, Conceptualization. Yinglin Xu: Methodology, Formal analysis, Data curation. Hengyu Liu: Resources, Conceptualization. Bo Xu: Writing – review & editing, Supervision, Funding acquisition. Dongjun Lin: Writing – review & editing, Validation, Supervision, Resources, Project administration, Conceptualization. Jun Wu: Writing – review & editing, Writing – original draft, Visualization, Validation, Supervision, Project administration, Formal analysis, Data curation, Conceptualization.
The authors declare that they have no known competing financial interests or personal relationships that could have appeared to influence the work reported in this paper.
This work was supported by the National Natural Science Foundation of China (Nos. 82472110 and U22A20315), Key Area Research and Development Program of Guangdong Province of China (No. 2021B0101410005), China Postdoctoral Science Foundation (No. 2022M713587), Guangzhou Science and Technology Program City-University Joint Funding (No. 2024A03J0604), the Science and Technology Program of Guangzhou (Nos. 2024A03J0698 and 2024A04J4558).
Supplementary material associated with this article can be found, in the online version, at doi:
S. Huang, Y. Song, J. Zhang, et al., Small 19 (2023) e2207385. doi: 10.1002/smll.202207385
L. Ðorđević, F. Arcudi, M. Cacioppo, et al., Nat. Nanotechnol. 17 (2022) 112–130. doi: 10.1038/s41565-021-01051-7
Y.P. Liu, H. Wang, S.N. Qu, Chin. Chem. Lett. 36 (2025) 110618. doi: 10.1016/j.cclet.2024.110618
B. Tian, S. Liu, L. Feng, et al., Adv. Funct. Mater. 31 (2021) 2100549. doi: 10.1002/adfm.202100549
X.Y. Du, C.F. Wang, G. Wu, et al., Angew. Chem. Int. Ed. 60 (2021) 8585–8595. doi: 10.1002/anie.202004109
M.Y. Fang, B.Y. Wang, X.L. Qu, et al., Chin. Chem. Lett. 35 (2024) 108423. doi: 10.1016/j.cclet.2023.108423
J. Liu, R. Li, B. Yang, ACS Cent. Sci. 6 (2020) 2179–2195. doi: 10.1021/acscentsci.0c01306
Q. Zong, H. Chen, Y. Zhao, et al., Smart Mater. Med. 5 (2024) 1–14.
H. Liu, L. Mo, H. Chen, et al., Adv. Healthc. Mater. 11 (2022) e2101448. doi: 10.1002/adhm.202101448
X. Xu, K. Zhang, L. Zhao, et al., ACS Appl. Mater. Interfaces 8 (2016) 32706–32716. doi: 10.1021/acsami.6b12252
D.B. Gunjal, Y.M. Gurav, A.H. Gore, et al., Opt. Mater. 98 (2019) 109484. doi: 10.1016/j.optmat.2019.109484
J. Zhou, C. Booker, R. Li, et al., J. Am. Chem. Soc. 129 (2007) 744–745. doi: 10.1021/ja0669070
X. Li, H. Wang, Y. Shimizu, et al., Chem. Commun. 47 (2011) 932–934. doi: 10.1039/C0CC03552A
V.N. Mehta, S. Jha, H. Basu, et al., Sensor Actuat. B: Chem. 213 (2015) 434–443. doi: 10.1016/j.snb.2015.02.104
F. Fu, X. Pan, R. Huang, et al., ACS Appl. Bio Mater. 5 (2022) 1604–1609. doi: 10.1021/acsabm.2c00016
L. Wang, H.S. Zhou, Anal. Chem. 86 (2014) 8902–8905. doi: 10.1021/ac502646x
S. Mandani, D. Dey, B. Sharma, et al., Carbon 119 (2017) 569–572. doi: 10.1016/j.carbon.2017.04.075
C. Shen, T. Jiang, Q. Lou, et al., SmartMat 3 (2022) 269–285. doi: 10.1002/smm2.1099
Y.Q. Chen, A. Liu, B.W. Yang, et al., Chin. Chem. Lett. 35 (2024) 109295. doi: 10.1016/j.cclet.2023.109295
Z. Qu, L. Liu, T. Sun, et al., Nanotechnology 31 (2020) 175102. doi: 10.1088/1361-6528/ab6b9d
H. Zhang, H. Liu, X. Liu, et al., Adv. Healthc. Mater. 14 (2025) e2402285. doi: 10.1002/adhm.202402285
J. Wei, K. Wang, Y. Li, et al., Bioact. Mater. 53 (2025) 459–479.
X. Zhang, Q. Yu, P. Zhou, et al., Biomater. Adv. 139 (2022) 212995. doi: 10.1016/j.bioadv.2022.212995
Y. Han, F. Zhang, J. Zhang, et al., Colloid Surface. B 179 (2019) 1–8.
M. Ashrafizadeh, R. Mohammadinejad, S.K. Kailasa, et al., Adv. Colloid. Interface Sci. 278 (2020) 102123. doi: 10.1016/j.cis.2020.102123
H. Kong, Y. Zhao, Y. Zhu, et al., Artif. Cells Nanomed. Biotechnol. 49 (2021) 11–19. doi: 10.1080/21691401.2020.1862134
S. Wang, Y. Zhang, H. Kong, et al., Nanomedicine 14 (2019) 2925–2939. doi: 10.2217/nnm-2019-0255
Z. Sun, F. Lu, J. Cheng, et al., Artif. Cells Nanomed. Biotechnol. 46 (2018) S308–S317. doi: 10.1080/21691401.2018.1492419
M. Zhang, J. Cheng, Z. Sun, et al., Nanoscale Res. Lett. 14 (2019) 377. doi: 10.1186/s11671-019-3198-1
G. Illerhaus, E. Schorb, B. Kasenda, Blood 132 (2018) 681–688. doi: 10.1182/blood-2018-01-791558
C. Ren, X. Hao, L. Wang, et al., Adv. Healthc. Mater. 10 (2021) e2100196. doi: 10.1002/adhm.202100196
L. Jiang, H. Ding, M. Xu, et al., Small 16 (2020) 2000680. doi: 10.1002/smll.202000680
H. Yang, Y. Liu, Z. Guo, et al., Nat. Commun. 10 (2019) 1789. doi: 10.1038/s41467-019-09830-6
O.M. Semenenko, V.V. Lipson, A.O. Sadchenko, et al., Steroids 201 (2024) 109332. doi: 10.1016/j.steroids.2023.109332
A.M. Dos Santos, R.B. Liszbinski, S.G. Carvalho, et al., Int. J. Biol. Macromol. 287 (2025) 138342. doi: 10.1016/j.ijbiomac.2024.138342
Y. Chen, M. Cheng, C. Lai, et al., Small 19 (2023) e2205902. doi: 10.1002/smll.202205902
G. Minervini, A. Panniello, A. Madonia, et al., Carbon 198 (2022) 230–243. doi: 10.1016/j.carbon.2022.07.034
J.X. Pei, H.F. Li, F.Y. Chen, et al., ACS Appl. Mater. Interfaces 16 (2024) 60819–60827. doi: 10.1021/acsami.4c12408
J. Shao, S. Zhu, H. Liu, et al., Adv. Sci. 4 (2017) 1700395. doi: 10.1002/advs.201700395
Y.J. Wang, J.Y. Nie, W. Fang, et al., Chem. Rev. 120 (2020) 4534–4577. doi: 10.1021/acs.chemrev.9b00814
S. Lin, M.Y. Chen, Z.W. Wang, et al., Chem. Eng. J. 324 (2017) 194–202. doi: 10.1016/j.cej.2017.05.035
C.J. Yu, Z.L. Huang, W. Gu, et al., Mater. Chem. Front. 3 (2019) 1823–1832. doi: 10.1039/c9qm00154a
F. Zu, F. Yan, Z. Bai, et al., Microchim. Acta 184 (2017) 1899–1914. doi: 10.1007/s00604-017-2318-9
M. Zheng, S. Ruan, S. Liu, et al., ACS Nano 9 (2015) 11455–11461. doi: 10.1021/acsnano.5b05575
Y. Hu, L. Zhang, S. Chen, et al., Nanoscale Adv. 3 (2021) 6869–6875. doi: 10.1039/d1na00595b
J. Liu, D. Li, K. Zhang, et al., Small 14 (2018) e1703919. doi: 10.1002/smll.201703919

Scheme 1 Schematic representation of the synthesis process and biomedical application of M-CDs.

Figure 1 Comprehensive characterization of M-CDs. (a) TEM (scale bar: 5 nm) and (b) high-resolution TEM (HRTEM) (scale bar: 1 nm) images of the M-CDs. (c) Size distribution histogram of M-CDs obtained from statistical analysis of 100 nanoparticles in TEM images. (d) Left: 2D AFM topography image of M-CDs (scale bar: 200 nm); Right: Corresponding height profiles along the marked white lines. (e) XPS survey spectrum of M-CDs, with high-resolution spectra of (f) C 1s, (g) N 1s, and (h) O 1s.

Figure 2 (a) FTIR spectrum of M-CDs. (b) UV–vis absorption and fluorescence spectra (excitation/emission) of M-CDs. (c) 1H NMR spectrum of the M-CDs in DMSO–d6. (d) Excitation wavelength-dependent fluorescence emission profiles of M-CDs. (e) 3D fluorescence excitation-emission matrix of M-CDs. (f) Fluorescence decay lifetime curves of M-CDs in aqueous solution and solid state. (g) Photographs illustrating the dual-switch luminescence principle behavior of M-CDs. (h) FL emission spectra of M-CDs in DMSO-water mixtures with increasing water fraction. (i) Glycerol concentration-dependent FL emission spectra of M-CDs aqueous (Ex = 384 nm). (j) Fluorescence emission profiles of M-CDs aqueous solutions at concentrations ranging from 1.0 mg/mL to 5.0 mg/mL (Ex = 384 nm).

Figure 3 (a) Relative viabilities of A20 and HUVECs after 24 h incubation with M-CDs (0, 3.125, 6.25, 12.5, 25, 50, 100, 150, 200 µg/mL). Cell cycle distributions of A20 cells treated with M-CDs at (b) 0 µg/mL (control), (c) 12.5, (d) 25, (e) 50, (f) 100, (g) 150, (h) 200 µg/mL. (i) Quantification of cell cycle phase distribution.

Figure 4 In vivo biodistribution and antitumor efficacy of M-CDs: (a) Fluorescence images of organs (heart, liver, spleen, lung, kidney, brain) and tumors at various time points. (b) Quantitative fluorescence intensity in excised tissues. (c) Growth curves of A20 tumors in differently treated groups (Ⅰ: control, Ⅱ: MTX, Ⅲ: M-CDs 5 mg/kg, Ⅳ: M-CDs 20 mg/kg). (d) Excised tumors from each group at study endpoint (day 12). (e) Relative tumor weights normalized to control group. (f) Mean body weights dynamics during treatment period. (g) Representative HE, IHC and TUNEL-stained of tumor sections images (scale bar: 100 µm). Data are presented as mean ± standard deviation (SD) (n = 5). *P < 0.05, **P < 0.01, ***P < 0.001.

 扫一扫看文章


扫一扫关注我们
 DownLoad:
 下载:
 下载: