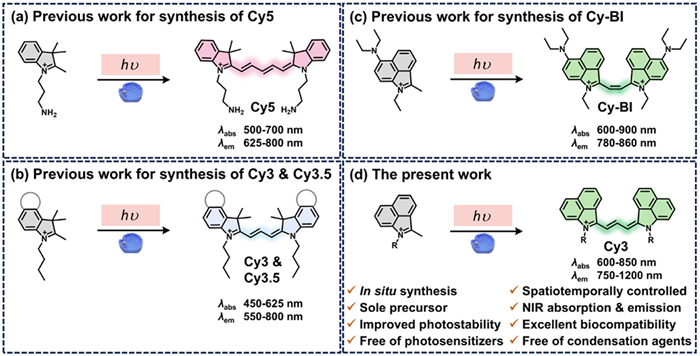
Figure 1.
Previous work for in-cell synthesis of Cy5 (a), Cy3 and Cy3.5 (b), and Cy-BI (c). (d) The present work for in-cell synthesis of NIR Cy3 dyes.

Photoactivatable in-cell synthesis of near infrared trimethine cyanines using benzo[cd]indolium derivatives for imaging mitochondria
Hao Heng , Pengyu Xu , Zhaobin Wang , Xianhe Ou , Jiajin Chen , Yu Chen , Yuning Xia , Fude Feng


Polymethine cyanines have attracted great interest in cell imaging, disease diagnostics, chemo-/bio- sensing and detection [1-4]. Owing to the decent optical characteristic, polymethine cyanines possess outstanding advantages, including high molar extinction coefficients, tunable spectral ranges and excellent biocompatibility [5,6]. However, traditional cyanine synthetic strategy usually uses condensation conditions which suffer from harsh conditions [2,7,8]. Light-induced reaction, as a gentle, green and efficient synthetic methodology, has garnered significant attention in recent years [9-12]. The light-induced synthesis of cyanine dyes not only proceeds under mild reaction conditions but also holds great potential for remote-controlled dyes fabrication, expanding the application scope of cyanine dyes, particularly for the in-cell synthesis of cyanines [13,14]. Photoactive cyanine dyes are a class of smart probes whose fluorescence switching or spectral changes can be controlled by external or internal stimuli (e.g., light, enzymes, pH, reactive oxygen species) [15-17]. The synthesis and application of such smart dyes offer significant advantages in bioimaging, precision diagnostics, and multimodal analysis [18-21].
The visible light-induced synthesis of cyanine dyes can be achieved through two opposite strategies: Photo-extension and photo-truncation strategy [13,14,22,23]. Photo-extension strategy, as a de novo synthesis approach driven primarily by H atom-transfer and radical-radical coupling processes, exhibits distinct advantages such as low cost, easy availability of precursors and low light requirement. This methodology offers particular promise for applications requiring precise structural control while maintaining synthetic accessibility and operational flexibility. The photo-extension strategy was successfully applied to in-organelle synthesis of trimethine cyanines (Cy3) and pentamethine cyanines (Cy5) via pseudo-trimerization of 2,3,3-trimethyl-3H-indolium derivatives (Figs. 1a and b) [13,14], while with limitation in the excitation wavelength of cyanine products shorter than 700 nm. In a recent report by Zhang et al., a diethylamino-modified benzo[cd]indolium derivative was found to form a photodimerized product (Cy-BI) in HeLa cells with both absorption and emission spectra located into the first near infrared (NIR-Ⅰ) window (Fig. 1c) [24]. NIR cyanines, particularly in the second NIR (NIR-Ⅱ) window [25-27], can effectively enhance tissue penetration, circumventing self-luminescence of biological tissues and improving spatial resolution with increased signal-to-noise ratio [28-32]. Although the Food and Drug Administration (FDA)-approved indocyanine green (ICG) are widely used for its excellent photophysical properties, its photochemical instability impedes extensive applications [33-35]. Therefore, the in-cell synthesis of cyanine dyes which can be activated remotely and share similar photophysical characteristics to ICG but with enhanced photostability is of great significance. Extending the π-conjugation of the indole moiety via molecular ring-fusion would facilitate a red-shift in the maximum absorption [36,37].
Herein, we report one-pot light-induced synthesis of NIR Cy3 dyes without the use of photosensitizers, metals or condensation agents (Fig. 1d). Three benzo[cd]indolium derivatives (termed PreCy) bearing different N-alkyl substituents were used as the precursors in the presence of triethylamine under white LED light irradiation. Notably, as compare to ICG [38-40], the synthesized Cy3 dyes display promising photophysical properties and improved stability. Besides, molecular full minimization, density functional theory (DFT) and time dependent density functional theory (TD-DFT) calculations were performed to determine the molecular conformation, energy gaps and maximum absorption wavelength [41-43]. Cell imaging results revealed that the imaging performance was dependent on the N-substituents of benzo[cd]indole and the optimal Cy3 products were highly emissive in the mitochondria at low concentrations (0.02–0.1 µmol/L). Furthermore, synthesis of NIR Cy3 dyes in the living cells was successful under visible light irradiation using the non-fluorescent PreCy as the exogenous substrate. PreCy could be potentially applied in spatiotemporal resolution imaging studies via in-cell conversion to bright NIR Cy3 dyes.
Three PreCy molecules with different N-alkyl substituents including methyl, propyl and 3-hydroxypropyl groups (Fig. 2a) were prepared in two steps (Scheme S1 in Supporting information) [44]: Benzo[cd]indol-2(1H)-one reacted with iodo compounds in the presence of potassium hydroxide to give N-alkylated benzo[cd]indol-2(1H)-one, followed by Grignard reaction using methylmagnesium bromide. The intermediates and PreCy molecules were characterized by proton nuclear magnetic resonance (1H NMR).
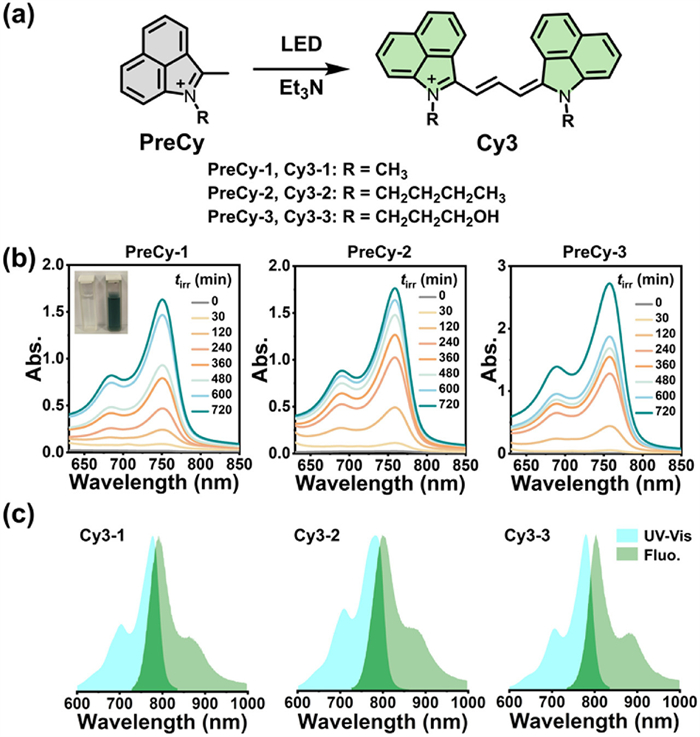
Ultraviolet-visible (UV-vis) and fluorescence spectra were used to monitor the light-induced reaction progress. The production of Cy3 dyes was strongly dependent on the time of light exposure and the colorless reaction mixture containing PreCy-1 (33.3 mmol/L) and Et3N (66.6 mmol/L) in methanol turned dark green upon light exposure in the presence of Et3N (Fig. 2b and Fig. S1 in Supporting information). Prior to light exposure, minimal absorption was observed in 600–800 nm. When the reaction mixture was exposed to white LED light (10 mW/cm2) at 65 ℃, absorption bands with a maximum at 750 nm and a pronounced shoulder at 686 nm appeared, consistent with the formation of cyanine product (Cy3-1). The absorption intensity at 750 nm (A750) showed a time-dependent enhancement under continuous photoirradiation, reaching a plateau after 12-h illumination. Similar to PreCy-1, PreCy-2 and PreCy-3 were also photoactivatable to generate NIR products that were detected by UV-vis absorption and fluorescence spectra (Fig. 2b and Fig. S1). The normalized UV-vis absorption and fluorescence spectra in chloroform (Fig. 2c) showed that both absorption and emission maxima assigned to Cy3-1 ~ Cy3-3 were located in the NIR window (750–1000 nm). Notably, the cyanine dye demonstrates detectable emission extending into the NIR-Ⅱ region (1000–1200 nm). Relative to Cy3 in chloroform, the fluorescence spectra of Cy3-1, Cy3-2, and Cy3-3 in aqueous solution displayed maximum emissions at 764, 777, and 765 nm, respectively, with spectral profiles extending to 1200 nm (Fig. S2 in Supporting information), indicating its promising potential for NIR-Ⅱ bioimaging applications. To characterize the photophysical properties of the synthesized Cy3, we measured the fluorescence quantum yields (Φ) and molar extinction coefficient (ε). The Φs of Cy3-1, Cy3-2 and Cy3-3 in dimethyl sulfoxide were determined to be 0.50%, 0.61% and 0.53%, respectively, using ICG in DMSO (Φ = 13% [45]) as the standard. The corresponding molar absorptivity values in methanol were 1.03 × 10⁵, 1.65 × 10⁵ and 1.93 × 10⁵ L mol−1 cm−1, respectively.
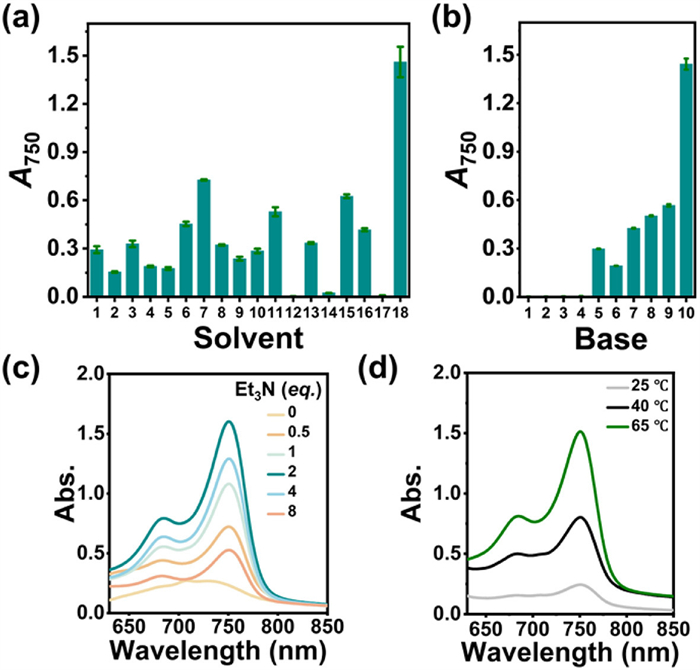
To optimize the reaction conditions, we investigated the impacts of solvent, base and temperature. The reaction was efficient in methanol, tetrahydrofuran (THF), isopropanol, chloroform, ethyl acetate and dichloromethane, less efficient in deionized water, N,N-dimethylformamide (DMF), 1,4-dioxane, N,N-dimethylacetamide, dimethyl sulfoxide (DMSO), pyridine, acetone, toluene and ethanol, while inefficient in tBuOMe, acetonitrile and Et3N (Fig. 3a). During our screening of bases, the results indicated that inorganic bases (e.g., KOH, NaOH, K2CO3, Na2CO3, NaHCO3, NH3·H2O) were not effective in the conversion of cyanine dyes, while organic bases such as pyridine, N,N-diisopropylethylamine (DIPEA), N-methylpiperazine, and Et3N demonstrated better performance. Notably, Et3N displayed the superior efficiency (Fig. 3b), particularly when applied at 1, 2, and 4 equiv. (Fig. 3c). The conversion efficiency of Cy3 dyes was gradually enhanced with increasing temperature from 25 ℃ to 40 and 65 ℃ (Fig. 3d). Through systematic optimization, the photoreaction proceeded most efficiently in methanol at 65 ℃ with 2 equiv. of Et3N. Cy3-2 and Cy3-3 were prepared in the same manner. As a result, Cy3-1, Cy3-2 and Cy3-3 were isolated and characterized by NMR and high-resolution mass spectra (HRMS).
With photoconversion of PreCy-1 to Cy3-1 as the example, we deduced free radicals participated in this reaction. First, the addition of 10 equiv. of the radical trapping agents 5,5-dimethyl-1-pyrroline N-oxide (DMPO) or 2,2,6,6-tetramethylpiperidine-1-oxyl (TEMPO) inhibited the reaction and reduced the yield by a factor of 66% and 86%, respectively (Fig. S3a in Supporting information). Conclusive confirmation was provided by HRMS, which detected a PreCy-1-TEMPO adduct at an m/z of 337.2273 (Fig. S3b in Supporting information). Accordingly, we propose a plausible mechanism that primarily involves hydrogen atom transfer (HAT) initiation and subsequent radical recombination to form the cyanine product (Fig. S4 in Supporting information).
Concerning the photostability is an important parameter of fluorescent probes, particularly in molecularly dispersed state, we investigated the photostability of Cy3-1 ~ Cy3-3 with ICG as a reference in DMSO. The difference was remarkable. ICG underwent nearly 75% photobleaching within initial 15 min irradiation (λ = 808 nm, 300 mW/cm2), while the synthesized Cy3 were slightly degraded by approximately 3% (Fig. S5 in Supporting information). After 30 min-illumination, over 95% of ICG was photobleached, while the loss of synthesized cyanine products was only approximately 5%. After 1 h of light exposure, ICG was almost completely decomposed, whereas more than 90% of the synthesized cyanine dyes remained intact, which demonstrated greatly enhanced resistance to photodegradation.
To better understand the conformation and photophysical properties of Cy3-1 ~ Cy3-3, molecular full minimization, DFT and TD-DFT calculations were performed (Fig. 4). Molecular full minimization aims to investigate the stable conformation [46,47]. DFT and TD-DFT calculations [48,49] were used to investigate the ground-state and excited-state properties of Cy3 dyes (Fig. 4a). These studies aimed to elucidate key electronic and structural characteristics, including ground-state optimization, frontier orbital analysis and simulation of excitation spectra.
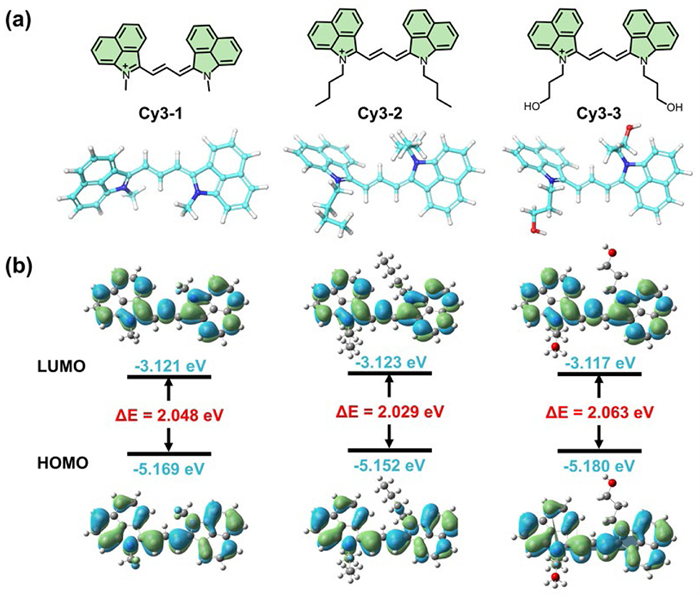
Full minimization calculations were performed using Discovery Studio software under Merck Molecular Force Field. The initial conformation of Cy3-1 exhibited a total potential energy of 179.3 kcal/mol with a root-mean-square (RMS) gradient of 16.7 kcal mol−1 Å−1, indicating poor convergence. After optimization, the total potential energy decreased to 148.6 kcal/mol, with an RMS gradient of 0.00974 kcal mol−1 Å−1, confirming convergence to a stable conformation. Cy3-2 (initial: 178.8 kcal/mol, 14.3 kcal mol−1 Å−1) and Cy3-3 (initial: 185.9 kcal/mol, 14.6 kcal mol−1 Å−1) were optimized at the same manner. The minimized structures showed significantly improved potential energies of 145.3 and 142.4 kcal/mol with RMS gradients of 0.00944 and 0.00875 kcal mol−1 Å−1, respectively (Table S1 in Supporting information). The optimized structure revealed that the side chain attached to the nitrogen atom in the cyanines adopt a trans configuration (Fig. 4a), as extended side chains cause steric hindrance and destabilize the molecules.
Geometric optimization and frequency analysis were conducted using Gaussian software package at the b3lyp/6-31g (d, p) level to further validate the molecular conformation. The optimized structure agreed well with the Discovery Studio results. The calculated highest occupied molecular orbital-lowest unoccupied molecular orbital (HOMO-LUMO) band gaps of Cy3-1, Cy3-2 and Cy3-3 were 2.048, 2.029 and 2.063 eV, respectively (Fig. 4b). These narrow band gap values suggest enhanced electronic excitability of these cyanines. The relatively small energy separation between frontier molecular orbitals facilitates efficient light absorption in the visible to NIR range, making these dyes particularly suitable for fluorescence imaging. TD-DFT calculations revealed that the pure BP86 functional yields a relatively low mean absolute error for excitation energies [50]. Therefore, BP86 functional was performed to describe the excited state characteristics. The energy gaps between S1 and T1 states (ΔEst1) of Cy3-1, Cy3-2 and Cy3-3 were 0.8356, 0.8319 and 0.8276 eV, respectively. The energy gaps between S1 and T2 states (ΔEst2) of Cy3-1, Cy3-2 and Cy3-3 were −0.1432, −0.1447 and −0.1624 eV, respectively, indicating that replacing the N-methyl group with butyl or hydroxypropyl substituents has negligible influence on the ΔEst1 and ΔEst2 of cyanines (Figs. S6–S8 in Supporting information). A larger ΔEst1 inhibits the intersystem crossing (ISC) process, promoting the cyanine dyes to primarily undergo fluorescence decay, thereby exhibiting strong fluorescence emission characteristics, which makes them suitable as fluorescent probes. The theoretical calculations also reveal that negative ΔEst2 values correspond to inhibited ISC processes, leading to predominant fluorescence emission characteristics. The predicted maximum absorption wavelengths (λabs) of Cy3-1, Cy3-2 and Cy3-3 were 708, 711, and 719 nm, respectively. These results align closely with the experimental data (λabs of Cy3-1, Cy3-2 and Cy3-3 in methanol were 750, 759, and 757 nm, respectively), demonstrating the reliability of the computational approach.
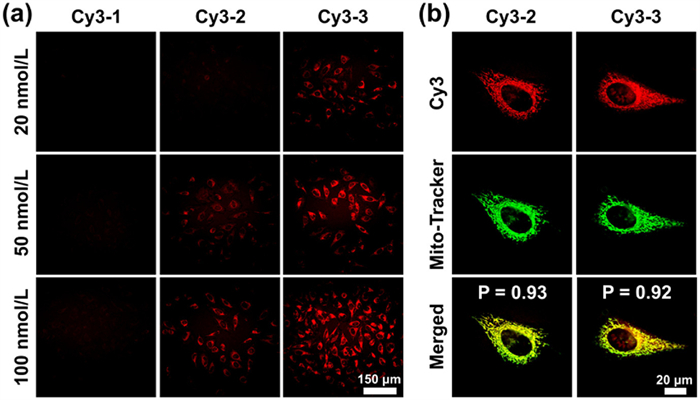
For the Cy3 in living cells, we evaluated the cytotoxicity of synthesized Cy3 in HeLa cells via MTT assay. The results demonstrated excellent biocompatibility of the synthesized Cy3 with cells maintaining high viability at concentrations up to 10 µmol/L (Figs. S9–S11 in Supporting information). To assess the cellular imaging potential of synthesized Cy3, we employed confocal laser scanning microscopy (CLSM) to image HeLa cells after 30-min incubation with various concentrations (20–100 nmol/L) of Cy3. The excitation wavelength was 780 nm. The fluorescence intensity exhibits a concentration-dependent manner (Fig. 5a). Among three synthesized cyanines, Cy3-3 exhibited superior imaging performance. Notably, a discernible fluorescence signal was still observed even at 20 nmol/L. Colocalization studies were carried out on HeLa cells to validate the subcellular localization, using a commercially available mitochondrial green fluorescent probe. Given that the suboptimal fluorescence imaging characteristics of Cy3-1 at low concentrations, subsequent experiments focused exclusively on Cy3-2 and Cy3-3. Colocalization analysis revealed that both synthesized cyanine dyes localized specifically in mitochondria with high Pearson’s colocalization coefficients (Cy3-2: 0.93, Cy3-3: 0.92). Notably, the 50 nmol/L working concentration represented a 2-fold reduction compared to conventional mitochondrial probes (typically requiring 100 nmol/L) (Fig. 5b). These findings indicate that the synthesized cyanines display efficient intracellular accumulation capability and are highly emissive in mitochondria.
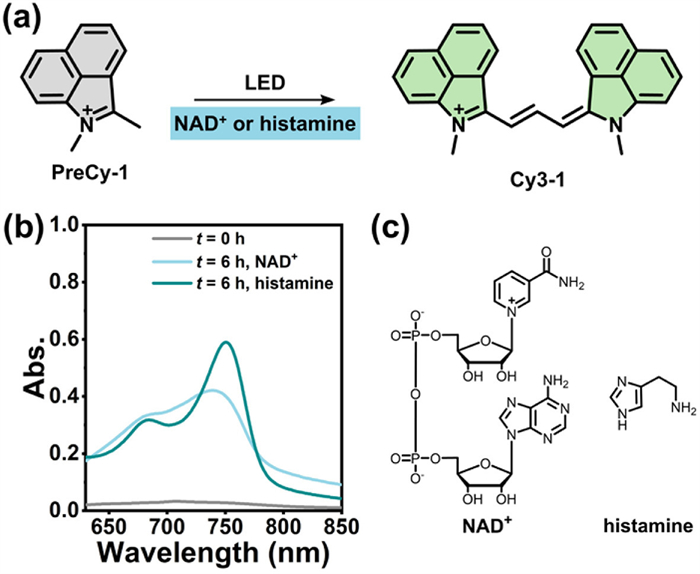
Prior to PreCy-based cell imaging, the cytotoxicity of the PreCy was assessed in HeLa cells using an MTT assay. As shown in Figs. S12–S17 (Supporting information), PreCy compounds with or without light exposure are safe for cells across a concentration range of 0–100 µmol/L. In contrast to the flask reaction, the in-cell synthesis of NIR cyanines can occur without the use of trimethylamine, likely mediated by endogenous species (e.g., NAD⁺, histamine) (Fig. 6).
Beyond conventional imaging with pre-synthesized cyanine dyes, we implemented a PreCy-based approach to gain deeper insights into intracellular NIR Cy3 formation in the living cells (Fig. 7a). Time-dependent fluorescence amplification was observed after HeLa cells were incubated with PreCy (20 µmol/L) for 1 h and received white LED light irradiation for 0–30 min (Fig. 7b), which demonstrated the in situ formation of NIR Cy3 in the living cells.
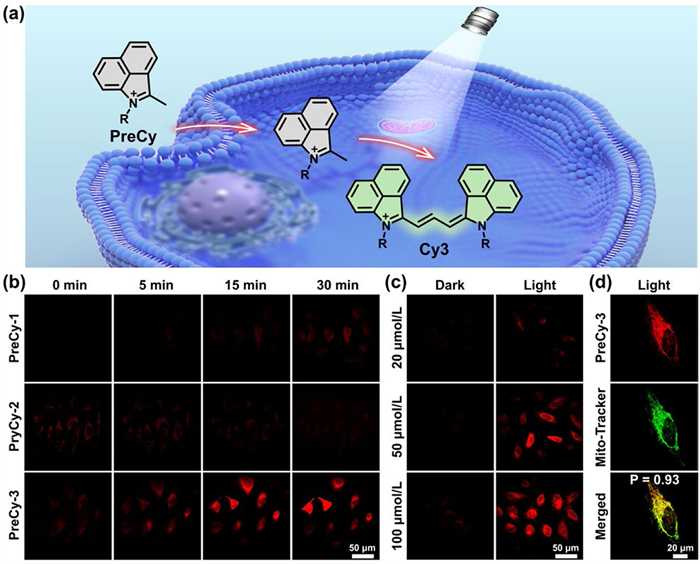
Among three PreCy, PreCy-3 exhibited the best imaging performance, likely due to the superior fluorescence property of Cy3-3. To elucidate the role of light irradiation in the in-cell synthesis of cyanines, we employed PreCy-3 as a model to examine the intracellular synthesis. Fluorescence analysis revealed a striking contrast between different experimental conditions. In the absence of light irradiation, the fluorescence was negligible inside HeLa cells, whereas light-irradiation cells demonstrated pronounced fluorescence signals. Notably, the intracellular fluorescence intensity exhibited a concentration-dependent enhancement with increasing PreCy-3 incubation concentrations (Fig. 7c). We performed colocalization experiment to investigate the spatial distribution of the in situ synthesized Cy3 in the living cells. The results demonstrated that the generated cyanines were selectively localized in mitochondria (Pearson’s correlation coefficient: 0.93) (Fig. 7d), which was attributed to the mitochondria-targeting capability of cationic indolium precursors [14].
To date, the in-cell synthesis of cyanine dyes remains in its infancy. In the present study, NIR Cy3 (λabs and λem > 700 nm) can be synthesized through photoactivation strategy under mild conditions using benzo[cd]indolium derivatives as precursors. Reliable calculations predict the conformation, ground state and excited-state dynamics and maximum absorption of cyanine products. Cell imaging data reveal that the cyanine products, particularly Cy3-3, selectively light up mitochondria at a very low dose up to 20 nmol/L. Interestingly, the N-substituent (i.e., side chain) attached on the benzo[cd]indolium ring plays a crucial role in the imaging performance of both PreCy and cyanine products, which suggests that tailoring the structures of side chain is an effective method to modulate the fluorescence behavior of cyanine products in mitochondria. Importantly, the cyanine products manifest distinct emissive properties traversing the NIR-Ⅰ/NIR-Ⅱ boundary, which paves a way for spatiotemporally-controlled imaging spanning both NIR-Ⅰ and NIR-Ⅱ biological imaging regions based on the in-cell synthetic method.
Despite analogous reaction conditions compared to previous reported Cy-BI by Zhang et al. [24], the synthesized NIR Cy3 in this work reveals the versatility of this photoactivation reaction system, expands the scope and synthetic utility. While Cy3 are suitable for NIR cellular imaging, its efficacy for in vivo imaging is still under exploration. The future development of PreCy-based in vivo imaging depends on addressing the following requirements: (1) Appropriate hydrophilicity-lipophilicity balance: Effective in vivo delivery and cellular uptake necessitate a precursor with balanced hydrophilicity and lipophilicity. (2) High targeting capability: The precursors are expected to be efficiently accumulate at the target site. (3) High biocompatibility and low toxicity: The precursors are bio-friendly without inducing immune responses or interfering with normal biological processes. (4) Specific and controllable activation: The activation can be triggered by a specific endogenous or external stimulus (i.e., light, enzyme) with deep understanding of the response mechanism. (5) Rapid reaction kinetics: The transformation rate should be sufficiently fast to achieve efficient conversion within the in vivo environment. (6) Ideal photophysical properties: Emission in the first or second NIR window is highly desirable to enable deeper tissue penetration and minimize the background autofluorescence. Meeting these requirements will allow for real-time, dynamic monitoring of biological processes with an ultra-high signal-to-noise ratio.
Hao Heng: Writing – review & editing, Writing – original draft, Methodology, Investigation, Formal analysis, Data curation, Conceptualization. Pengyu Xu: Methodology, Formal analysis. Zhaobin Wang: Methodology, Formal analysis. Xianhe Ou: Methodology. Jiajin Chen: Methodology. Yu Chen: Methodology. Yuning Xia: Methodology. Fude Feng: Writing – review & editing, Investigation, Conceptualization.
The authors declare that they have no known competing financial interests or personal relationships that could have appeared to influence the work reported in this paper.
We thank the National Natural Science Foundation of China (No. 22277054), Natural Science Research Project of Anhui Educational Committee (No. 2023AH050620), Postgraduate Innovation Research and Practice Program of Anhui Medical University (No. YJS20240073) and Early Exposure to Scientific Research Training Program (Nos. 2023-ZQKY-133, 2024-ZQKY-066) for financial support.
Supplementary material associated with this article can be found, in the online version, at doi:
J. Yuan, H. Yang, W. Huang, et al., Chem. Soc. Rev. 54 (2025) 341–366. doi: 10.1039/d3cs00585b
Z. Yang, Q. Sun, L. Ji, et al., Asian J. Org. Chem. 14 (2025) e202500109. doi: 10.1002/ajoc.202500109
H. Bian, D. Ma, Y. Nan, et al., Coord. Chem. Rev. 534 (2025) 216551. doi: 10.1016/j.ccr.2025.216551
J. Zhao, J. Shi, X. Sun, et al., Chin. Chem. Lett. 37 (2026) 111317. doi: 10.1016/j.cclet.2025.111317
N. Sellet, J. Frey, M. Cormier, et al., Chem. Sci. 15 (2024) 8639–8650. doi: 10.1039/d4sc00814f
J. Zhang, W. Wang, J. Shao, et al., Coord. Chem. Rev. 516 (2024) 215986. doi: 10.1016/j.ccr.2024.215986
W. Xu, E. Leary, S. Sangtarash, et al., J. Am. Chem. Soc. 143 (2021) 20472–20481. doi: 10.1021/jacs.1c10747
X. Ai, Z. Wang, H. Cheong, et al., Nat. Commun. 10 (2019) 1087. doi: 10.1038/s41467-019-09001-7
Z. Zhang, V. Gevorgyan, Chem. Rev. 124 (2024) 7214–7261. doi: 10.1021/acs.chemrev.3c00869
C. Wen, G. Sun, L. Liu, et al., Green Chem. 26 (2024) 7944–7950. doi: 10.1039/d4gc02211d
W. Harrison, X. Huang, H. Zhao, Acc. Chem. Res. 55 (2022) 1087–1096. doi: 10.1021/acs.accounts.1c00719
S. Gong, G. Feng, Chin. Chem. Lett. 36 (2025) 110409. doi: 10.1016/j.cclet.2024.110409
G. Song, H. Heng, J. Wang, et al., Angew. Chem. Int. Ed. 60 (2021) 16889–16893. doi: 10.1002/anie.202103706
H. Heng, G. Song, X. Cai, et al., Angew. Chem. Int. Ed. 61 (2022) e202203444. doi: 10.1002/anie.202203444
E. Benchimol, J. Tessarolo, G.H. Clever, Nat. Chem. 16 (2024) 13–21. doi: 10.1038/s41557-023-01387-8
M. Mato, X. Fernández-González, C. D’avino, et al., Angew. Chem. Int. Ed. 63 (2024) e202413506. doi: 10.1002/anie.202413506
E. Nestoros, A. Sharma, E. Kim, et al., Nat. Rev. Chem. 9 (2025) 46–60.
W. Shen, H. Zhang, Z. Miao, et al., Adv. Funct. Mater. 33 (2023) 2210664. doi: 10.1002/adfm.202210664
L. Wu, A.C. Sedgwick, X. Sun, et al., Acc. Chem. Res. 52 (2019) 2582–2597. doi: 10.1021/acs.accounts.9b00302
S. Roy, N. Bag, S. Bardhan, et al., Adv. Drug Deliv. Rev. 197 (2023) 114821. doi: 10.1016/j.addr.2023.114821
T. Shi, X. Chen, X. Zhou, et al., Chin. Chem. Lett. 36 (2025) 110408. doi: 10.1016/j.cclet.2024.110408
H. Fukushima, S.S. Matikonda, S.M. Usama, et al., J. Am. Chem. Soc. 144 (2022) 11075–11080. doi: 10.1021/jacs.2c02962
S.S. Matikonda, D.A. Helmerich, M. Meub, et al., ACS Cent. Sci. 7 (2021) 1144–1155. doi: 10.1021/acscentsci.1c00483
W. Zhang, Y. Lv, F. Huo, et al., Adv. Mater. 36 (2024) 2314021. doi: 10.1002/adma.202314021
L. Lu, B. Li, S. Ding, et al., Nat. Commun. 11 (2020) 4192. doi: 10.1038/s41467-020-18051-1
Y. Yang, C. Sun, S. Wang, et al., Angew. Chem. Int. Ed. 61 (2022) e202117436. doi: 10.1002/anie.202117436
Y. Yang, Q. Jiang, F. Zhang, Chem. Rev. 124 (2024) 554–628. doi: 10.1021/acs.chemrev.3c00506
C. Yan, Z. Zhu, Y. Yao, et al., Acc. Mater. Res. 5 (2024) 64–75. doi: 10.1021/accountsmr.3c00196
S.M. Usama, B. Zhao, K. Burgess, Chem. Soc. Rev. 50 (2021) 9794–9816. doi: 10.1039/d1cs00017a
J. Xu, X. Zheng, T.B. Ren, et al., Coord. Chem. Rev. 528 (2025) 216379. doi: 10.1016/j.ccr.2024.216379
D. Ma, H. Bian, M. Gu, et al., Coord. Chem. Rev. 505 (2024) 215677. doi: 10.1016/j.ccr.2024.215677
L. Ding, X. Zhang, P. Wang, et al., Nat. Commun. 16 (2025) 8054. doi: 10.1038/s41467-025-63311-7
E. Feng, L. Jiao, S. Tang, et al., Chem. Eng. J. 432 (2022) 134355. doi: 10.1016/j.cej.2021.134355
Y. Zheng, T. Chen, Y. Gao, et al., Bioorg. Chem. 145 (2024) 107206. doi: 10.1016/j.bioorg.2024.107206
Y. Qin, Y. Xu, X. Gao, et al., J. Med. Chem. 68 (2025) 13954–13972. doi: 10.1021/acs.jmedchem.5c00975
D. Liu, Z. He, W. Gao, et al., Nat. Commun. 16 (2025) 4911. doi: 10.1038/s41467-025-60241-2
C. Sun, M. Zhao, X. Zhu, et al., CCS Chem. 4 (2022) 476–486. doi: 10.31635/ccschem.021.202101332
Y. Wan, W. Chen, Y. Liu, et al., Adv. Mater. 36 (2024) 2405966. doi: 10.1002/adma.202405966
R. Zhang, P. Shen, Y. Xiong, et al., Natl. Sci. Rev. 11 (2023) nwad286.
Y. Liu, J. Zhang, X. Zhou, et al., Angew. Chem. Int. Ed. 63 (2024) e202408064.
A.J.L. Jesus, J.R. Lucena Jr, G.P. Rodrigues, et al., J. Comput. Chem. 46 (2025) e70045. doi: 10.1002/jcc.70045
V. Sundharaj, S. Sarveswari, J. Mol. Struct. 1345 (2025) 142971. doi: 10.1016/j.molstruc.2025.142971
B. Le Guennic, D. Jacquemin, Acc. Chem. Res. 48 (2015) 530–537. doi: 10.1021/ar500447q
J. Miao, M. Miao, Y. Jiang, et al., Angew. Chem. Int. Ed. 62 (2023) e202216351. doi: 10.1002/anie.202216351
M.M.M. Swamy, Y. Murai, K. Monde, et al., ACS Appl. Mater. Interfaces 16 (2024) 17253–17266. doi: 10.1021/acsami.4c01000
F. Gentile, J.C. Yaacoub, J. Gleave, et al., Nat. Protoc. 17 (2022) 672–697. doi: 10.1038/s41596-021-00659-2
E. Hansen, A.R. Rosales, B. Tutkowski, et al., Acc. Chem. Res. 49 (2016) 996–1005. doi: 10.1021/acs.accounts.6b00037
F. Neese, Coord. Chem. Rev. 253 (2009) 526–563. doi: 10.1016/j.ccr.2008.05.014
J. Bosson, G.M. Labrador, C. Besnard, et al., Angew. Chem. Int. Ed. 60 (2021) 8733–8738. doi: 10.1002/anie.202016643
A.V. Kulinich, N.A. Derevyanko, A.A. Ishchenko, et al., Dyes Pigm. 161 (2019) 24–33. doi: 10.1016/j.dyepig.2018.09.031

Figure 1 Previous work for in-cell synthesis of Cy5 (a), Cy3 and Cy3.5 (b), and Cy-BI (c). (d) The present work for in-cell synthesis of NIR Cy3 dyes.

Figure 2 (a) The schematic presentation for synthesis of Cy3-1, Cy3-2 and Cy3-3 by the photoactivation method. (b) The changes of UV-vis absorption spectra during photoreaction over 0–720 min. CPreCy = 33.3 mmol/L, CEt3N = 66.6 mmol/L. Inset: photographs of reaction mixture diluted in methanol before and after photoreaction. (c) The normalized UV-vis absorption spectra (cyan) and fluorescence spectra (green) of Cy3-1, Cy3-2 and Cy3-3 in CHCl3.

Figure 3 (a) The UV-vis absorption intensity at 750 nm (A750) after photoreaction (10 mW/cm2, 12 h at 65 ℃). The reaction mixture containing PreCy-1 (33.3 mmol/L) and Et3N (66.6 mmol/L) in various solvents was diluted by 150 fold with methanol before measurements. Solvent: 1, H2O; 2, DMF; 3, 1,4-dioxane; 4, N,N-dimethylacetamide; 5, DMSO; 6, EtOAc; 7, THF; 8, pyridine; 9, acetone; 10, toluene; 11, CHCl3; 12, tBuOMe; 13, EtOH; 14, MeCN; 15, i-PrOH; 16, CH2Cl2; 17, Et3N; 18, MeOH. (b) The A750 measured after photoreaction (10 mW/cm2, 12 h at 65 ℃). The reaction mixture containing PreCy-1 (33.3 mmol/L) and various bases (66.6 mmol/L) in methanol was diluted by 150 fold with methanol before measurements. Base: 1, KOH; 2, NaOH; 3, K2CO3; 4, Na2CO3; 5, NaHCO3; 6, NH3·H2O; 7, N-methyl piperazine; 8, DIPEA; 9, pyridine; 10, Et3N. (c) The UV-vis absorption spectra after photoreaction (10 mW/cm2, 12 h at 65 ℃). The reaction mixture containing PreCy-1 (33.3 mmol/L) and various equivalents of Et3N in methanol was diluted with methanol before measurements. (d) The UV-vis absorption spectra after photoreaction (10 mW/cm2, 12 h) at various temperature. The reaction mixture containing PreCy-1 (33.3 mmol/L) and Et3N (66.6 mmol/L) in methanol and diluted by 150 fold with methanol before measurements.

Figure 4 (a) The conformations of Cy3-1, Cy3-2 and Cy3-3 after full minimization. (b) Calculated energy diagram of HOMO-LUMO levels and corresponding electron-density distribution of Cy3-1, Cy3-2 and Cy3-3. Cyan: positive diffuse and ambient light; green: negative diffuse and ambient light.

Figure 5 (a) CLSM images of HeLa cells after 30-min incubation with various concentrations of Cy3 products (20, 50 and 100 nmol/L). Scale bar: 150 µm. (b) CLSM images of HeLa cells. The cells were incubated with Cy3 products (50 nmol/L) for 30 min and stained with Mito-Tracker (100 nmol/L) for 30 min before imaging. Scale bar: 20 µm.

Figure 6 (a) The schematic presentation for photosynthesis of Cy3-1 in the presence of NAD+ or histamine. (b) The UV-vis absorption spectra of reaction solution before and after LED light irradiation (10 mW/cm2, t = 6 h). (c) Chemical structures of NAD+ and histamine.

Figure 7 (a) Schematic diagram of the in-cell synthesis of Cy3 through photoactivition. (b) CLSM images of HeLa cells. The cells were incubated with PreCy (20 µmol/L) for 1 h and treated with white LED light irradiation (40 mW/cm2) for various period (0-30 min) before imaging. Scale bar: 50 µm. (c) CLSM images of HeLa cells. The cells were incubated with PreCy-3 (20, 50 and 100 µmol/L) for 1 h and treated with or without white LED light irradiation (tirr = 30 min, 40 mW/cm2). Scale bar: 50 µm. (d) CLSM images of HeLa cells. The cells were incubated with PreCy-3 (20 µmol/L) for 1 h, stained with Mito-Tracker (100 nmol/L) for 30 min and treated with white LED light irradiation (40 mW/cm2) for 30 min before imaging. Scale bar: 20 µm.

 扫一扫看文章


扫一扫关注我们
 DownLoad:
 下载:
 下载: