College of Chemistry, Chemical Engineering, and Materials Science, Key Laboratory of Molecular and Nano Probes, Ministry of Education, Collaborative Innovation Center of Functionalized Probes for Chemical Imaging in Universities of Shandong, Institutes of Biomedical Sciences, Shandong Normal University, Ji'nan 250014, China
b.
College of Chemistry and Chemical Engineering, Key Laboratory of Water Security and Water Environment Protection in Plateau Intersection, Ministry of Education, Northwest Normal University, Lanzhou 730070, China
c.
Laoshan Laboratory, Qingdao 266237, China
d.
College of Medicine, Linyi University, Linyi 276000, China
Received Date:
02 September 2025 Accepted Date:
22 December 2025 Revised Date:
18 December 2025 Available Online:
15 December 2026
Abstract:
Hepatic fibrosis (HF) is critical for immune evasion in hepatocellular carcinoma (HCC), mainly driven by hepatic stellate cell (HSCs) activation, though the underlying molecular mechanisms linking HSCs activation to immune evasion remain unclear. Here, we report a targeted fluorescent nanoprobe platform for visualizing and dissecting oxidative stress dynamics driving HCC immune evasion in fibrotic tumor microenvironments. We develop a dual-channel fluorescent probe (FP-CP) enabling crosstalk-free detection of superoxide anion (O2•−) and nitric oxide (NO) with high sensitivity and spectral separation. To achieve HSCs-specific targeting, FP-CP is encapsulated into nanoparticles surface-functionalized with the HSCs-targeting peptide HTP, yielding HTP-FP-CP nanoprobes that selectively accumulate in fibrotic niches. Using this nanoplatform, in situ imaging reveals coordinated O2•−/NO elevation during HSCs activation, directly linked to oxidative inactivation of the tumor suppressor phosphatase and tensin homolog (Pten). Mechanistically, cyclooxygenase-2 (COX-2) elevation drives O2•−/NO accumulation, with O2•− and their products peroxynitrite (ONOO−) directly oxidizing/nitrifying residues in Pten. This oxidative-mediated Pten suppression activates the protein kinase B (AKT)- mammalian target of rapamycin (mTOR)-programmed cell death ligand 1 (PD-L1) axis, facilitating HCC immune evasion. Our study identifies the COX-2-O2•−/NO-Pten-Akt-mTOR-PD-L1 pathway as a critical oxidative stress-mediated molecular bridge between HF and HCC, and establishes HTP-FP-CP as a powerful nanoplatform for probing these oxidative stress dynamics in vivo, providing insights into potential therapeutic strategies for intercepting HCC in fibrotic patients.
Hepatocellular carcinoma (HCC) [1-3], the sixth most prevalent malignancy and a leading cause of cancer mortality globally, arises predominantly within fibrotic microenvironments [4]. This fibrotic niche, characterized by immune dysregulation that facilitates tumor immune evasion [5,6] serves as both a precursor and accelerator of hepatocarcinogenesis. Central to this pathological process is the activation of hepatic stellate cells (HSCs) [7-11]. The transdifferentiation of quiescent HSCs into matrix-producing myofibroblasts is a pivotal step in driving hepatic fibrosis (HF) [12,13]. However, the exact molecular mechanisms by which HSC-derived pathways engender the hepatic fibrotic microenvironment to promote HCC progression remain unresolved [14-17]. Deciphering these spatiotemporal regulatory molecule networks is critical for intercepting HCC development in high-risk fibrotic patients.
Oxidative stress may play an essential regulatory role in various aspects of the HCC process, including HF and HCC immune evasion. O2•− and NO, as significant signaling molecules in oxidative stress, may contribute to the proliferation of HCC by activating the mitogen-activated protein kinase (MAPK) [18] and janus kinase (JAK)/signal transducer and activator of transcription (STAT) [19,20] signaling pathways, as well as triggering of nuclear factor kappa-B (NF-κB) [21] to create a favorable microenvironment for the development of HCC [22,23]. It is thus clear that the synergistic regulation of superoxide anion (O2•−) and nitric oxide (NO) may be a key point in the promotion of HCC immune evasion by HF. However, there is a lack of ideal tools for simultaneous in situ monitoring of O2•−/NO, resulting in a dearth of relevant studies. Therefore, there is an urgent need to develop ideal analytical methods to realize the synergistic detection of O2•−/NO and to reveal the related molecular mechanisms in HSCs.
Fluorescence imaging, with distinct advantages of high sensitivity, selectivity, real-time, dynamics, and signal-to-noise ratio, is a powerful means of detecting active small molecules in organisms [24-35]. Currently, single-response fluorescent probes for O2•− or NO have been reported. Although it is possible to image simultaneously using either O2•− or NO fluorescent probes. However, problems such as different probe absorption, uneven spatial distribution, insufficient specificity, and high toxicity may occur. Simultaneous imaging probes with multiple recognition sites can be used to understand the relationship between multiple biologically active molecules in a disease and for precise detection of the disease due to inherent advantages such as elimination of false signals and increased sensitivity and accuracy. Therefore, a dual-channel simultaneous O2•− and NO-responsive single fluorescence probe is still urgently needed to decipher the correlations and regulatory roles of O2•− and NO in HF-mediated immune evasion.
Here, we reported a targeted nanoprobes platform, HTP-FP-CP, engineered for spatiotemporal imaging of oxidative stress in liver fibrotic microenvironments. The platform integrated a dual-channel molecular probe, FP-CP, capable of crosstalk-free detection of O2•− (blue channel) and NO (red channel), enabling high-resolution imaging and mechanistic dissection of O2•−/NO dynamics during HSCs activation. FP-CP was encapsulated within a functional nanocarrier formed by self-assembly of HTP-conjugated amphiphilic polyethylene glycol (PEG). This design transformed the cell-permeable but non-targeted FP-CP into the HTP-FP-CP nanoplatform, endowing it with HSC-specific targeting, enhanced stability, and in vivo delivery capability. The nanoparticle-encapsulated HTP-FP-CP achieved selective accumulation in fibrotic livers, enabling non-invasive, real-time visualization of oxidative stress in living animals. Combined with cellular imaging and a series of biochemical and molecular biology assays, we revealed the detailed molecular mechanisms of O2•−/NO regulation in HF-mediated HCC immune evasion, providing new targets for disease treatment.
The design of fluorescent probe FP-CP capable of spectrally crosstalk-free imaging and detection of O2•− and NO in living organisms needs to satisfy two conditions: Firstly, the response to O2•− and NO must have high sensitivity and specificity due to the extremely low intracellular O2•− and NO concentrations and the presence of a large number of interfering substances in complex biological systems. Second, the maximum fluorescence emission peaks of the corresponding fluorophores of O2•− and NO should be spectrally distinguishable to avoid crosstalk, to achieve the purpose of simultaneous detection, and to provide more realistic and reliable imaging and detection of O2•− and NO in the organism.
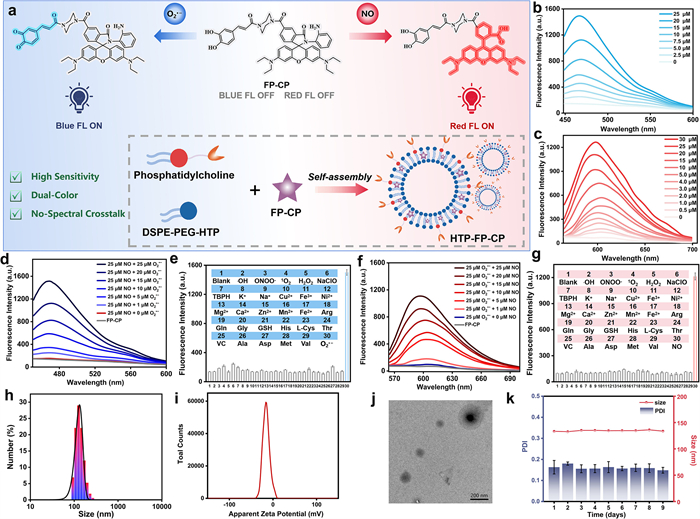
According to the above design requirement, caffeic acid was employed as the specific recognition and luminescent group for O2•− [36], o-phenylenediamine for highly selective recognition of NO [37], and rhodamine as a fluorophore for NO detection (Fig. 1a). The hydroxyl group in caffeic acid can be highly specifically captured by O2•− to oxidize its catechol to form benzoquinone, thereby emitting blue fluorescence. NO can selectively attack the amino group of o-phenylenediamine to form triazole, and the hydrolysis of triazole triggers the opening of the non-fluorescent rhodamine spironolactam ring, which leads to a marked enhancement of rhodamine's red fluorescence. Moreover, the difference between the maximum emission peaks of blue and red fluorescence was about 100 nm, which avoided signal crossover to the greatest extent. Given the inherent lack of active targeting capability of the FP-CP probe, this study constructed the liposomal nanomaterial HTP-FP-CP based on the principle of ligand-receptor interaction. By incorporating HTP, a ligand specific for HSCs membrane receptors [38], this material was successfully engineered for targeted detection of HSCs. The non-targeted liposome Lip-FP-CP was concurrently developed as a control.
Figure 1
Figure 1.
The design and characterization of FP-CP and HTP-FP-CP. (a) The design principles and reaction mechanisms of FP-CP and HTP-FP-CP. Fluorescence spectra of probe FP-CP after incubation with different concentrations of (b) O2•− (0-25 µmol/L) and (c) NO (0-30 µmol/L) in PBS buffer solution. (d) O2•− channel fluorescence spectra of FP-CP in response to different concentrations of O2•− in the presence of 25 µmol/L NO. Selectivity of the O2•− channel (e) and NO channel (g) of probe FP-CP for common interfering substances. (f) NO channel fluorescence spectra of probe FP-CP in response to different concentrations of NO in the presence of 25 µmol/L O2•−. Particle size distribution (h) and zeta potential map (i) of HTP-FP-CP in aqueous solution. (j) Low-magnification transmission electron micrograph of HTP-FP-CP. (k) Changes in particle size and polydispersity index (PDI) of HTP-FP-CP in aqueous solution over 9 days. µM = µmol/L. Data were expressed as mean ± standard deviation SD (n = 3).
To demonstrate FP-CP as an ideal dual-response probe for O2•− and NO, its spectral properties and reactivity were examined under simulated physiological conditions. As shown in Fig. S3 (Supporting information), the absorption peak at 395 nm increased significantly upon O2•− addition, indicating oxidation of the phenolic hydroxyl to benzoquinone. Under 380 nm excitation, the fluorescence intensity at 470 nm increased with O2•− concentration (Fig. 1b), showing an 11-fold enhancement (Fig. S4a in Supporting information). A linear relationship was observed with F = 55.63[O2•−] + 88.11 (R2 = 0.996, Fig. S6a in Supporting information), and the detection limit was calculated as 41 nmol/L. Similarly, upon NO addition, a new absorption peak emerged at 550 nm (Fig. S3), suggesting ring-opening of the rhodamine spirolactam. A 15-fold red fluorescence enhancement at 600 nm was recorded (Fig. S4 in Supporting information), which increased with NO concentration (Fig. 1c). The fluorescence intensity correlated linearly with NO concentration (0-30 µmol/L) via F = 35.31[NO] + 177.51 (R2 = 0.997, Fig. S6b in Supporting information), with a detection limit of 30 nmol/L. These results confirm FP-CP’s potential for sensitive O2•− and NO detection.
Subsequently, we investigated the spectrally resolvable ability of FP-CP to O2•− and NO. In the presence of NO, the blue fluorescence was increased accordingly with the increase of O2•− concentration, further indicating that the blue channel of FP-C was only sensitive to the change of O2•− (Fig. 1d). Similarly, in the presence of O2•−, the subsequent addition of different concentrations of NO resulted in a gradual enhancement of red fluorescence, implying that the NO channel of FP-CP could not respond to changes in O2•− and could only pick up the signal of NO (Fig. 1f). In addition, FP-CP possessed other advantages including high specificity, good photostability and favorable biocompatibility (Figs. 1e and g, Figs. S5 and S7-S9 in Supporting information). The above results further demonstrated that O2•− and NO could be independently monitored in their respective channels without spectral interference.
The liposomal probe HTP-FP-CP and control Lip-FP-CP were also characterized. Their particle sizes were ~130 nm and ~110 nm, respectively (Fig. 1h and Fig. S10 in Supporting information), and both were anionic (Fig. 1i and Fig. S11 in Supporting information). HTP-FP-CP showed uniform spherical morphology without aggregation (Fig. 1j). Over nine days, its size and absorbance remained stable in aqueous and simulated physiological conditions (Fig. 1k, Figs. S12 and S13 in Supporting information). Biocompatibility tests in mice revealed no significant changes in body weight, tissue staining (Fig. S14 in Supporting information), or serum liver enzyme levels (Fig. S15 in Supporting information) compared to controls, indicating low biotoxicity and suitability for in vivo imaging. These results support HTP-FP-CP as a promising probe for studying O2•− and NO in HSCs.
After confirming the excellent in vitro performance of FP-CP and HTP-FP-CP in detecting O2•− and NO, we evaluated whether FP-CP could simultaneously and distinguishably monitor both species in HSCs via blue and red fluorescence. To modulate intracellular O2•− and NO, we used 2-methoxyestradiol (2-Me) and exogenous NO solution. As shown in Fig. S16 (Supporting information), HSCs treated with 2-Me showed a 2.5-fold increase in blue fluorescence compared to normal cells, which was notably reduced by the O2•− scavenger Tiron [39]. Red fluorescence remained low and unchanged. Similarly, NO-treated HSCs exhibited a 2.1-fold increase in red fluorescence, which was suppressed by the NO inhibitor Carboxy-PTIO [40], while blue fluorescence stayed faint and stable (Fig. S17 in Supporting information). These results confirm that FP-CP enables real-time, simultaneous, and crosstalk-free monitoring of O2•− and NO in HSCs.
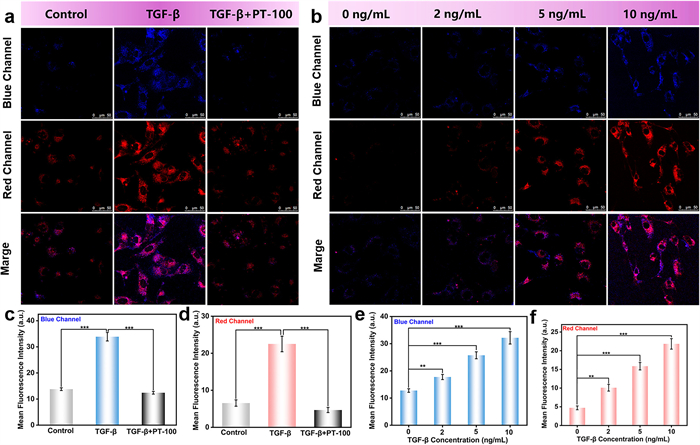
Since HSCs activation and extracellular matrix deposition are key steps in HF, we simulated HF at the cellular level by activating HSCs and tracking O2•− and NO dynamics. Using transforming growth factor-β (TGF-β) [41] to activate and talabostat (PT-100) [42] to inhibit HSCs, we verified activation states via alpha smooth muscle actin (α-SMA) [43] with Western blot (Fig. S18 in Supporting information). With FP-CP, we observed that both blue and red fluorescence increased significantly in activated HSCs (Figs. 2a, c and d), and decreased upon inhibition. As HSCs activation increased gradually, both fluorescence signals enhanced correspondingly (Figs. 2b, e and f), indicating that synergistic rises in O2•− and NO accompany HSCs activation and contribute to HF progression.
Figure 2
Figure 2.
Simultaneous dynamic imaging of O2•− and NO fluctuations in HSCs. (a) Cells in the control group were not treated; cells in the TGF-β group were incubated with TGF-β1 (10 ng/mL, 12 h); cells in the TGF-β + PT-100 group were pretreated with TGF-β1 for 12 h and then incubated with PT-100 (2 µmol/L) for 6 h. Finally, cells in all three groups were stained with FP-CP for 30 min to simultaneously image O2•− and NO. (b) Cells were treated as follows: 0 ng/mL: untreated control; 2 ng/mL: TGF-β1 (2 ng/mL, 12 h); 5 ng/mL: TGF-β1 (5 ng/mL, 12 h); 10 ng/mL: TGF-β1 (10 ng/mL, 12 h). Finally, four groups of cells were stained by FP-CP for 30 min to simultaneously image O2•− and NO within the HSCs. Scale bar: 50 µm. (c, d) Data output of the blue channel and the red channel in (a). (e, f) Data output of the blue channel and red channel in (b). Data were expressed as mean ± SD (n = 3). **P < 0.01, ***P < 0.001.
The targeting capability of the liposomes was rigorously validated. Lipopolysaccharide (LPS) was employed to selectively elevate intracellular O2•− and NO levels in hepatocytes, HCC cells, and HSCs. Following this, the cells were incubated with either HTP-FP-CP or Lip-FP-CP. Notably, as shown in Fig. S19 (Supporting information), a pronounced enhancement in fluorescence intensity within both the blue and red channels was exclusively observed only in HSCs incubated with HTP-FP-CP. These results established that HTP-FP-CP specifically targets HSCs, thereby allowing high-efficacy detection of reactive species levels and functional analysis in these cells.
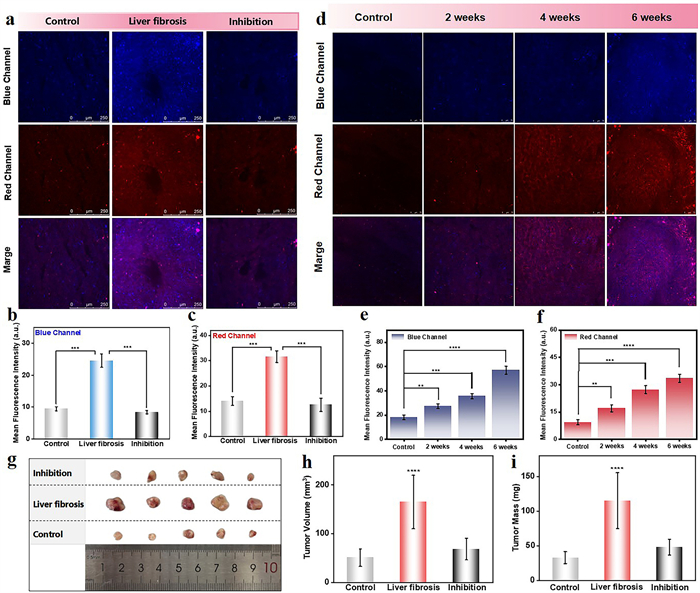
We performed in situ in vivo imaging using HTP-FP-CP to further explore the relationship between O2•− and NO levels and HF in mice. The mouse HF model was established following previously reported methods [44]. Animal protocols were approved by the Shandong Normal University Ethical Review Committee for Animal Experiments (No. AEECSDNU2022123). Subsequently, the degree of HF was determined by the Masson assay of collagen area ratio, which was significantly higher than that of the normal group in the HF mouse model, as shown in Fig. S20 (Supporting information), which demonstrated the successful construction of the HF mouse model. As shown in Figs. 3a-c, the O2•−-associated blue fluorescence signal and NO-associated red fluorescence signal increased dramatically in the HF group, which were 2.7- and 2.1-fold higher than the control group, respectively. This observation demonstrated that O2•− and NO overproduction arose in the pathogenesis and progression of HF, suggesting their potential pathophysiological involvement. Furthermore, both O2•−-related (blue) and NO-related (red) fluorescence signals increased significantly with the deepening degree of HF (Figs. 3d-f). This further suggested that significantly elevated O2•− and NO were important regulators of HF.
Figure 3
Figure 3.
Fluorescence imaging of mice with HF. (a) Fluorescence imaging of O2•− and NO levels in mouse livers during HSCs activation. (b, c) Data output of the blue channel of O2•− and the red channel of NO in panel a. (d) Fluorescence imaging of O2•− and NO levels in the livers of mice with different degrees of activation of HSCs. Blue channel for O2•−: λex = 405 nm, λem = 415-500 nm; red channel for NO: λex = 565 nm, λem = 580-650 nm. Scale bar: 250 µm. (e, f) Data output of O2•− blue channel and NO red channel in panel d. Average tumor photograph (g), volume (h) and weight (i) of mice in the control, liver fibrosis and inhibition groups. Data were expressed as mean ± SD (n = 5). **P < 0.01, ***P < 0.001, ****P < 0.0001.
Research has demonstrated that reactive oxygen species (ROS) plays an indispensable role in HCC growth and immune regulation. Based on these collective findings, we plausibly proposed that O2•− and NO generated by activated HSCs may significantly contribute to promoting tumor immune evasion. Thereby, we investigated the specific effects of HSCs on HCC. As shown in Fig. 3g, the tumors of the tumor-bearing mice in the HF group were significantly larger than the control group. Correspondingly, inhibition of HF significantly suppressed tumor growth in mice. This result was further confirmed by measurements of tumor mass and volume (Figs. 3h and i). Collectively, these findings demonstrated that HF not only promotes HCC immune evasion but also implicates O2•− and NO as pivotal signaling hubs in this process.
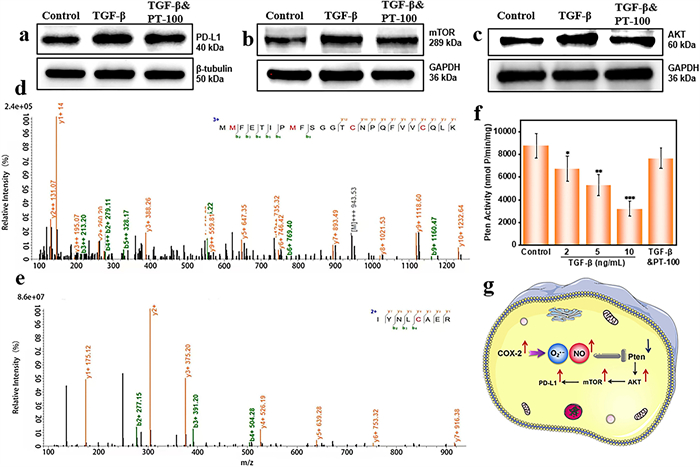
Immune evasion is critical in HCC progression, and understanding its mechanisms offers a promising strategy to suppress HCC growth. HSCs are known to promote immune evasion. Here, we investigated the roles of O2•− and NO in HSCs in this process. Given that programmed cell death ligand 1 (PD-L1) is a key immune checkpoint molecule in HCC [45], we examined its expression during HSC activation. As shown in Fig. 4a, PD-L1 was markedly upregulated in activated HSCs, whereas inhibition of HSC activation led to its downregulation. These results confirm that PD-L1 contributes to immune evasion mediated by activated HSCs.
Figure 4
Figure 4.
Exploration of the mechanism by which O2•− and NO mediate immune evasion in HSCs. Immune evasion-associated protein expression and activity in HSCs across activation states. (a) PD-L1. (b) mTOR. (c) AKT. (d, e) Protein mass spectrometry analysis of the reaction of COX-2 with O2•− and NO through LC-MS/MS: (d) C314 and C321; (e) C150. (f) The Pten activity level. (g) Schematic of the proposed signaling pathway during HSCs activation. Data were expressed as mean ± SD (n = 3). *P < 0.1, **P < 0.01, ***P < 0.001. GAPDH: glyceraldehyde-3-phosphate dehydrogenase.
Next, we explored the signaling pathway regulating PD-L1 in activated HSCs. Previous studies indicate that phosphatase and tensin homolog (Pten) regulates PD-L1 through the protein kinase B (AKT)–mammalian target of rapamycin (mTOR) axis [46-49]. We found that Pten activity decreased significantly with HSC activation and was restored upon inhibition of activation (Fig. 4f). Correspondingly, levels of AKT and mTOR were elevated in activated HSCs and returned to near-resting levels when activation was suppressed (Figs. 4b and c, Fig. S21 in Supporting information). These results suggest that Pten inactivation triggers the AKT–mTOR–PD-L1 signaling pathway, promoting immune evasion in HCC.
The mechanism underlying Pten activity alteration remained unknown. Given that O2•− and NO could oxidize amino acid residues and impair protein function, we hypothesized that their overproduction during HSCs activation oxidizes Pten, thereby inhibiting its activity. To test this, we employed LC-MS to analyze the link between elevated O2•−/NO and Pten inactivation. Results showed that O2•− oxidized cysteine residues at positions 321 and 314 within the Pten C2 domain (Fig. 4d). This domain (amino acids 185-351) is critical for directing Pten to the cell membrane and regulating its phosphatase activity [50], implying that oxidation at these sites could disrupt its function.
Notably, LC-MS did not detect direct NO-mediated modifications on Pten. We therefore proposed that NO indirectly affects Pten by reacting with O2•− to form peroxynitrite (ONOO⁻) [51]. Further analysis revealed that ONOO⁻ oxidized key cysteine residues (Cys132 and Cys150, Fig. 4e and Fig. S22 in Supporting information) in the phosphatase domain, essential for catalytic activity, as well as Cys347 in the C2 domain. Additionally, ONOO⁻ induced nitration of lysine residues at positions 324 and 350 within the C2 domain (Fig. S22). These modifications collectively inhibit Pten activity.
To functionally validate these findings, we scavenged O2•− and/or NO during HSC activation. Scavenging either molecule enhanced Pten activity and reduced PD-L1 expression, with the most pronounced effect observed when both were eliminated together (Fig. S23 in Supporting information). This confirms that O2•− and NO synergistically inactivate Pten through oxidative modifications directly by O2•− and via ONOO⁻ representing a crucial regulatory node through which HSC activation may promote HCC immune evasion.
Finally, we investigated the upstream causes of elevated O2•− and NO. Activated HSCs exhibit enhanced lipid metabolism and upregulated cyclooxygenase-2 (COX-2) [52,53]. During prostaglandin synthesis, the peroxidase site of COX-2 facilitates redox reactions that can transfer electrons to molecular oxygen, reducing it to O2•−. We therefore examined whether COX-2 influences O2•− and NO levels during HF. As shown in Fig. S24 (Supporting information), inhibition of COX-2 significantly reduced both blue and red fluorescence compared to the non-inhibited group, indicating a decrease in O2•− and NO. Furthermore, COX-2 activity increased markedly with the degree of HSCs activation and decreased when activation was inhibited (Fig. S25 in Supporting information). These results demonstrate that COX-2 is a key regulator driving the elevation of O2•− and NO during HSC activation and HF.
This study aimed to dissect the complex molecular mechanisms through which HF promotes HCC immune evasion, with a particular emphasis on the regulatory role of oxidative stress in HSCs activation. Critically, we developed a dual-channel fluorescent nanoprobe (HTP-FP-CP) capable of simultaneous, crosstalk-free detection of key oxidative mediators O2•− and NO during HSCs activation. The discovery of abnormally elevated O2•−/NO during HSCs activation, exploiting our created fluorescent probe, was a key finding. Based on this dual-detection capability, the direct quench of Pten activity via oxidative and nitrative modifications of O2•− and ONOO− was identified. This not only revealed a previously unrecognized mechanism of Pten regulation but also forged a direct connection between oxidative stress signaling and Pten, a well-established tumor suppressor. While prior research had underscored the significance of redox homeostasis in cellular function, our study uniquely identified this specific pathway in the context of HSCs-driven HF and HCC progression.
Unveiling the COX-2-O2•−/NO-Pten-AKT-mTOR-PD-L1 axis as the key signaling pathway in HF-promoted HCC immune evasion represented another major contribution. By establishing COX-2 as the upstream regulator of O2•− and NO production, we elucidated the sequential molecular cascade driving immune evasion. This pathway presented a prime target for therapeutic intervention. Inhibiting any step within this axis could potentially disrupt the immune evasion process and impeded HCC progression. For instance, targeted inhibition of COX-2 might reduce O2•− and NO production, thereby preventing Pten inactivation and subsequent activation of the AKT-mTOR-PD-L1 pathway (Fig. 4g).
The HSCs-targeted nanoprobe HTP-FP-CP was instrumental in these discoveries, enabling real-time, in-situ monitoring of O2•− and NO fluctuations with high spatiotemporal resolution in HSCs and in vivo within a mouse model of HF. Its dual-response design and selective HSCs delivery overcame limitations of spatial off-targeting and signal interference, allowing us to directly observe the dynamic changes of multiple signaling molecules during HSCs activation and HF progression.
In summary, our study has significantly advanced the understanding of the molecular mechanisms underlying the promotion of HCC by HF. By developing a new imaging tool and identifying key signaling pathways, we have provided a robust foundation for future research in this field. We suggest that these findings may provide much-needed lines of attack in human HCC.
CRediT authorship contribution statement
Yuantao Mao: Writing – original draft, Data curation. Wen Zhang: Funding acquisition, Formal analysis, Conceptualization. Xinru Qi: Data curation. Chuanchen Wu: Methodology. Xin Wang: Methodology, Data curation. Ping Li: Writing – original draft, Funding acquisition, Conceptualization. Bo Tang: Funding acquisition, Conceptualization.
Declaration of competing interest
The authors declare that they have no known competing financial interests or personal relationships that could have appeared to influence the work reported in this paper.
Acknowledgments
This work was supported by the National Natural Science Foundation of China (Nos. 22377070, 22134004, 22574097, 22304107), the Natural Science Foundation of Shandong Province of China (Nos. ZR2023ZD31, ZR2023YQ016, ZR2021QB042), the Project of Shandong Provincial Center for Fundamental Science Research (No. YDZX2024150), and the Project of Gansu Provincial Science and Technology Leading Talent (No. 25RCKA027).
Supplementary materials
Supplementary material associated with this article can be found, in the online version, at doi:10.1016/j.cclet.2025.112314.
Figure 1
The design and characterization of FP-CP and HTP-FP-CP. (a) The design principles and reaction mechanisms of FP-CP and HTP-FP-CP. Fluorescence spectra of probe FP-CP after incubation with different concentrations of (b) O2•− (0-25 µmol/L) and (c) NO (0-30 µmol/L) in PBS buffer solution. (d) O2•− channel fluorescence spectra of FP-CP in response to different concentrations of O2•− in the presence of 25 µmol/L NO. Selectivity of the O2•− channel (e) and NO channel (g) of probe FP-CP for common interfering substances. (f) NO channel fluorescence spectra of probe FP-CP in response to different concentrations of NO in the presence of 25 µmol/L O2•−. Particle size distribution (h) and zeta potential map (i) of HTP-FP-CP in aqueous solution. (j) Low-magnification transmission electron micrograph of HTP-FP-CP. (k) Changes in particle size and polydispersity index (PDI) of HTP-FP-CP in aqueous solution over 9 days. µM = µmol/L. Data were expressed as mean ± standard deviation SD (n = 3).
Figure 2
Simultaneous dynamic imaging of O2•− and NO fluctuations in HSCs. (a) Cells in the control group were not treated; cells in the TGF-β group were incubated with TGF-β1 (10 ng/mL, 12 h); cells in the TGF-β + PT-100 group were pretreated with TGF-β1 for 12 h and then incubated with PT-100 (2 µmol/L) for 6 h. Finally, cells in all three groups were stained with FP-CP for 30 min to simultaneously image O2•− and NO. (b) Cells were treated as follows: 0 ng/mL: untreated control; 2 ng/mL: TGF-β1 (2 ng/mL, 12 h); 5 ng/mL: TGF-β1 (5 ng/mL, 12 h); 10 ng/mL: TGF-β1 (10 ng/mL, 12 h). Finally, four groups of cells were stained by FP-CP for 30 min to simultaneously image O2•− and NO within the HSCs. Scale bar: 50 µm. (c, d) Data output of the blue channel and the red channel in (a). (e, f) Data output of the blue channel and red channel in (b). Data were expressed as mean ± SD (n = 3). **P < 0.01, ***P < 0.001.
Figure 3
Fluorescence imaging of mice with HF. (a) Fluorescence imaging of O2•− and NO levels in mouse livers during HSCs activation. (b, c) Data output of the blue channel of O2•− and the red channel of NO in panel a. (d) Fluorescence imaging of O2•− and NO levels in the livers of mice with different degrees of activation of HSCs. Blue channel for O2•−: λex = 405 nm, λem = 415-500 nm; red channel for NO: λex = 565 nm, λem = 580-650 nm. Scale bar: 250 µm. (e, f) Data output of O2•− blue channel and NO red channel in panel d. Average tumor photograph (g), volume (h) and weight (i) of mice in the control, liver fibrosis and inhibition groups. Data were expressed as mean ± SD (n = 5). **P < 0.01, ***P < 0.001, ****P < 0.0001.
Figure 4
Exploration of the mechanism by which O2•− and NO mediate immune evasion in HSCs. Immune evasion-associated protein expression and activity in HSCs across activation states. (a) PD-L1. (b) mTOR. (c) AKT. (d, e) Protein mass spectrometry analysis of the reaction of COX-2 with O2•− and NO through LC-MS/MS: (d) C314 and C321; (e) C150. (f) The Pten activity level. (g) Schematic of the proposed signaling pathway during HSCs activation. Data were expressed as mean ± SD (n = 3). *P < 0.1, **P < 0.01, ***P < 0.001. GAPDH: glyceraldehyde-3-phosphate dehydrogenase.


 DownLoad:

 下载:


 下载:

