State Key Laboratory of Antiviral Drugs, Henan Joint International Research Laboratory of Environmental Pollution Control Materials, College of Chemistry and Molecular Sciences, Henan University, Kaifeng 475004, China
Received Date:
04 August 2025 Accepted Date:
22 December 2025 Revised Date:
30 October 2025 Available Online:
15 August 2026
Abstract:
Metal-organic frameworks (MOFs) hold promise as electrochemiluminescence (ECL) emitters but are limited by high operating potentials and low efficiencies, leading to substantial electrochemical interference and reduced sensitivity. Here, we report a defect-rich Fe(Ⅲ)-based MOF (De-Fe(Ⅲ)-MOF) that exhibits highly efficient ECL triggered at an ultralow potential (-0.3 V vs. Ag/AgCl). Prepared using electron-deficient 3,4,9,10-perylenetetracarboxylic acid (PTCA) as ligands and H3PO4 as the acid modulator, De-Fe(Ⅲ)-MOF features abundant open-metal catalytic sites, which achieves an exceptional cathodic ECL efficiency of 553.06%, even using classical Ru(bpy)3Cl2/S2O82− system triggered at -1.2 V as a standard. This outstanding performance is attributed to three key factors: (1) The abundant Fe(Ⅲ) active sites that efficiently catalyze S2O82− to produce SO4•- radicals at ultralow potentials; (2) the electron-deficient PTCA ligand that enables simultaneous reduction at similarly low potentials; and (3) the unified porous frame that facilitates efficient electron transfer through an ultrashort pathway, enhancing ECL efficiency. These features collectively minimize electrochemical side reactions and significantly enhance the sensitivity of the sensing platform. To demonstrate its practical application, we constructed an ECL sensor for carboxylesterase activity, achieving a limit of detection of 6.6 × 10⁻⁷ U/L with minimal interference.
Electrochemiluminescence (ECL), a form of chemiluminescence triggered by an electrochemical reaction, has garnered immense interest in the field of in vitro diagnosis owing to its merits of low background, excellent controllability, and easy automation [1,2]. The exploitation and screening of high-performing ECL systems is a crucial driving force for the advancement of ECL analytical technique. Recently, cathodic ECL systems have been evolved from classical tris(2,2′-bipyridyl) ruthenium and to emerging nanomaterials, such as polymeric carbon nitride [2,3], metal nanoclusters [4,5], and reticular structures [6,7]. Unfortunately, the above-mentioned ECL systems usually necessitate an extremely negative potential (below −1.0 V or even −2.0 V) to meet the sensitivity requirements of practical applications, which brings serious challenges for precise diagnostics owing to the existing of severe electrochemical interference, potential damage to biomolecules, and cross talk [8–10]. To address these challenges, it is highly meaningful and urgently demanded to develop high-efficient and cathodic ultralow-potential-triggered (ULP) ECL systems.
To achieve cathodic ULP ECL systems, the crucial approaches involve reducing the reductive potential of luminophores or co-reactants. Lowing the band gap energy, such as K-doped graphitic carbon nitride [11], iridium(Ⅲ) J-aggregate [12] and S-CdIn2S4 [13], is the primary methods to reduce the reductive potential of luminophores. Additionally, activating the co-reactants to generate rich active radicals at low potential, involving cobalt-iron layered double hydroxide [14], iron single-atom catalysts [15–17], α-Fe2O3-Pt [18], and Cu2MoS4 [19], have been developed. However, these above-mentioned materials usually get stuck in the reduction the potential of luminophores or co-reactants simply, limiting their applications in ever-increasing demand for sensitive detection. Reticular luminescent metal-organic frameworks (LMOFs), paves a promising avenue for exploiting ULP ECL systems owing to their easily integrating active site nodes, high porosity for adsorption, and tunable ligands [20–22]. Very recently, electroactive ligands [6], metal node engineering [23,24], energy transfer between ligands and nodes [25], have been reported to regulate the excitation potential of LMOFs. Despite most progress, since the metal sites are usually completely coordinated by organic ligands causing inadequate exposure of the active sites, the simultaneous reduction the potential of luminophores and co-reactants as efficient ULP ECL system is still in its infancy.
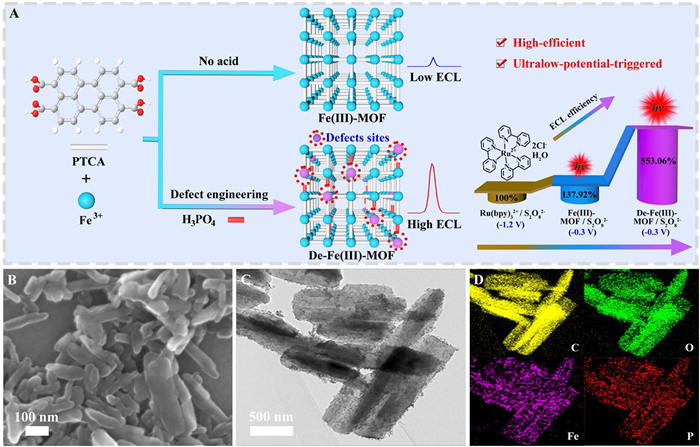
Inspired by defect engineering could offer an effective tool to tailor the open-metal sites of LMOFs for enhancing through-bond electrocatalytic process [26,27]. Herein, 3,4,9,10-perylenetetracarboxylic acid (PTCA) with intrinsic electron-deficient nature, is selected as the electroactive ligand of LMOFs. Using an easy-to-operate acid modulator-induced defectstrategy to regulate the open-Fe(Ⅲ) sites, an efficient ultralow-triggering potential (−0.3 V vs. Ag/AgCl) near-infrared (λmax = 728 nm) ECL system of defect-rich perylene-based organic frameworks (De-Fe(Ⅲ)-MOF)/S2O82− was achieved (Fig. 1A). The De-Fe(Ⅲ)-MOF not only allows ECL emitters and co-reaction accelerators in a unity porous frame to trigger efficient intramolecular electron transfer and reduce aggregation-caused quenching (ACQ) effect [28], but also endows plentiful open-metal sites to efficiently catalyze co-reaction of S2O82− to produce superabundant active SO4•− with an obvious maximum peak potential at −0.25 V. Consequently, under triggering potential at −0.3 V, the De-Fe(Ⅲ)-MOF achieved a remarkable efficiency of 553.06% even when benchmarked against the classical Ru(bpy)3Cl2/S2O82− system triggered at −1.2 V. Furthermore, the ECL efficiency of De-Fe(Ⅲ)-MOF increased 4.01-folds and 5.30-folds than that of pristine Fe(Ⅲ)-MOF/S2O82− and PTCA/S2O82− systems, respectively, which paves a promising platform for low electrochemical interference and highly sensitive sensing applications. Using De-Fe(Ⅲ)-MOF as ULP ECL emitters, a low interference and sensitive ECL sensor was developed for monitoring CE as a model analyte, realizing a remarkable low detection limit of 6.6 × 10⁻⁷ U/L. This work therefore not only opens a promising avenue for the exploitation of ULP ECL systems, but also provides a low interference and highly sensitive sensor with minimal interference for the diagnosis of CE corresponding diseases.
Figure 1
Figure 1.
(A) Schematic illustration of the preparation of De-Fe(Ⅲ)-MOF via acid modulator-induced defect strategy. (B) SEM image for the De-Fe(Ⅲ)-MOF. (C) TEM image for De-Fe(Ⅲ)-MOF. (D) The corresponding EDS elemental mapping for De-Fe(Ⅲ)-MOF.
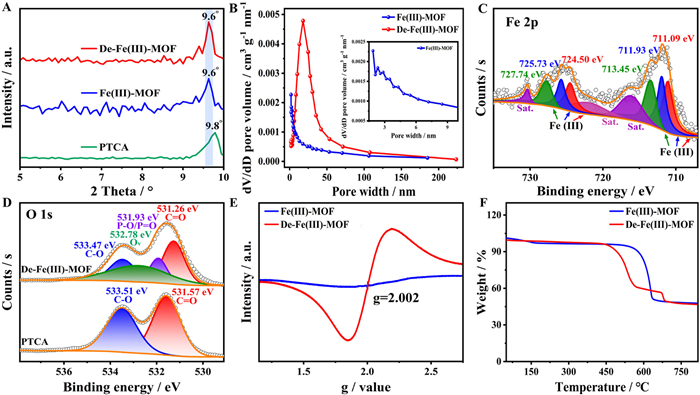
As revealed by scanning electron microscopy (SEM), unlike the nanobelts structure of raw PTCA (Fig. S1 in Supporting information) and compact sphere accompanied by nanobelts of undefect-regulated Fe(Ⅲ)-MOF (Fig. S2 in Supporting information), the De-Fe(Ⅲ)-MOF exhibited a thick rod-like structure with well dispersity (Fig. 1B), indicating the significant influence of the H3PO4 modulator on the formation of MOF. The transmission electron microscopy (TEM) images also indicated the rod-like structure of De-Fe(Ⅲ)-MOF (Fig. 1C), and the corresponding elemental mapping (Fig. 1D) showcased that C, O, Fe, and P elements were uniformly distributed. As illustrated in Fig. 2A and Fig. S3 (Supporting information), both the powder X-ray diffraction (PXRD) patterns for De-Fe(Ⅲ)-MOF and Fe(Ⅲ)-MOF exhibited distinct diffraction peaks at 9.6°, in contrast to the characteristic peak of PTCDA at 9.8°, confirming the successful assembly of crystalline framework. Notably, N2 adsorption analysis (Fig. 2B) revealed that De-Fe(Ⅲ)-MOF exhibits a substantially increased pore width (23.224 nm) compared to its defect-free counterpart Fe(Ⅲ)-MOF (18.177 nm). This pronounced difference in porosity not only validates the intrinsic porous nature of both materials but also provides direct evidence for the successful implementation of defect engineering in De-Fe(Ⅲ)-MOF. Compared to PTCA, both the Fe(Ⅲ)-MOF and De-Fe(Ⅲ)-MOF exhibit weak symmetric stretching vibration (vs) band at 583 cm-1 and antisymmetric stretching vibration (vas) at 785 cm-1 of their IR spectra (Fig. S4 in Supporting information) with its bands similar to the characteristic Fe(Ⅲ)-O vibration of the classical MIL-101(Fe(Ⅲ)) [29,30]. Additionally, the UV–vis diffuse reflectance spectroscopy (UV–vis DRS, Fig. S5 in Supporting information) of De-Fe(Ⅲ)-MOF exhibited a strong ligand-to-metal charge transfer (LMCT) band in the UV region (200–400 nm), characteristic of Fe(Ⅲ) centers, accompanied by broad d-d transition features spanning the visible range (400–755 nm). This spectral signature is consistent with the typical electronic transitions expected for high-spin Fe(Ⅲ) (3d5) in a ligand field, which is similar to the typical MIL-101 (Fe(Ⅲ)). The X-ray photoelectron spectroscopy (XPS) confirmed the presence of Fe, O, C, and P in De-Fe(Ⅲ)-MOF (Fig. S6 in Supporting information). The high-resolution Fe 2p spectrum (Fig. 2C) exhibited a spin-orbit doublet at 711.09 eV (Fe 2p3/2) and 724.50 eV (Fe 2p1/2), characteristic of Fe(Ⅲ)-O clusters. Two additional doublets at 711.93/725.73 eV and 713.45/727.74 eV were assigned to Fe(Ⅲ) binding with phosphonate (P=O/P-O) groups [31]. The O 1s spectrum (Fig. 2D) revealed a redshift from 531.57 eV (C=O) and 533.51 eV (C-O) in PTCA to 531.26 eV and 533.47 eV in De-Fe(Ⅲ)-MOF, indicative of electron density redistribution upon Fe(Ⅲ) coordination. In addition, the two peaks atrributed to the P=O and P-O coordination with Fe(Ⅲ) merged into one at 531.93 eV, further suggesting successful assembly of H3PO4 modulator on the De-Fe(Ⅲ)-MOF [32,33]. Besides, a new peak of oxygen vacancy (Ov) could be observed at 532.78 eV [34], suggesting the existence of oxygen vacancies in the De-Fe(Ⅲ)-MOF. Additionally, as illustrated in Fig. 2E, the electron paramagnetic resonance (EPR) signal of De-Fe(Ⅲ)-MOF at g = 2.002 were significantly increased compared to that of Fe(Ⅲ)-MOF, further indicating the presence of abundant Ov for De-Fe(Ⅲ)-MOF owing to the generating of active defect sites in De-Fe(Ⅲ)-MOF. The thermogravimetric (TG) curve (Fig. 2F) showed that De-Fe(Ⅲ)-MOF exhibited a lower temperature for weight loss initiation than that of Fe(Ⅲ)-MOF compared with Fe(Ⅲ)-MOF, which could be ascribed to the presence of defects rendering the De-Fe(Ⅲ)-MOF are more susceptible to thermal collapse.
Figure 2
Figure 2.
(A) The PXRD patterns of De-Fe(Ⅲ)-MOF (red line), Fe(Ⅲ)-MOF (blue line) and PTCA aggregates (green line). (B) Pore widths of De-Fe(Ⅲ)-MOF (red line) and Fe(Ⅲ)-MOF (blue line). (C) High-resolution XPS of Fe 2p for the De-Fe(Ⅲ)-MOF. (D) High-resolution XPS for O 1s of the De-Fe(Ⅲ)-MOF and PTCA. (E) EPR spectra for the De-Fe(Ⅲ)-MOF (red line) and Fe(Ⅲ)-MOF (blue line). (F) TG spectra of De-Fe(Ⅲ)-MOF (red line) and Fe(Ⅲ)-MOF (blue line).
Using readily available and highly π-conjugated PTCA as model ligand, Fe3+ as central metal ions, H3PO4 as effective acids modulators to control the growth and structural defects, De-Fe(Ⅲ)-MOF with an ultralow-potential (−0.3 V) and NIR ECL emissions (λmax = 728 nm) were prepared. The optimal experiments were exhibited in Figs. S7 and S8 (Supporting information). In air-saturated 0.1 mol/L PBS (pH 7.4) containing 20 mmol/L S2O82− as the co-reactant, ECL intensities exhibited the following order: De-Fe(Ⅲ)-MOF (17,710 a.u.) > De-Co(Ⅱ)-MOF (8928 a.u.) > De-Cu(Ⅱ)-MOF (8388 a.u.) > De-Zn(Ⅱ)-MOF (5687 a.u.) > De-Fe(Ⅱ)-MOF (4837 a.u.) > PTCA (1877 a.u.) (Fig. S9 in Supporting information), demonstrating the formation of MOF structures obviously enhances the ECL performance of PTCA. Moreover, the onset potential of De-Fe(Ⅲ)-MOF (−0.0623 V) > De-Co(Ⅱ)-MOF (−0.0922 V) > De-Cu(Ⅱ)-MOF (−0.0931 V) > De-Zn(Ⅱ)-MOF (−0.1233 V) > De-Fe(Ⅱ)-MOF (−0.1541 V) > PTCA (−0.1852 V) (Fig. S10 in Supporting information), which suggests that the onset potential of all of the prepared MOFs was lower than that of PTCA-based ECL, and the De-Fe(Ⅲ)-MOF possesses the lowest onset potential, suggesting the easily injecting electrons into their LUMO to produce De-Fe(Ⅲ)-MOF•−. Obviously, all the ECL intensities of H3PO4, CH3COOH, HCOOH, HCI, TFA, and BA as modulator regulated De-Fe(Ⅲ)-MOF were higher than that of pristine Fe(Ⅲ)-MOF and PTCA (Fig. S11 in Supporting information), in especial the H3PO4-regulated De-Fe(Ⅲ)-MOF, which indicates the acid-assisted defect-engineering of MOF could enhance the ECL performance for the Fe(Ⅲ)-MOF. Therefore, acid-mediated defect engineering of PTCA-based MOFs could trigger high-efficient and ultralow-potential electrochemiluminescence, which paves a prospective pathway toward for the construction of superior sensitivity and swift response ECL sensors.
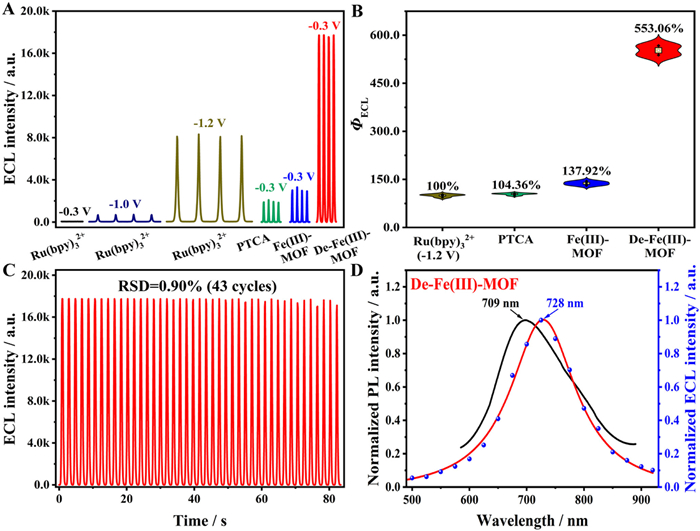
The ECL signal of De-Fe(Ⅲ)-MOF/S2O82− is significantly higher than those of the Fe(Ⅲ)-MOF/S2O82− (Fig. 3A) system in the range of 0 V to −0.3 V and classical Ru(bpy)3Cl2/S2O82− system. To further quantitatively assess the ECL performance, we systematically measured the ECL efficiencies (ΦECL) for the De-Fe(Ⅲ)-MOF/S2O82− system, Fe(Ⅲ)-MOF/S2O82− system and PTCA/S2O82− system as follows (Eq. 1) [35,36]:
∅ECL=(∫0tIECLdt∫0tidt)x(∫0tIECLdt∫0tidt)st×100%
(1)
where i and IECL represent electrochemical current and ECL intensity, respectively. According to the calculation, the ECL efficiency of De-Fe(Ⅲ)-MOF/S2O82− system were increased 4.01-folds and 5.30-folds than those of pristine Fe(Ⅲ)-MOF/S2O82− system and PTCA/S2O82− system, respectively (Fig. 3B, see Supporting information for detail calculation). Given that the standard of Ru(bpy)3Cl2/S2O82− could not produce ECL signals at −0.3 V, the ECL signals of Ru(bpy)3Cl2/S2O82− system at a higher excitation potential at −1.2 V were chosen as the reference standard. In contrast, the ECL signals of De-Fe(Ⅲ)-MOF/S2O82− system, Fe(Ⅲ)-MOF/S2O82− system and PTCA/S2O82− were collected by scanning potential from 0 to −0.3 V. Despite the inherent unfair in the excitation potentials, the De-Fe(Ⅲ)-MOF/S2O82− system showcased the highest ECL efficiency of 553.06% (Fig. 3B, see Supporting information for detail calculation). Additionally, the ECL of the De-Fe(Ⅲ)-MOF/S2O82− system under the ultralow-triggered-potential at −0.3 V remained stable over 43 continuous cycles with a relative standard deviation (RSD) of only 0.90% (Fig. 3C), which indicates an ultralow-potential triggered, highly repeatable, and stable ECL for De-Fe(Ⅲ)-MOF/S2O82− system could obtained via the acid-assisted defect-engineering strategy, advancing less interference and trace sensing applications. Excitingly, unlike the ECL peak for the Fe(Ⅲ)-MOF/S2O82− system (λmax = 717 nm, Fig. S12A in Supporting information) and PTCA/S2O82− (λmax = 720 nm, Fig. S12B in Supporting information), the De-Fe(Ⅲ)-MOF/S2O82− system showcased an near-infrared ECL emission (λmax = 728 nm, Fig. 3D), which is attributed to the influence of H3PO4 modulator, paving prospective NIR ECL emitters for lower background interference and longer penetration depth sensing and imaging.
Figure 3
Figure 3.
(A) The ECL intensity-time curves and (B) ECL efficiency relative to Ru(bpy)3Cl2 for the PTCA, Fe(Ⅲ)-MOF, De-Fe(Ⅲ)-MOF and Ru(bpy)3Cl2 (−1.2 V) in 0.1 mol/L PBS (pH 7.4) involving 20 mmol/L S2O82−. (C) ECL intensity-times curves for De-Fe(Ⅲ)-MOF/S2O82− system under continuous 43 cycles. Above the ECL measurements were collected by scanning from 0 V to −0.3 V (PMT = 930, scan rate as 0.3 V/s, and magnification series as 3). (D) ECL spectra (red curve) and FL (λex = 565 nm, black curve) for the De-Fe(Ⅲ)-MOF.
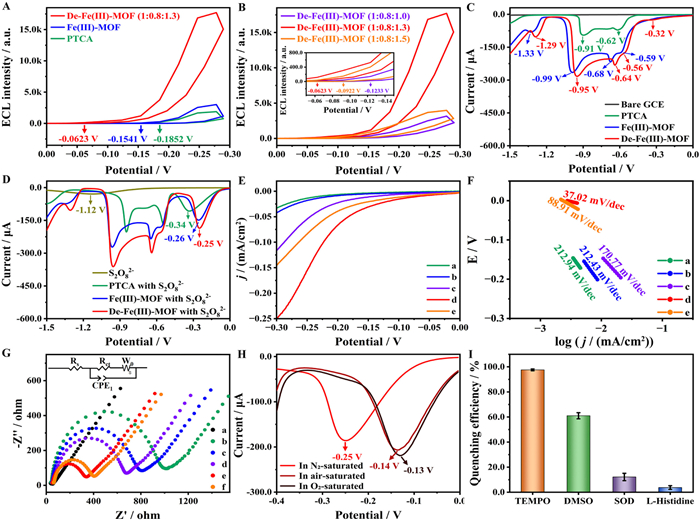
The enhancing mechanism was investigated in depth. The PL intensity for De-Fe(Ⅲ)-MOF (48,710 a.u., Fig. S13 in Supporting information, red line) and Fe(Ⅲ)-MOF (46,450 a.u., blue line) was 1.23 times and 1.17 times compared to that of PTCA aggregates (39,866 a.u., green line), respectively. This phenomenon is due to the decreasing of ACQ effect arising from strong π-π interaction with the intrinsic porous nature of Fe(Ⅲ)-MOF and De-Fe(Ⅲ)-MOF. In air-saturated 0.1 mol/L PBS (pH 7.4) containing 20 mmol/L S2O82− as the co-reactant, the onset potential of De-Fe(Ⅲ)-MOF (−0.0623 V) was markedly lower than those of Fe(Ⅲ)-MOF (−0.1541 V) and PTCA (−0.1852 V) (Fig. 4A), indicating facilitated electron injection into the LUMO of De-Fe(Ⅲ)-MOF to generate De-Fe(Ⅲ)-MOF•−. Furthermore, as depicted in Fig. 4B, De-Fe(Ⅲ)-MOF modulated with optimal H3PO4 (1:0.8:1.3) exhibited a more positive onset potential (−0.0623 V) compared to those with higher (−0.0922 V, 1:0.8:1.5) or lower (−0.1233 V, 1:0.8:1) H3PO4 ratios, suggesting the critical role of defect engineering via acidic modulation in tuning the redox behavior of De-Fe(Ⅲ)-MOF. The first reduction peak Fe(Ⅲ)-MOF had a more positive reduction peak and distinct reduction current compared with PTCA aggregates (Fig. 4C), which indicates that electrons can be more easily and quickly injected into the lowest unoccupied molecular orbital of Fe(Ⅲ)-MOF than that of PTCA aggregates. Moreover, a distinct reductive peak current for S2O82− was observed at −1.12 V (vs. Ag/AgCl) on a bare GCE (Fig. 4D). Remarkably, in the presence of PTCA aggregates, the reduction potential for S2O82− to SO4•− shifted dramatically to −0.34 V (sharply shifted 0.78 V) with a concurrent current enhancement, highlighting the superior capability of PTCA in activating S2O82−. Notably, upon integration Fe(Ⅲ)-MOF and De-Fe(Ⅲ)-MOF into GCE, the reduction potential further shifted positively to −0.26 V and −0.25 V, respectively, accompanied by a progressive increase in current. These findings demonstrate that Fe(Ⅲ) centers exhibit remarkable electrocatalytic activity toward S2O82− activation, and the defect-engineered De-Fe(Ⅲ)-MOF, featuring enhanced exposure of open Fe(Ⅲ) sites compared to its pristine Fe(Ⅲ)-MOF, facilitates more efficient electron injection at low potential. Therefore, the low operating potential originates from the synergistic interaction between the electron-deficient PTCA ligand and defect-rich Fe(Ⅲ)-MOF. Additionally, the linear sweep voltammetry (LSV) curves in Fig. 4E showcased the De-Fe(Ⅲ)-MOF (1:0.8:1.3, red curve) with optimal H3PO4 modulator had the most positive onset potential and highest reduction current and the catalytic activity followed the sequence of De-Fe(Ⅲ)-MOF (1:0.8:1.3) > De-Fe(Ⅲ)-MOF (1:0.8:1.5) > De-Fe(Ⅲ)-MOF (1:0.8:1) > Fe(Ⅲ)-MOF > PTCA, which suggests that the H3PO4 modulator had a vital effect on the catalytic activity for the De-Fe(Ⅲ)-MOF. Additionally, the corresponding Tafel slope (Fig. 4F) were acquired by LSV curves manifested the De-Fe(Ⅲ)-MOF with optimal H3PO4 modulator (1:0.8:1.3) had a smallest Tafel slope of 37.02 mV/dec than those of De-Fe(Ⅲ)-MOF (1:0.8:1.5, 88.91 mV/dec), De-Fe(Ⅲ)-MOF (1:0.8:1, 170.77 mV/dec), Fe(Ⅲ)-MOF (212.43 mV/dec), and PTCA (212.94 mV/dec), which indicates that the De-Fe(Ⅲ)-MOF with optimal H3PO4 modulator (1:0.8:1.3) possesses highest electrocatalytic reaction kinetics, and the H3PO4 modulator strategy significantly enhances the electrocatalytic reaction kinetics of De-Fe(Ⅲ)-MOF. Moreover, the electrochemical impedance spectroscopy (EIS) results (Fig. 4G) exhibited that De-Fe(Ⅲ)-MOF(1:0.8:1.3) had smaller semicircles than those of De-Fe(Ⅲ)-MOF (1:0.8:1.5), De-Fe(Ⅲ)-MOF (1:0.8:1), Fe(Ⅲ)-MOF and PTCA, which suggests a smallest charge transfer resistance (Rct) and highest charge transfer kinetics (see detailed Rct in Table S1 in Supporting information) of De-Fe(Ⅲ)-MOF(1:0.8:1.3). Therefore, H3PO4 modulator-induced defect strategy to create open-metal catalytic sites contributes a vital role to the high-efficient and an ultralow potential (−0.3 V vs. Ag/AgCl) of De-Fe(Ⅲ)-MOF, which ascribes the reduction of ACQ to improve the emission efficiency, and the dramatical electrocatalytic activity toward S2O82− co-reactants to trigger efficient electrochemical excitation.
Figure 4
Figure 4.
(A) ECL intensity-potential curves of the De-Fe(Ⅲ)-MOF, Fe(Ⅲ)-MOF and PTCA in 0.1 mol/L PBS (pH 7.4) involving 20 mmol/L S2O82−. (B) ECL intensity-potential curves of the De-Fe(Ⅲ)-MOF (1:0.8:1), De-Fe(Ⅲ)-MOF (1:0.8:1.3) and De-Fe(Ⅲ)-MOF (1:0.8:1.5) in 0.1 mol/L PBS (pH 7.4) involving 20 mmol/L S2O82−. Above the ECL measurements were collected by scanning from 0 V to −0.3 V (PMT = 930, scan rate as 0.3 V/s, and magnification series as 3). (C) DPV curves for the bare GCE, PTCA, Fe(Ⅲ)-MOF, and De-Fe(Ⅲ)-MOF in 0.1 mol/L PBS (pH 7.4). (D) DPV curves for the bare GCE, PTCA, Fe(Ⅲ)-MOF, and De-Fe(Ⅲ)-MOF in 0.1 mol/L PBS (pH 7.4) containing 20 mmol/L S2O82−. (E) LSV curves of the PTCA aggregates (a), Fe(Ⅲ)-MOF (b), De-Fe(Ⅲ)-MOF (1:0.8:1) (c), De-Fe(Ⅲ)-MOF (1:0.8:1.3) (d), and De-Fe(Ⅲ)-MOF (1:0.8:1.5) (e) in 0.1 mol/L PBS (pH 7.4). (F) Tafel slopes of the PTCA aggregates (a), Fe(Ⅲ)-MOF (b), De-Fe(Ⅲ)-MOF (1:0.8:1) (c), De-Fe(Ⅲ)-MOF (1:0.8:1.3) (d) and De-Fe(Ⅲ)-MOF (1:0.8:1.5) (e) in 0.1 mol/L PBS (pH 7.4). (G) EIS Nyquist plots of the bare GCE (a), PTCA aggregates (b), Fe(Ⅲ)-MOF (c), De-Fe(Ⅲ)-MOF (1:0.8:1) (d), De-Fe(Ⅲ)-MOF (1:0.8:1.3) (e) and De-Fe(Ⅲ)-MOF (1:0.8:1.5) (f) in 0.1 mol/L PBS (pH 7.4) containing 5.0 mmol/L [Fe(CN)6]3-/4−. (H) DPV curves of De-Fe(Ⅲ)-MOF in N2-saturated, air-saturated, and O2-saturated conditions in 0.1 mol/L PBS (pH 7.4) containing 20 mmol/L S2O82−. (I) Quenching efficiency of different radical quenchers on the ECL of De-Fe(Ⅲ)-MOF/S2O82− system. All the materials concentration was used 1 mg/mL for both sets of measurements.
To gain deeper mechanistic insights into the De-Fe(Ⅲ)-MOF/ S2O82− system, the possible ECL mechanism was systematically investigated. As depicted in Fig. 4H and Fig. S14 (Supporting information), the De-Fe(Ⅲ)-MOF/GCE in N2-saturated electrolyte exhibited a well-defined reduction peak at −0.25 V, corresponding to the direct reduction of S2O82−. In contrast, under air- and O2-saturated conditions, additional redox peaks emerged at −0.14 V and −0.13 V, respectively, with the current intensity increasing with oxygen concentration. These results clearly confirm that the peak at −0.25 V originates from the electrocatalytic reduction of S2O82− rather than reactive oxygen species (ROS). The ECL signals in N2-saturated PBS were higher than those observed in air- and O2-saturated PBS (Fig. S15 in Supporting information). To identify the key radical species involved, scavenger experiments were performed using TEMPO (for SO4•−), DMSO (for •OH), superoxide dismutase (SOD, for O2•−) and l-histidine (for 1O2). As depicted in Fig. 4I, the suppression of ECL by TEMPO and DMSO confirmed the synergistic reaction of SO4•- and •OH with De-Fe(Ⅲ)-MOF•- to generate the excited-state species De-Fe(Ⅲ)-MOF. Based on these findings, a possible mechanism for the De-Fe(Ⅲ)-MOF/S2O82− ECL systems is as following.
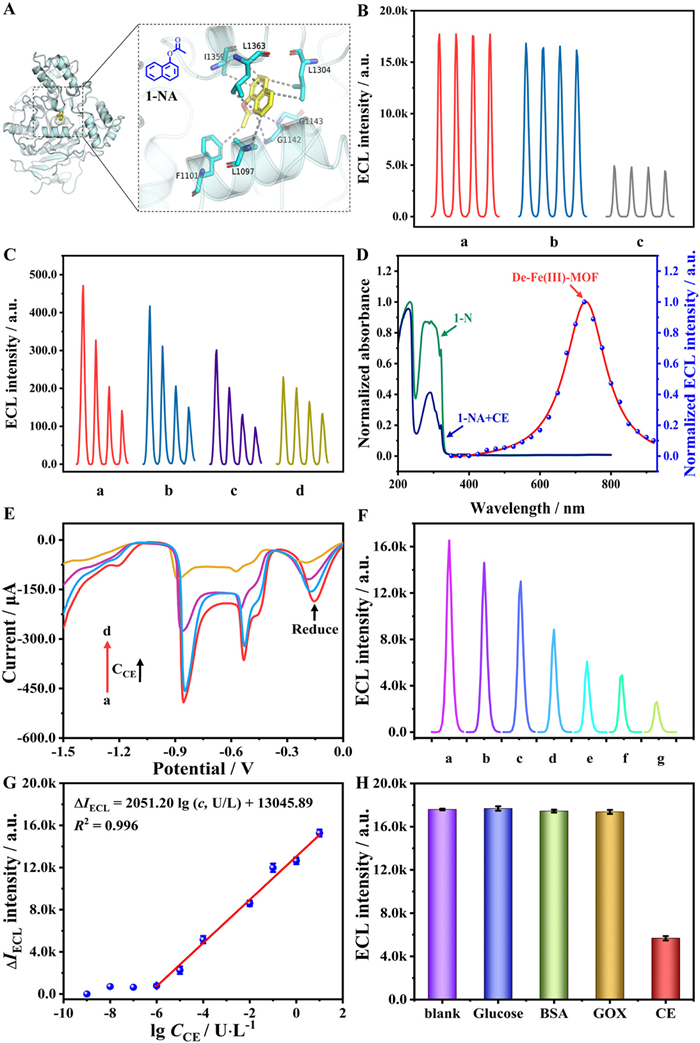
Carboxylesterase (CE, EC 3.1.1.1), is reported as a promising serological biomarker for hepatocellular carcinoma (HCC) with improving accuracy and sensitivity than classical clinical biomarker of AFP [37,38]. The sensitive and specific detection of CE activity relies on the intelligent signal conversion triggered by CE. Because of the inherent and efficient hydrolysis behavior of CE towards ester group, phenylacetate (PA), 1-naphthyl acetate (1-NA), phenyl propanoate (PP), and 1-naphthyl propionate (1-NP) were screened as potential substrates. In the absence of CE, PA, 1-NA, and PP have no influence on the De-Fe(Ⅲ)-MOF/S2O82− system (Fig. S16A in Supporting information), whereas the 1-NP significantly reduced the ECL signal of De-Fe(Ⅲ)-MOF/S2O82−, thus 1-NP cannot be meet the essential condition is that the substrates cannot quench the ECL signal of De-Fe(Ⅲ)-MOF without the action of CE. Compared to PA and PP as substrates, the 1-NA quenched the ECL intensity of De-Fe(Ⅲ)-MOF/S2O82− significantly in the presence of 0.1 U/L of CE (Fig. S16B in Supporting information). The affinity of PA, 1-NA, PP, and CE (PDB: pdb:1MX5) was assessed through molecular docking simulation (Table S2 in Supporting information). As exhibited in Fig. 5A and Fig. S17 (Supporting information), 1-NA possess a smallest binding free energy (−7.7 kcal/mol) than those of PP (−6.816 kcal/mol) and PA (−6.562 kcal/mol), which is consistent with the quenching tendencies towards De-Fe(Ⅲ)-MOF/S2O82− ECL system. The strong interaction between 1-NA and CE is attributed to the formation of hydrogen bond with GLY-1142, GLY-1143 and the strong hydrophobic interaction with ILE-1359, LEU-1363, LEU-1097, LEU-1304, and PHE-1101 on CE protein, which makes the 1-NA has preferable affinity with CE.
Figure 5
Figure 5.
(A) Binding mode of 1-NA to CE (PDB: 1MX5). (B) ECL signal for the (a) De-Fe(Ⅲ)-MOF, (b) De-Fe(Ⅲ)-MOF + 0.3 mmol/L 1-NA, and (c) De-Fe(Ⅲ)-MOF + 0.3 mmol/L 1-NA + 1 U/L CE in 0.1 mol/L PBS (pH 7.4) containing 20 mmol/L S2O82−. (C) ECL signal of (a) De-Fe(Ⅲ)-MOF, (b) De-Fe(Ⅲ)-MOF + 0.3 mmol/L 1-NA + 10–4 U/L CE, (c) De-Fe(Ⅲ)-MOF + 0.3 mmol/L 1-NA + 10–2 U/L CE, and (d) De-Fe(Ⅲ)-MOF + 0.3 mmol/L 1-NA + 1 U/L CE in PBS (0.1 mol/L, pH 7.4). (D) UV/vis for the 1-N (cyan curve), the reacted solution of CE and 1-NA with scanning from 0 to −0.3 V (blue curve), and ECL spectra of De-Fe(Ⅲ)-MOF (red curve). (E) DPV curves of the bare GCE in 0.1 mol/L PBS (pH 7.4), including 20 mmol/L S2O82−, 0.3 mmol/L 1-NA and (a) 0, (b) 1 × 10⁻⁴, (c) 1 × 10⁻², and (d) 1 U/L CE. (F) ECL signals of the sensor with different CE activities: (a) 1 × 10⁻⁶, (b) 1 × 10⁻⁵, (c) 1 × 10⁻⁴, (d) 1 × 10⁻², (e) 1 × 10⁻¹, (f) 1, and (g) 10 U/L. (G) Calibration plot for the monitoring for the CE activity. (H) The specificity of the sensor.
Additionally, we have investigated the ECL quenching mechanism in detail. As shown in Fig. 5B, introduction of CE to the De-Fe(Ⅲ)-MOF/S2O82− system containing 1-NA induces significant ECL quenching of De-Fe(Ⅲ)-MOF/S2O82− system, whereas 1-NA alone produces negligible signal perturbation. This confirms that hydrolysis products could significantly quench the De-Fe(Ⅲ)-MOF/S2O82− ECL system. Further mechanistic studies (Fig. 5C) reveal that under without S2O82−, the ECL intensity of De-Fe(Ⅲ)-MOF (curve a) is progressively reduced with increasing CE concentration (curves b, c, d), suggesting the annihilation of the excited-state species of De-Fe(Ⅲ)-MOF with the occurrence of enzymatic hydrolysis between CE and 1-NA. Additionally, the lack of spectral overlap between the UV–vis absorption of 1-naphthol (1-N) or its products in ECL reaction and ECL emission spectra (Fig. 5D) precludes resonance energy transfer as the quenching pathway. Furthermore, DPV analysis (Fig. 5E) demonstrates that with the increasing of CE concentration, the reduction current of S2O82− to SO4•− diminishes, indicating that the hydrolysis products of 1-NA with CE could consume SO4•−, thereby attenuating generation of excited-state of De-Fe(Ⅲ)-MOF. Consequently, deactivation of the excited-state De-Fe(Ⅲ)-MOF and scavenging of SO4•− are two key factors in the ECL quenching mechanism.
In virtue of ultralow-potential ECL performance of the De-Fe(Ⅲ)-MOF/S2O82− system and the quenching effect of the CE driven specific substrate-hydrolysis enzymatic reaction, a label-free signal-off sensor with sensitivity for the determination of CE activity was constructed. As the CE activity increases, the ECL intensity dramatically decreased (Fig. 5F). Moreover, as exhibited in Fig. 5G, the reduced ECL signals (ΔIECL = Iblank - I) exhibits a linear relationship with the logarithm of CE activity ranging from 1 × 10⁻⁶ U/L to 1 U/L and corresponding linear regression equation is expressed as ΔIECL = 2051.20lg(c, U/L) + 13,045.89 (R2 = 0.996). The detection limit of the CE activity for this sensor was estimated to 6.6 × 10⁻⁷ U/L. Specificity is a crucial evaluation criterion for the sensing performance of the sensor. Therefore, the selectivity of this sensing platform was investigated by selecting potential interfering substances, including glucose, bovine serum albumin (BSA), and glucose oxidase (GOX). Even at higher concentrations (1 g/L), these interferences have negligible impact compared with the blank sample (Fig. 5H), whereas at low CE concentrations (0.006 mg/L), there is a significant ECL decrease owing to the CE-driven specific catalytic hydrolysis of 1-NA to naphthol that could significantly quench the ECL system via the consumption of active SO4•−. Therefore, the sensitive and low interference sensor for the detection of CE activity was constructed, paves a promising avenue for the diagnosis of HCC.
In summary, a high-efficient and ultralow-potential-triggered cathodic electrochemiluminescence of De-Fe(Ⅲ)-MOF/S2O82− system was prepared via an easy-to-operate acid modulator-induced defect strategy and electron-deficient-ligand of PTCA. Significantly, the De-Fe(Ⅲ)-MOF showcased boosted cathodic ECL efficiency of 553.06%, even using classical Ru(bpy)3Cl2/S2O82− system triggered at −1.2 V as a standard. This outstanding performance can be attributed to three pivotal factors: (1) The abundant Fe(Ⅲ) active sites efficiently catalyze the co-reaction of S2O82− to generate a substantial amount of active SO4•− radicals even at ultralow excitation potentials of −0.25 V vs. Ag/AgCl (sharply shifted 0.87 V); (2) the electron-deficient PTCA ligand enables its electrochemical reduction to occur simultaneously at similarly low excitation potentials, and (3) the unified porous frame of the De-Fe(Ⅲ)-MOF allows the active radicals to instigate efficient electron transfer through an ultrashort charge transfer pathway, thereby markedly enhancing the ECL efficiency at ultralow potentials. These features collectively minimize electrochemical side reactions and significantly enhance the sensitivity of the sensing platform. Using De-Fe(Ⅲ)-MOF as ULP ECL emitters, a low interference and sensitive CE activity sensor was developed possessing limit of detection 6.6 × 10⁻⁷ U/L. Therefore, this work offers a promising way for the exploitation of ULP ECL systems, also paves a low interference and highly sensitive sensor for the diagnosis of CE corresponding diseases.
Declaration of competing interest
The authors declare that they have no known competing financial interests or personal relationships that could have appeared to influence the work reported in this paper.
This work was supported by the National Natural Science Foundation of China (Nos. 22278112, and 22404041), and Henan Province Science and Technology Research Project (No. 252102311024).
Supplementary materials
Supplementary material associated with this article can be found, in the online version, at doi:10.1016/j.cclet.2025.112310.
[1]
T.T. Zhao, Q. Zhou, Y.Q. Lv, et al., Angew. Chem. Int. Ed. 59 (2020) 1139–1143. doi: 10.1002/anie.201911822
[2]
Z.C. Wu, J. Wen, Y. Qin, et al., Angew. Chem. Int. Ed. 62 (2023) e202308257. doi: 10.1002/anie.202308257
[3]
L.F. Chen, D.J. Hayne, E.H. Doeven, et al., Chem. Sci. 10 (2019) 8654–8667. doi: 10.1039/c9sc01391a
N. Gao, H. Zeng, X.F. Wang, et al., Angew. Chem. Int. Ed. 61 (2022) e202204485. doi: 10.1002/anie.202204485
[37]
Y. Wen, N. Jing, M. Zhang, et al., Adv. Sci. 10 (2023) 2206681. doi: 10.1002/advs.202206681
[38]
X.F. Wu, R. Wang, S.J. Qi, et al., Angew. Chem. Int. Ed. 60 (2021) 15418–15425. doi: 10.1002/anie.202101190
Figure 1
(A) Schematic illustration of the preparation of De-Fe(Ⅲ)-MOF via acid modulator-induced defect strategy. (B) SEM image for the De-Fe(Ⅲ)-MOF. (C) TEM image for De-Fe(Ⅲ)-MOF. (D) The corresponding EDS elemental mapping for De-Fe(Ⅲ)-MOF.
Figure 2
(A) The PXRD patterns of De-Fe(Ⅲ)-MOF (red line), Fe(Ⅲ)-MOF (blue line) and PTCA aggregates (green line). (B) Pore widths of De-Fe(Ⅲ)-MOF (red line) and Fe(Ⅲ)-MOF (blue line). (C) High-resolution XPS of Fe 2p for the De-Fe(Ⅲ)-MOF. (D) High-resolution XPS for O 1s of the De-Fe(Ⅲ)-MOF and PTCA. (E) EPR spectra for the De-Fe(Ⅲ)-MOF (red line) and Fe(Ⅲ)-MOF (blue line). (F) TG spectra of De-Fe(Ⅲ)-MOF (red line) and Fe(Ⅲ)-MOF (blue line).
Figure 3
(A) The ECL intensity-time curves and (B) ECL efficiency relative to Ru(bpy)3Cl2 for the PTCA, Fe(Ⅲ)-MOF, De-Fe(Ⅲ)-MOF and Ru(bpy)3Cl2 (−1.2 V) in 0.1 mol/L PBS (pH 7.4) involving 20 mmol/L S2O82−. (C) ECL intensity-times curves for De-Fe(Ⅲ)-MOF/S2O82− system under continuous 43 cycles. Above the ECL measurements were collected by scanning from 0 V to −0.3 V (PMT = 930, scan rate as 0.3 V/s, and magnification series as 3). (D) ECL spectra (red curve) and FL (λex = 565 nm, black curve) for the De-Fe(Ⅲ)-MOF.
Figure 4
(A) ECL intensity-potential curves of the De-Fe(Ⅲ)-MOF, Fe(Ⅲ)-MOF and PTCA in 0.1 mol/L PBS (pH 7.4) involving 20 mmol/L S2O82−. (B) ECL intensity-potential curves of the De-Fe(Ⅲ)-MOF (1:0.8:1), De-Fe(Ⅲ)-MOF (1:0.8:1.3) and De-Fe(Ⅲ)-MOF (1:0.8:1.5) in 0.1 mol/L PBS (pH 7.4) involving 20 mmol/L S2O82−. Above the ECL measurements were collected by scanning from 0 V to −0.3 V (PMT = 930, scan rate as 0.3 V/s, and magnification series as 3). (C) DPV curves for the bare GCE, PTCA, Fe(Ⅲ)-MOF, and De-Fe(Ⅲ)-MOF in 0.1 mol/L PBS (pH 7.4). (D) DPV curves for the bare GCE, PTCA, Fe(Ⅲ)-MOF, and De-Fe(Ⅲ)-MOF in 0.1 mol/L PBS (pH 7.4) containing 20 mmol/L S2O82−. (E) LSV curves of the PTCA aggregates (a), Fe(Ⅲ)-MOF (b), De-Fe(Ⅲ)-MOF (1:0.8:1) (c), De-Fe(Ⅲ)-MOF (1:0.8:1.3) (d), and De-Fe(Ⅲ)-MOF (1:0.8:1.5) (e) in 0.1 mol/L PBS (pH 7.4). (F) Tafel slopes of the PTCA aggregates (a), Fe(Ⅲ)-MOF (b), De-Fe(Ⅲ)-MOF (1:0.8:1) (c), De-Fe(Ⅲ)-MOF (1:0.8:1.3) (d) and De-Fe(Ⅲ)-MOF (1:0.8:1.5) (e) in 0.1 mol/L PBS (pH 7.4). (G) EIS Nyquist plots of the bare GCE (a), PTCA aggregates (b), Fe(Ⅲ)-MOF (c), De-Fe(Ⅲ)-MOF (1:0.8:1) (d), De-Fe(Ⅲ)-MOF (1:0.8:1.3) (e) and De-Fe(Ⅲ)-MOF (1:0.8:1.5) (f) in 0.1 mol/L PBS (pH 7.4) containing 5.0 mmol/L [Fe(CN)6]3-/4−. (H) DPV curves of De-Fe(Ⅲ)-MOF in N2-saturated, air-saturated, and O2-saturated conditions in 0.1 mol/L PBS (pH 7.4) containing 20 mmol/L S2O82−. (I) Quenching efficiency of different radical quenchers on the ECL of De-Fe(Ⅲ)-MOF/S2O82− system. All the materials concentration was used 1 mg/mL for both sets of measurements.
Figure 5
(A) Binding mode of 1-NA to CE (PDB: 1MX5). (B) ECL signal for the (a) De-Fe(Ⅲ)-MOF, (b) De-Fe(Ⅲ)-MOF + 0.3 mmol/L 1-NA, and (c) De-Fe(Ⅲ)-MOF + 0.3 mmol/L 1-NA + 1 U/L CE in 0.1 mol/L PBS (pH 7.4) containing 20 mmol/L S2O82−. (C) ECL signal of (a) De-Fe(Ⅲ)-MOF, (b) De-Fe(Ⅲ)-MOF + 0.3 mmol/L 1-NA + 10–4 U/L CE, (c) De-Fe(Ⅲ)-MOF + 0.3 mmol/L 1-NA + 10–2 U/L CE, and (d) De-Fe(Ⅲ)-MOF + 0.3 mmol/L 1-NA + 1 U/L CE in PBS (0.1 mol/L, pH 7.4). (D) UV/vis for the 1-N (cyan curve), the reacted solution of CE and 1-NA with scanning from 0 to −0.3 V (blue curve), and ECL spectra of De-Fe(Ⅲ)-MOF (red curve). (E) DPV curves of the bare GCE in 0.1 mol/L PBS (pH 7.4), including 20 mmol/L S2O82−, 0.3 mmol/L 1-NA and (a) 0, (b) 1 × 10⁻⁴, (c) 1 × 10⁻², and (d) 1 U/L CE. (F) ECL signals of the sensor with different CE activities: (a) 1 × 10⁻⁶, (b) 1 × 10⁻⁵, (c) 1 × 10⁻⁴, (d) 1 × 10⁻², (e) 1 × 10⁻¹, (f) 1, and (g) 10 U/L. (G) Calibration plot for the monitoring for the CE activity. (H) The specificity of the sensor.


 DownLoad:

 下载:
下载:


 下载:
下载:

