Citation:
Hanchun Chen, Mingyi Liu, Haodong Ji. Principle of excited state defluorination for perfluorocarboxylic acids in photolysis reaction[J]. Chinese Chemical Letters,
2026, 37(7): 112273.
doi:
10.1016/j.cclet.2025.112273
Principle of excited state defluorination for perfluorocarboxylic acids in photolysis reaction
English
Principle of excited state defluorination for perfluorocarboxylic acids in photolysis reaction
Eco-environment and Resource Efficiency Research Laboratory, School of Environment and Energy, Peking University Shenzhen Graduate School, Shenzhen 518055, China
* Corresponding author. E-mail address: jihaodong@pku.edu.cn (H. Ji). 1 These authors contributed equally to this work.
Received Date:
22 May 2025 Accepted Date:
11 December 2025 Revised Date:
17 November 2025 Available Online:
15 July 2026
Abstract:
The degradation of perfluorocarboxylic acids (PFCAs), persistent organic pollutants, remains a significant environmental challenge. Photolysis represents a key pathway for their degradation, yet the molecular mechanisms driving defluorination and decarboxylation remain unclear. This study investigates the first step of direct PFCA photolysis by analyzing excitation properties using density functional theory (DFT), aiming to elucidate the relationship between electronic structure changes and degradation pathways. To better demonstrate and analyze the impact of internal factors on the first step of PFCAs photolysis, quantum chemical calculations were conducted to quantify and compare the molecule’s properties in the ground state and the excited state, aiming to explore the changes in the molecule’s behavior. Key parameters, including α C–F bond elongation (0.31%–1.62%), α C–C bond contraction (−6.23% to −9.10%), and excitation energy reduction (5.76–5.47 eV), revealed chain-length-dependent trends. The lower bond dissociation energy of α C–C (90–93 kcal/mol) compared to α C–F (116–124 kcal/mol) rationalized the dominance of decarboxylation over defluorination. Charge transfer spectroscopy further indicated localized n → π* excitation at carboxyl groups, promoting decarboxylation. A quantitative structure-activity relationship (QSAR) model linking hole-electron indices to degradation rates (R2 = 0.91) was developed and validated via leave-one-out cross-validation (RMSE = 0.338). These findings not only advance the mechanistic understanding of PFCA photolysis but also provide a predictive tool for optimizing UV-based water treatment systems targeting persistent fluorinated pollutants.
Perfluorocarboxylic acids (CnF2n+1COOH, PFCAs), as the common persistent organic pollutants among perfluorinated compounds [1], are synthetic and widely used in daily life and industrial fields as surfactants additives, waterproofing, oil repellent intermediates, etc. [2], due to its chemical stability, strong surface activity, and their hydrophobic and oleophobic properties. The widespread use of related products has led to the detection of PFCAs in a number of environmental matrices, including the aquatic environment, soil, human blood, and wildlife [3-8]. For the environmental persistence, bioaccumulation, and toxicity of PFCAs [9-11], the pollution problems of PFCAs have attracted the attention of various countries, which have implemented various policies and terms to either standardize or limit the production of PFCAs. The perfluorooctanoic acid (PFOA) Stewardship program was initiated by the United States Environmental Protection Agency with the aim of reducing PFOA emissions [12]. In 2009, PFCAs were included in the Stockholm Convention’s list of persistent organic pollutants (POPs) [13]. The C11–C14 PFCAs were designated as vPvB substances in 2012, leading to their inclusion in the Candidate List of Substances of Very High Concern under the European chemicals regulation known as REACH [14]. Subsequently, in 2021, the European Union revised the provisions set forth in Regulation (EU) 2021/1297 [15], which stipulate the requisite restrictions for C9–C14 PFCAs, including salt forms and any combinations thereof. Therefore, how to deal with the existing PFCAs in the environment has become a hot topic.
At present, the main methods for removing PFCAs are: (1) Physical removal: adsorption [16], coagulation [17] and membrane separation [18], (2) biodegradation [19], (3) thermochemical degradation: thermolysis [20] and sonolysis [21], (4) electrochemical degradation [22], and (5) photochemical degradation: direct photolysis, photochemical oxidation, photochemical reduction [23-28], etc. Direct photolysis methods have been extensively studied, which have the advantages of simple operation, high efficiency, and low secondary pollution, while the disadvantages are low reaction rate and low degradation rate [29]. In various studies, it has been proved that the main photolysis path of PFCAs is decarboxylation and defluorination [24,30], and the shorter chains of PFCAs are mainly photodegradation products [31], as shown in Eqs. 1 and 2 [23,31].
Apparently, the investigation of excitation in photolysis experiments touches the essence of the photolysis reaction and could provide theoretical support for the mechanism behind the reaction. Furthermore, it is also a reliable theoretical support for the photodegradation of PFCAs, exploring the possible photolysis in the natural environment and understanding the substantial changes that occur in its photodegradation from its role as a pollutant [32-34]. Therefore, in this study, the transformation of PFCAs (C2–C14) from the ground state (S0) to the excited state was mainly investigated, (1) the fundamental properties of the excitation of PFCAs were investigated through computational chemistry; (2) the states and mechanisms of the excitation of the molecules were subjected to in-depth analysis; (3) photolysis reaction pathways such as defluorination and decarboxylation were explored and discussed; (4) quantitative structure-activity relationship (QSAR) models were constructed to illustrate the effect of the process of excitation on decomposition. The findings of this paper contribute to a more comprehensive figuring out of the decomposition and enrichment processes of PFCAs in natural environments. Furthermore, facilitating the integration of laboratory and field studies.
The data of direct photolysis of PFCAs were collected from the related studies of Xin et al. and Qu et al. [35,36], mainly the degradation rate of the molecules as well as the defluorination rate, and the detailed information can be found in the Table S1 (Supporting information). The theoretical calculations were performed using the Gaussian 16 C.01 program [37], and the details are presented in Text S1 (Supporting information). Based on the calculated results, Multiwfn 3.8(dev) [38] was used to further carry out the hole-electron analysis [39] of the excitation, and the properties of the obtained indices are analyzed. After this, the property indices were mainly analyzed by IBM SPSS Statistics 24 software [40], for regression analysis and dimensionality reduction analysis to find out the correlation and construct the QSAR model.
PFCAs with C2–C14 chain distribution were selected, which were focused on their ground state and excited state. In Fang et al.’s study [41], molecules were observed to reach the lowest singlet excited state under UV light, and have a decisive influence on the subsequent reactions such as direct decomposition, and intersystem crossing related to the triplet excited state. In order to investigate the characteristics and commonalities of the molecular changes in the first step of the direct photolysis reaction of the chain PFCA, the singlet excited state was chosen as the main object of the study. The primary objective in ground state is to optimize the structure and calculate the single point energy. Then, for the excited state, excited state calculations were conducted, with a particular focus on the detailed information pertaining to the three excited states which are in the lowest energy (the lowest energy singlet state excited state, S1, S2, S3). Computational results of ground state energies (Fig. 1a and Table S2 in Supporting information) reveal that the total ground state energy of the molecules decreases significantly as the carbon chain length increases. This trend aligns with the phenomenon of increasing molecular size. In general, the excitation energy of the S0 → S1 decreases with increasing chain length, but the change levels off within the C10–C12 chain length range and a slight rebound in excitation energy occurs for C13–C14. The reduction in excitation energy implies a lower energy threshold for photon absorption, indicating that longer-chain PFCAs are theoretically more readily excited by lower-energy photons. This may partially account for the observation that longer-chain PFCAs exhibit faster photolysis rates or initiate photolysis at longer wavelengths under certain conditions compared to their shorter-chain counterparts.
Figure 1
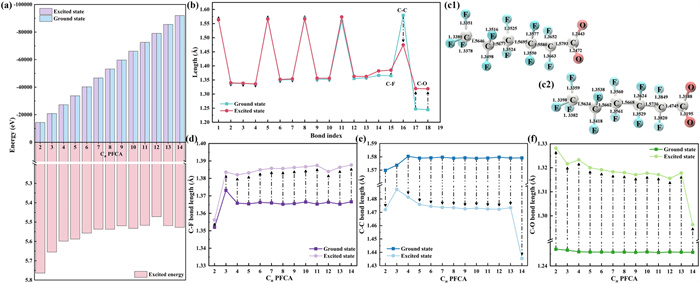
Figure 1.
(a) The energy of the ground state and excited state and the excitation energy of C2–C14 PFCAs. (b) The change of bond lengths in ground and excited states of C6, (c1) ground state bond length and (c2) excited state bond length of C6, and (d) α C-F, (e) α C—C and (f) C—O bond length changes of C2–C14 PFCAs in ground state and excited state.
The molecular bond lengths obtained by structural optimization were shown in Fig. 1b, Figs. 1c1 and c2 and Table S3 (Supporting information). In the case of perfluorohexanoic acid (C6, PFHxA), when the transition from the ground state to the first excited state, the α C–F bond (the C–F near to the carboxyl) increases significantly by 1.44%. However, the bond lengths of other C-F bonds in the molecule vary very little (<1%). Simultaneously, α C–C bond (the C–C near to the carboxyl) length was lower, as in PFHxA where the growth of other C–C bonds are mostly within 1%, while α C–C growth rate reaches −6.64%. The C—O bond of the carboxyl group also shows significant elongation, about 4%−6% on average. This trend was extended to PFCAs with C2–C14 chain distribution (Figs. 1d-f and Table S4 in Supporting information), and it was found that as the molecule moves from the ground state to the excited state, the bond lengths of α C–F and C–O increase, while the bond lengths of α C–C decrease. These results indicated, in terms of bond length, that α C–F bonds might be more readily dissociated than other C–F bonds, and that the contraction α C–C and the elongation of C–O might predict decarboxylation here. To further substantiate such speculation, the bond dissociation energy (BDE) of the ground state molecules was calculated to determine its bond breaking difficulty (Fig. 2a). As illustrated in Table S5 (Supporting information), the BDE of α C–F was observed to range between 124 and 116 kcal/mol, which was higher than that of α C–C, which was between 90 and 93 kcal/mol. This result indicates that breaking the α C–C bond, which corresponds to the initiation step of decarboxylation, requires less energy than breaking the α C–F bond when the molecule is not excited. This is consistent with the experimental observation that decarboxylation is usually the predominant photolysis pathway [31]. Combined with the previously observed structural alterations in the excited state, it is proposed that although the C–F bond is stronger in the ground state, photoexcitation likely weakens both the C–F bond (particularly at the α position) and the C–O bond, while simultaneously altering the molecular conformation. These changes collectively facilitate the decarboxylation reaction kinetically and concurrently create the possibility for defluorination.
Figure 2
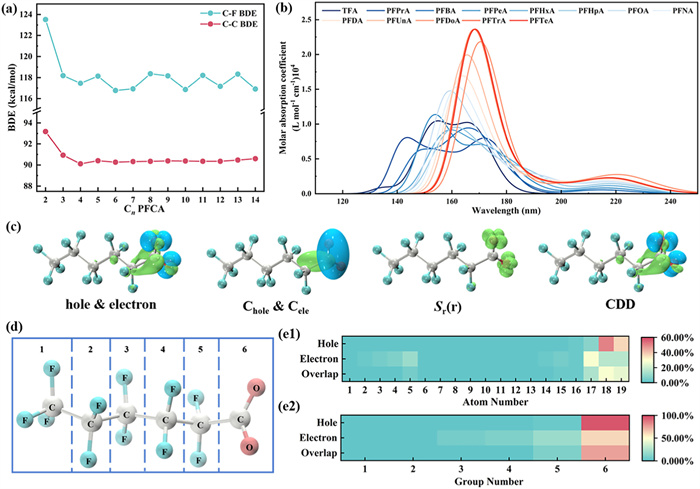
Figure 2.
(a) Bond dissociation energies (BDE) in ground and excited states of C2—C14 PFCAs. (b) Charge-transfer spectrum of PFCAs. (c) The distribution of C6 hole-electrons, four graphs show the distribution of electron holes by different processing methods. Hole and electron (hole & electron), describing the smooth distribution of holes and electrons (Chole & Cele), in which green and blue areas respectively represent electrons and holes distribution. The third is describing the overlap between electron and hole distributions (Sr(r)) and the last one is charge density difference (CDD) in which green and blue respectively correspond to the increase and decrease of the density of the excited state relative to the density of the ground state. (d) Grouping of C6, and the heat map of (e1) atom contribution and (e2) group contribution in C6.
Theoretically calculated charge-transfer spectrum (CTS) provides a basis for understanding the light absorption characteristics of PFCAs (Fig. 2b), and the calculation method of CTS is shown in Text S2 (Supporting information). As persistent pollutant, PFCA undergoes little direct photolysis at wavelengths longer than 220 nm [29]. The research findings [42,43] indicated that the degradation rate of PFCA was dependent on the wavelength of the reacting light, and the photolysis of short-chain PFCA may necessitate a greater input of reaction energy. This is consistent with the calculation that the C4–C14 PFCAs are all predicted to have absorption peaks (S0 → S1) around 220 nm, while the main absorption bands of TFA (C2) and PFPrA (C3) are located at shorter wavelengths. As the chain molecules become longer, the highest peak across to the right and the molar absorption coefficient rises, making the photolysis reaction faster and easier to carry out which is shown in Fig. S1 (Supporting information). This well explains why TFA and PFPrA are often demonstrated as end products in many PFCAs photolysis experiments, as they require higher energy photons to be efficiently excited. As the carbon chain grows from C2 to C14, the calculated S1 excitation energy generally decreases, and the corresponding maximum absorption wavelength is redshifted (Table S6 in Supporting information). This means that long-chain PFCAs not only have a lower energy threshold to absorb photons, but also have a stronger absorption ability to the light of the corresponding wavelength, which makes the long-chain molecules can achieve faster photolysis under a suitable light source.
Used by Multiwfn software, the excited states of C2–C14 molecules were further analyzed which is the hole-electron analysis. Taking C6 as another example, the changes in electron density before and after the S0 → S1 transition were demonstrated through four different methods (Fig. 2c), and the specific contributions of individual atoms and fragments to holes and electrons were analyzed to elucidate the detailed photodegradation behavior of PFCA (Figs. 2d and e1 and e2). The results of the contribution of each non-hydrogen atom to the hole and electron of C6 demonstrate that the contribution of the oxygen atom on the carboxyl group to the hole is the highest, at 50.62% and 36.72%, respectively. The largest contributions to the electron are the carboxyl carbon atoms, the carbon atoms of the α-CF2 group (about 11.6%) and the fluorine atoms (about 4.7%). This indicates that on n → π* excitation, electrons transition mainly from the nonbonded orbital of the oxygen atom to the π* consisting mainly of the carboxylic carbon and α-C, and there is a tendency for the electron cloud density to diffuse toward the α-CF2 group. The charge redistribution caused by this excitation (oxygen atoms lose electrons and carbon atoms gain electrons) allows the chemical bonds of the entire carboxyl functional group (especially C—C and C—O) to be activated, which is highly consistent with the experimental phenomenon that decarboxylation reactions occur preferentially. At the same time, the α-F atom also acquires a small amount of electron density, which may have an effect on its chemical bond stability, but the promotion of the decarboxylation path is more significant in comparison. This provides a solid theoretical basis for the decarboxylation of PFCAs in photolysis.
The hole-electron analysis parameters used to characterize the excited state are listed in Table S7 (Supporting information). The Sr index is used to describe the overlap degree of hole and electron spatial distribution, and the smaller the value, the lower the overlap degree. The D index refers to the distance between holes and electron centroids, which can reflect the degree of charge separation. The H index can express the overall average breadth of distribution of electrons and holes. The t index is the degree of separation in the direction of the line connecting the center of mass of the hole and electron, and positive values indicate charge transfer. Ecoul is the Coulomb attraction energy between holes and electrons. Hole delocalization index (HDI) and electron delocalization index (EDI) describe the degree of hole and electron delocalization, and a higher value indicates a wider range of delocalization. More detailed information on the above parameters is presented in Text S3 (Supporting information). The analysis was carried out using C6 as an example, which has far less D index than the length of α C–C bond (1.54 Å), the small Sr index, and the t index close to zero. It can be concluded that C6 at S0 → S1 transition is the n → π* local excitation on the carboxyl group. The hole electron distribution diagram and various indices of C2–C14 were generally consistent with those of C6 (Fig. 3a).
Figure 3
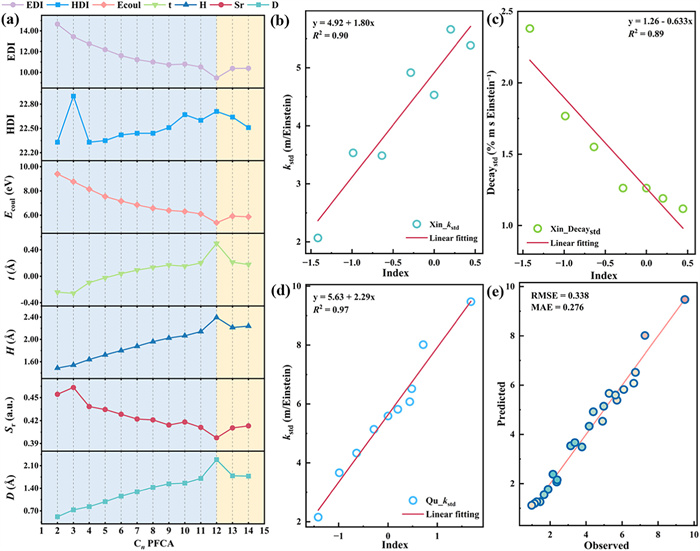
Figure 3.
(a) C2–C14 PFCAs hole electron condition indices synthesis diagram. (b) Regression analysis plot of hole-electron index and Xin_kstd, (c) regression analysis plot of hole-electron index and Xin_Decaystd, (d) regression analysis plot of hole-electron index and Qu_kstd, (e) observed-predicted plot of the QSAR model.
It was also observed that in C2–C14 PFCA, the EDI, Ecoul, and Sr indices reached minima at C12, while the HDI, t, H, and D indices attained maxima. According to the definitions of these indices, the C12 molecule exhibits broader average spatial distribution of holes and electrons, greater separation between holes and electrons, smaller hole-electron overlap, lower hole delocalization, and higher electron delocalization. This suggests that as the carbon chain lengthens, molecular excitation transitions from compact localized excitation to charge-transfer excitation characterized by higher electron delocalization. To validate this hypothesis, the Inter-Fragment Charge Transfer (IFCT) method was employed. The transfer of electrons during excitation was analyzed by the IFCT method (Text S3 in Supporting information) and PFCA was divided into three fragments. The fragment 1 is the fluoroalkyl part except α-CF2, fragment 2 is α-CF2; and fragment 3 is the carboxyl part. Additionally, TFA has only the fluoroalkyl fragment 1 and the carboxyl fragment 2. As illustrated in Table S8 (Supporting information), the electron transfers between fragments are relatively low, with the majority occurring from the carboxyl group to α-CF2 (0.19–0.65), which gradually increases with the length of the carbon chain. Conversely, the major electron redistribution occurs in the carboxylate fragments (0.81–0.20), with a gradual decrease in this transfer with increasing carbon chain length. In consequence, it was determined that the S0 → S1 transition of C2–C13 PFCA is a local n → π* excitation that occurs on carboxyl groups, which means that when the excitation process occurs, electron transfer occurs mainly in the carboxyl part of the molecule. Meanwhile, there happened charge transfer of C14, transferring electrons from the carboxyl group to α-CF2. This undoubtedly reveals that with the increase of carbon chain length, the electron transfer between excited state fragments increases, the affected molecular region increases, and it is easier to change the molecular structure during the excitation process.
Analysis software such as SPSS [40] was used to explore the potential relationships between theoretical calculations and experimental degradation data, and a generalized QSAR model was constructed. Theoretical data were processed (Table S9 in Supporting information), where indices such as D, Sr, H, t, Ecoul, HDI, EDI obtained from hole-electron analysis were standardized. Principal Component Analysis (PCA) was performed to reduce dimensionality, consolidating these indices into a single principal component (named "hole-electron index") that comprehensively describes the electronic excitation characteristics. As shown in Table S7, the hole-electron index does not monotonically increase with carbon chain length but peaks at C12. This is consistent with the aforementioned particularity of the excited state parameters of C12, hinting at the complexity of the excitation mode varying with chain length. In order to understand the significance of the hole electron index, Pearson correlation analysis was performed to investigate the correlation between the hole electron index and other key theoretical parameters. The results showed that the hole-electron index was negatively correlated with the excitation energy of S1 (r = −0.927, P < 0.01) and the ground state BDE of α C—C bond (r = −0.576, P < 0.05). The change rate of α C-F bond (r = 0.660, P < 0.05) was positively correlated with GOS (r = 0.992, P < 0.01) of S0 → S1 transition in the excited state. The change rate of C—O bond in excited state (r = −0.582, P < 0.05) was also negatively correlated. These strong correlations reveal the meaning of the hole-electron index. A higher hole-electron index means that the molecule is more easily excited, has more light absorption capacity, and has more structural distortions that lead to the activation of chemical bonds after excitation. Therefore, this index can be regarded as a comprehensive theoretical index that can effectively reflect the photochemical reaction potential of a molecule. The increase of the index indicates that the molecule is more likely to initiate the bond breaking step in the photolysis process.
Experimental data from Xin et al. and Qu et al. were standardized using photon flux (ϕ) to account, due to differences in the comparability of experimental data caused by different experimental conditions (Text S4 in Supporting information) [35,36]. Regression models between the hole-electron index and standardized data (Figs. 3b–d) showed high significance (P < 0.01). The model analysis revealed differential associations between excited state properties and different degradation pathways. The hole-electron index showed a significant positive correlation with the normalized photolysis rate constant (kstd), indicating that the higher the composite index, the faster the photolysis rate of the molecule as a whole, which was consistent with the previous analysis. However, the hole-electron index showed a significant negative correlation with the standardized DecayF std, indicating that the electronic properties that facilitate faster and more efficient molecular excitation to start the initial degradation (mainly decarboxylation) are relatively detrimental to the subsequent defluorination process. A plausible explanation for this may be that when the hole-electron index is high, the initial photochemical conversion of the molecule is very fast, especially the rate of decarboxylation to form perfluoroalkyl radicals. Resulting in the disappearance of the molecule or its key intermediates by other, faster and more dominant pathways before they undergo effective C-F bond breaking [36]. Thus, the negative correlation suggests that the key steps determining defluorination efficiency may not be simply proportional to the situation of the initial excitation, and there may even be some degree of inhibition or pathway competition. This is another evidence that defluorination is usually not the dominant or most efficient degradation pathway in the direct photolysis of PFCAs.
The QSAR model was validated via leave-one-out cross-validation (LOOCV), yielding low RMSE (0.338) and MAE (0.276) (Fig. 3e) [44]. These validation indicators prove that the QSAR model not only has high goodness of fit, but also has reliable prediction accuracy. The model can better predict the photolysis rate of PFCAs, which provides an effective tool for evaluating and predicting the photochemical rate of such pollutants by computational chemistry methods, and illustrates the central role of the proposed hole-electron index in the photolysis process of PFCAs.
The integration of quantum chemical calculations and experimental validation elucidates that decarboxylation dominates the photolysis pathways of PFCAs in their excited state, with defluorination exhibiting limited efficiency. The constructed QSAR model, validated by LOOCV, demonstrates a strong correlation between molecular excitation properties (e.g., hole-electron index) and photodegradation rates, enabling predictive capabilities for PFCA degradation [45]. These findings advance mechanistic understanding at the electronic level and provide a framework for optimizing photolysis-based remediation strategies.
Future studies should extend this approach to complex environmental matrices (e.g., natural waters with dissolved organic matter) and diverse PFCA derivatives (e.g., branched or polyfluorinated analogs). Additionally, coupling QSAR predictions with advanced oxidation processes could enhance degradation efficiency. This work bridges theoretical and applied environmental science, offering a robust foundation for designing targeted interventions against persistent fluorinated pollutants.
Declaration of competing interest
The authors declare that they have no known competing financial interests or personal relationships that could have appeared to influence the work reported in this paper.
This work was supported by the Shenzhen Science and Technology Program (No. JCYJ20241202125900002), National Natural Science Foundation of China (No. 22576005) and the 2023 Shenzhen Sustainable Supporting Funds for Colleges and Universities (No. 20231121170027002).
Supplementary materials
Supplementary material associated with this article can be found, in the online version, at doi:10.1016/j.cclet.2025.112273.
[1]
L. Ahrens, M. Bundschuh, Environ. Toxicol. Chem. 33 (2014) 1921–1929. doi: 10.1002/etc.2663
[2]
Z. Wang, I.T. Cousins, M. Scheringer, K. Hungerbühler, Environ. Int. 60 (2013) 242–248. doi: 10.1016/j.envint.2013.08.021
J.P. Giesy, J.E. Naile, J.S. Khim, P.D. Jones, J.L. Newsted, Aquatic toxicology of perfluorinated chemicals, in: D.M. Whitacre (Ed.), Reviews of Environmental Contamination and Toxicology, Reviews of Environmental Contamination and Toxicology, 202, Springer, New York, 2010, pp. 1–52.
[12]
O. US EPA, Chemicals under the Toxic Substances Control Act (TSCA), (2015). https://www.epa.gov/chemicals-under-tsca (accessed June 29, 2023).
[13]
Stockholm Convention on Persistent Organic Pollutants (POPs), https://chm.pops.int/TheConvention/POPsReviewCommittee/Meetings/POPRC9/POPRC9Followup/PFOSSubmission/tabid/3565/Default.aspx (accessed June 30, 2023).
[14]
Anon, Candidate list of substances of very high concern for authorisation - ECHA, https://echa.europa.eu/web/guest/candidate-list-table (accessed June 29, 2023).
[15]
Commission Regulation (EU) 2021/1297 of 4 August 2021 amending annex ⅩⅦ to Regulation (EC) No 1907/2006 of the European Parliament and of the Council as regards perfluorocarboxylic acids containing 9 to 14 carbon atoms in the chain (C9-C14 PFCAs), their salts and C9-C14 PFCA-related substances (Text with EEA relevance), 2021. http://data.europa.eu/eli/reg/2021/1297/oj/eng (accessed June 30, 2023).
[16]
A. Maimaiti, S. Deng, P. Meng, et al., Chem. Eng. J. 348 (2018) 494–502. doi: 10.1016/j.cej.2018.05.006
[17]
Y. Bao, J. Niu, Z. Xu, et al., J. Colloid and Interface Sci. 434 (2014) 59–64. doi: 10.1016/j.jcis.2014.07.041
[18]
T.D. Appleman, E.R.V. Dickenson, C. Bellona, C.P. Higgins, J. Hazard. Mater. 260 (2013) 740–746. doi: 10.1016/j.jhazmat.2013.06.033
R. Nandi, A. Sharma, A. Priya, D. Kumar, Mol. Divers. 29 (2025) 3207–3231. doi: 10.1007/s11030-024-11070-w
[45]
S. Yang, J. Yang, M. Duan, et al., Trans. Tianjin Univ. 30 (2024) 167–177. doi: 10.1007/s12209-024-00387-0
Figure 1
(a) The energy of the ground state and excited state and the excitation energy of C2–C14 PFCAs. (b) The change of bond lengths in ground and excited states of C6, (c1) ground state bond length and (c2) excited state bond length of C6, and (d) α C-F, (e) α C—C and (f) C—O bond length changes of C2–C14 PFCAs in ground state and excited state.
Figure 2
(a) Bond dissociation energies (BDE) in ground and excited states of C2—C14 PFCAs. (b) Charge-transfer spectrum of PFCAs. (c) The distribution of C6 hole-electrons, four graphs show the distribution of electron holes by different processing methods. Hole and electron (hole & electron), describing the smooth distribution of holes and electrons (Chole & Cele), in which green and blue areas respectively represent electrons and holes distribution. The third is describing the overlap between electron and hole distributions (Sr(r)) and the last one is charge density difference (CDD) in which green and blue respectively correspond to the increase and decrease of the density of the excited state relative to the density of the ground state. (d) Grouping of C6, and the heat map of (e1) atom contribution and (e2) group contribution in C6.
Figure 3
(a) C2–C14 PFCAs hole electron condition indices synthesis diagram. (b) Regression analysis plot of hole-electron index and Xin_kstd, (c) regression analysis plot of hole-electron index and Xin_Decaystd, (d) regression analysis plot of hole-electron index and Qu_kstd, (e) observed-predicted plot of the QSAR model.

 DownLoad:

 下载:
下载:


 下载:
下载:
