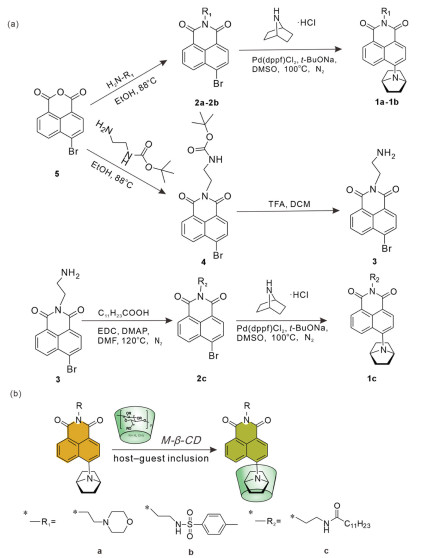
Scheme 1.
(a) The synthetic route of dyes 1a-1c, the isolated yields: 19%−27%. (b) The inclusion mechanism with M-β-CD and the structure of dyes 1a-1c.

Fluorescence enhancement in cells via host-guest complexation of azabicycloheptane-modified naphthalimide dyes with methyl-β-cyclodextrin
Xu-Rong Liu , Xu Xu , Jian-Feng Ge , Ru Sun


Organic small molecule dyes are widely used in fluorescent labeling [1], bioimaging [2,3] and fluorescence detection [4–6] due to their properties such as high fluorescence quantum yield [7], good photostability [8], outstanding ion selectivity, and good biocompatibility [9]. Among them, naphthalimide dyes are commonly used in biological imaging, but they have a low fluorescence quantum yield in water [10]. Considering that biological systems mainly operate in aqueous media, it is crucial to improve the fluorescence quantum yield of the dyes [11]. Although chemical modification of naphthalimide dyes can improve fluorescence quantum yields [12], it is still low in aqueous environment, and the modification process involves complex synthesis steps [13–15], which is one of the challenges. Therefore, it is of great interest to establish a simple and effective method to enhance the fluorescence emission ability of naphthylimide dyes in aqueous environment.
Cyclodextrins (CDs) have been widely used in microencapsulation of aromatic substances [16,17], drug delivery [18,19], and dye encapsulation [20,21]. CDs have a hydrophobic cavity that uses intermolecular forces to encapsulate guest molecules and a hydrophilic shell [22], thereby reducing the non-radiative transition of dyes and thus increasing their fluorescence emission in water [23]. In the reported, most applications involve the direct use of fluorophores in the aqueous medium complexed with the host molecules, which may lead to the formation of dimers, thereby causing fluorescence quenching of the dyes [24,25]. In addition, a lower host-guest inclusion complex constant may require a higher proportion of CDs (800–1000 equiv.) to enhance fluorescence, which can affect the microenvironment of the organism [25,26].
Past studies have shown that adamantane-modified neutral dyes significantly enhance their fluorescence emission when complexed with methyl-β-cyclodextrin (M-β-CD) [17,27–29]. Inspired by the previous work of our lab, we are committed to finding a new aza-bridged ring, azabicycloheptane, that can be encapsulated in the cavity of M-β-CD to form a complex with a stoichiometric ratio of 1:1 like adamantane [30–32]. Azabicycloheptane (7-azabicyclo[2.2.1]heptane) serves as an amino auxochrome, achieving bright fluorescent emission of dyes in polar environments by suppressing the pyramid flipping of the nitrogen atom. This transforms traditional ACQ dyes, which suffer from quenching due to aggregation, into dual-state emission (DSE) dyes that exhibit emission both in solution and solid states [33]. Compared with adamantane, although the fluorescence enhancement factor of diazabicycloheptane is smaller than that of adamantane and its binding constant is slightly lower, the concentration used for cell imaging is only 0.4 µmol/L, which is lower than the 0.5 µmol/L of adamantane [29]. Meanwhile, the high fluorescence quantum yield and large Stokes shift are of great significance for cell imaging and detection applications. Therefore, this study aimed to improve the fluorescence emission ability of naphthalimide derivatives in water by attaching the azabicycloheptane to the naphthalimide chromophore and then complexing with M-β-CD. A detailed discussion was conducted on the optical properties of the naphthalimide derivatives, dyes 1a-1c, before and after the inclusion process, as well as their applications in cell imaging.
The simple synthesis steps for 1a-1c are shown in Scheme 1a. Compounds 2a-2c (0.5 mmol, 1 equiv.), 7-azabicyclo[2.2.1heptane, hydrochloride (1:1) (0.75 mmol, 1.2 equiv.), Pd(dppf)Cl2 (0.025 mmol, 0.05 equiv.), t-BuONa (1.25 mmol, 2.5 equiv.) were dissolved in DMSO (4.0 mL) and refluxed at 100 ℃ under nitrogen atmosphere for 15 h. After the reaction finished, the mixture was extracted by EA and H2O. Then, the organic solvent was removed by a rotary evaporator. Finally, the pure products 1a-1c were obtained by column chromatography eluted with EA/PE (1/3 ~ 1/2, v/v). The detailed characterization data can be found in Figs. S7-S15 (Supporting information).
Size matching is a key factor to consider in the preparation of stable host-guest inclusion complexes. The configuration of azabicycloheptane is like that of adamantane, therefore, the azabicycloheptane can also be encapsulated in the hydrophobic cavity of M-β-CD. Because of their higher matching size, the azabicycloheptane and M-β-CD could form host-guest complexes with a stoichiometric ratio of 1:1 [29]. Moreover, naphthalimide dyes can target different organelles by linking different targeting groups, which has a wide range of applications in organelle imaging [34,35]. Based on the above discussion, 1a-1c were synthesized by making azabicycloheptane as the auxochrome for naphthalimide unit and attaching different targeting groups with targeting lysosomes (Lyso), endoplasmic reticulum (ER) and Golgi apparatus (GA), respectively (Scheme 1b). The introduction of the azabicycloheptane enhanced the interaction between the guest dyes and the host macrocycles, also avoided the π-π stacking of organic molecules in water. Moreover, the nitrogen heterobridge ring, acted as the auxochrome. To select a host molecule with a higher fluorescence enhancement factor, the fluorescence spectra of the dye molecule complexed with β-CD and M-β-CD were obtained, respectively.
To investigate the optical properties of 1a-1c in different solvents, spectroscopy tests were performed. As the increase of polarity, the maximum absorption wavelengths of 1a-1c in different solvents situated in 407–423 nm and had a slight trend of redshift, and the green color of the solution gradually became lighter (Fig. S1 in Supporting information). While their maximum emission wavelengths located at 506–545 nm and the fluorescence intensity of 1a-1c basically enhanced as polarity decreased. At the same time, the color of the solution changed from green to yellow (Fig. S2 in Supporting information). Specially, the fluorescence quantum yield of the three dyes in dichloromethane (DCM) was above 75%, indicating that they had excellent optical properties (Table S1 in Supporting information). In addition, the fluorescence intensity in water significantly reduced compared to that in organic solvents, but when the dye molecules were dissolved in M-β-CD, the fluorescence intensity was 1–2 times than that in water (Fig. S2), which indicated that M-β-CD, as the host molecule, could enhance the fluorescence emission intensity of organic dyes in water. Compared with in water, the fluorescence quantum yields of the three dyes with the presence of M-β-CD greatly increased 3.4-fold (1a), 3.2-fold (1b) and 2.3-fold (1c), respectively (Table 1). Therefore, the dyes 1a-1c, which utilized azabicycloheptane as the auxochrome, succeeded in significantly reducing the concentration of host molecules required and greatly enhancing the fluorescence emission intensity of the dyes in water with large Stokes shifts (125–138 nm) (Table 1 and Table S2 in Supporting information).

 DownLoad:
CSV
DownLoad:
CSV
| Probe | λAbs,max (nm) | λEm,max (nm) | Stokes shift (nm) | ε (× 104 L mol−1 cm−1) | Φ (%)a |
| 1a | 412 | 563 | 151 | 1.25 | 16 |
| 1a+M-β-CDb | 410 | 548 | 138 | 1.14 | 54 |
| 1b | 430 | 563 | 133 | 0.98 | 25 |
| 1b+M-β-CDb | 419 | 553 | 134 | 0.82 | 79 |
| 1c | 417 | 544 | 127 | 1.12 | 19 |
| 1c+M-β-CDb | 419 | 544 | 125 | 1.12 | 43 |
| a Coumarin-153 (Φ = 54.7% in ethanol) was used as the reference compound. b [M-β-CD]/[dyes] = 100. | |||||
In order to obtain the stoichiometric ratio and the inclusion equilibrium constant of the complexes formed by dyes 1a-1c (10 µmol/L) and M-β-CD, response experiments of the dyes with varying ratios of M-β-CD were conducted. As the concentration of M-β-CD increased from 0 to 160 µmol/L, the fluorescence intensity of dye 1a gradually increased, and the maximum fluorescence at 550 nm was 2.3 times than that of the absence of M-β-CD (Fig. 1a). Like 1a, the fluorescent intensity of 1b at 548 nm and 1c at 544 nm enhanced by 4.0 and 3.5 times as the concentration of M-β-CD increasing (Figs. 1b and c).
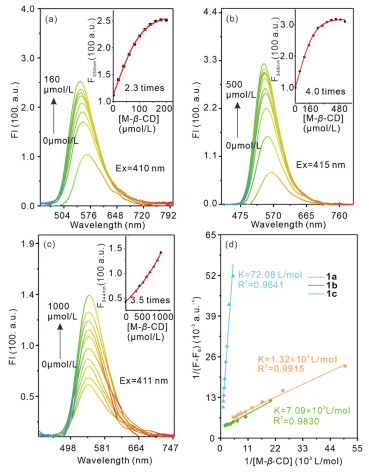
Furthermore, according to Benesi–Hildebrand equation [36], the linear relationship between 1/(F-F0) and 1/[M-β-CD] illustrated that the complexing stoichiometry was 1:1 between dyes and M-β-CD in aqueous solution. The inclusion equilibrium constants of 1a-1b were 1.32 × 10⁴, and 7.09 × 10³ L/mol with very high correlation coefficients respectively, indicating that the azabicycloheptane of the dyes had formed a stable complex with M-β-CD in water. However, the complexation equilibrium constant of 1c was only 72.08 L/mol. The reason may be that long dodecyl chain in 1c may sterically hinder the access of the azabicycloheptane moiety to the M-β-CD cavity, or alternatively, the chain itself could compete for encapsulation, leading to a significantly reduced binding constant (Fig. 1d). In addition, in order to obtain the stoichiometric ratio and the inclusion equilibrium constant of the complexes formed by dye 1a (10 µmol/L) and β-CD as a contrast, response experiments of the dye 1a with varying ratios of β-CD were conducted. The experimental results showed that the complexation constant between 1a and β-CD was 9.6 × 10³ L/mol (Fig. S3 in Supporting information), which was smaller than that between 1a and M-β-CD (1.32 × 10⁴ L/mol). This indicated that M-β-CD was more suitable as the host molecule for guest dyes 1a-1c. From the experimental results, it is successful to enhance the fluorescence property of dyes in water by modifying an azabicycloheptane as the auxochrome and encapsulating it with M-β-CD.
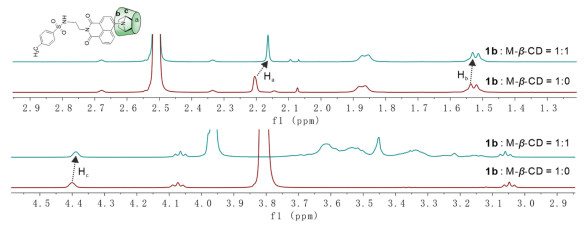
To demonstrate the complexation between the dye molecule and M-β-CD, 1H NMR spectra of dye 1b were acquired before and after complex formation (Fig. 2). Comparative analysis of the two spectra revealed that the Ha, Hb and Hc protons of the azabicycloheptane group exhibited upfield shifts. Specifically, the chemical shifts of Ha, Hb and Hc changed from 2.21 ppm to 2.16 ppm, 1.54 ppm to 1.52 ppm and 4.40 ppm to 4.38 ppm, respectively. These observations indicated that the azabicycloheptane moiety of dye 1b was encapsulated within the cavity of M-β-CD, confirming the formation of a host–guest complex between the dye molecules and M-β-CD.
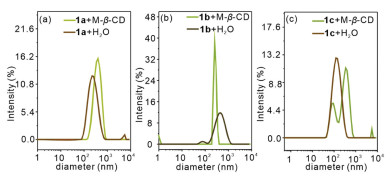
The organic small molecules 1a-1c were partially encapsulated by M-β-CD, making the host-guest inclusion complexes had amphiphilic. The amphiphilic host-guest inclusion complexes could self-assemble in water to form fluorescent supramolecular nanoparticles. To verify the above speculation, dynamic light scattering (DLS) experiments were conducted to verify the self-assembly behavior. The main particle sizes of dye 1a in water and M-β-CD solution were 216.9 nm and 554.0 nm, respectively (Fig. 3a). The increase of particle size in M-β-CD solution indicated the formation of supramolecular nanoparticles. Similar to 1a, the main particle sizes of 1c in water and M-β-CD solution were 143.1 nm and 96.8 nm, 355.4 nm (Fig. 3c), which showed that 1c formed supramolecular nanoparticles in M-β-CD solution and some molecules aggregated to form smaller nanoparticles. However, the main particle sizes of dye 1b in water and M-β-CD solution were 468.4 nm and 264.9 nm (Fig. 3b), which might be due to the poor solubility of 1b in water, many molecules aggregated from the water to form large-sized nanoparticles. Here, the specific mechanisms of fluorescence enhancement was speculated, namely the high inversion energy barrier of the nitrogen atom in the bridged ring auxochrome might inhibit the TICT effect, the fixing effect of M-β-CD, and the AIE effect of fluorescent nanoparticles in water [37–39].
Photostability is an important factor in measuring the quality of dyes, so photostability test is required prior to cell experiments. The corresponding remaining absorption of dyes 1a-1c were assessed by using an iodine tungsten lamp for 5 h in the presence of M-β-CD or not (Fig. S4 in Supporting information). After continuous irradiation, the remaining absorption of 1a-1c in acetonitrile were >80%, making them suitable for long−term imaging applications. When M-β-CD was added, the increase in residual absorption indicated that the M-β-CD could enhance the photostability of the dyes.
Selectivity and pH stability are equally important compared to photostability for the biological applications of the probes. Different analytes including common anions (CO32-, S2O32- NO3- HSO3-), cations (Ca2+, Ba2+, Mn2+, Ni2+) and amino acids (Cys, Gsh, Lys, Gly) were investigated to eliminate the interference of other factors in cells (Figs. S5a-c in Supporting information). There were no significant changes in the fluorescence intensity of the interference groups compared to the blank group, indicating that these species did not interfere with the optical testing of the dyes. In addition, for some dyes, changes in pH could alter the structure of molecules, which in turn affected their emission intensity in water. So, the pH test displayed the fluorescence intensity of 1b-1c almost had no change with pH, indicating that pH was not a factor affecting the fluorescence intensity of the dyes (Fig. S5d in Supporting information). While the fluorescence intensity of 1a didn’t change when the pH was <6.0, which had no effect on lysosomes with a pH of 4.5 to 5.5 [40].
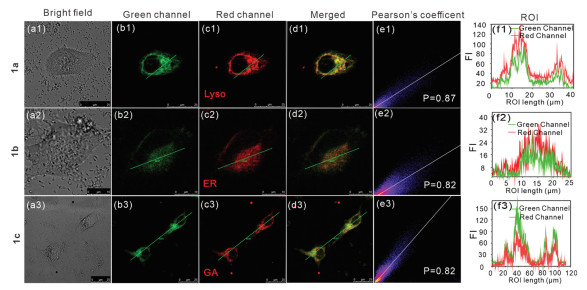
In general, small organic molecule dyes are toxic to cells, so cytotoxicity experiments are also essential prior to fluorescent imaging. The viability of HeLa cells co-cultured with the three dyes for 6 h were all above 80% even at 2.5 µmol/L, indicating that 1a-1c had low toxicity to cells (Fig. S6 in Supporting information). The low cytotoxicity and favorable biocompatibility of the dyes support their potential utility in live cell imaging applications. In order to verify the rationality of the molecular design, a cell colocalization experiment was conducted first. HeLa cells were cocultured with dyes 1a-1c (1.0 µmol/L) and the commercial markers for 10 min, followed by capturing fluorescence images using confocal laser scanning microscopy. The experimental results showed that dyes 1a-1c could target lysosomes, endoplasmic reticulum, and Golgi apparatus, respectively, which was in line with what was expected. The green channel of the dyes matched the red channel of the commercial markers well, and their colocalization coefficients were 0.87, 0.82, and 0.82, respectively (Fig. 4, e1-e3). The fluorescence intensity in the ROI regions also exhibited a similar trend (Fig. 4, f1–f3). The above experimental results exhibited the introduction of the bridge ring auxochrome of azabicycloheptane had significantly reduced the concentration of probes for cell co-localization (Table S2 in Supporting information).
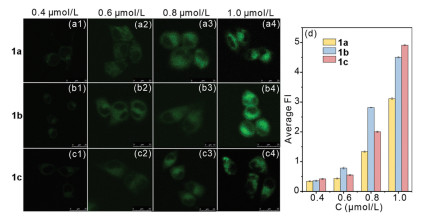
In order to investigate the effects of three dyes at different concentrations on cellular imaging, confocal experiments of 1a-1c were conducted at four different concentrations. As can be seen in the Fig. 5, when the concentration of dyes 1a-1c is 0.4 µmol/L, images of the cells could be observed, but in 1.0 µmol/L could provide a clearer view. It was with the increase in dye concentration from 0.40 µmol/L to 1.0 µmol/L, the brightness of the green channel in HeLa cells continuously raised (Fig. 5, a1-a4, b1-b4 and c1-c4). The average fluorescence intensity of dyes (1a-1c) enhanced by 9, 11 and 12 times, respectively (Fig. 5d).
From the above discussion, dyes could form stable inclusion complexes with M-β-CD, thereby enhancing fluorescence. If the dyes and M-β-CD were added simultaneously to the cells, it was certain that the amount of the dyes could be reduced. Then, would this have any impact on the targeting property of the probes?
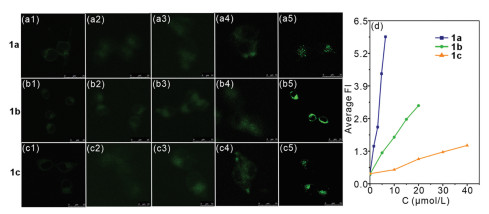
Therefore, further testing was conducted to evaluate the response of the 1a-1c to M-β-CD in HeLa cells. The concentrations of all dyes were 0.4 µmol/L, and the amount of M-β-CD was determined based on optical tests (Fig. 1). With the addition of M-β-CD, the green fluorescence of HeLa cells increased almost linearly (Fig. 6), the average fluorescent intensity enhanced by about 18.7-fold for 1a, 8.3-fold for 1b and 4.0-fold for 1c when the concentrations of M-β-CD were 6.4 µmol/L for 1a, 20 µmol/L for 1b and 40 µmol/L for 1c (Fig. 6d). Meanwhile, the addition of M-β-CD did not affect the targeting property of the probes, but it reduced the amount of the probes, which would not alter the microenvironment of cells in the biological system.
Based on the theory of host-guest chemistry, dyes 1a-1c with naphthylimide fluorophore that could form complexes with M-β-CD were designed and synthesized, in which the aza-bridge ring, azabicycloheptane, was chosen as the auxochrome. The optical properties of 1a-1c showed that M-β-CD enhanced their fluorescence quantum yields in water. The complexation constants of 1a-1c with M-β-CD indicated that they had a better ability to bind with M-β-CD. Cell experiments exhibited that the dyes with azabicycloheptane as the auxochromes achieved clear imaging of HeLa cells at low concentrations of host and guest. This work not only produced a new way to solve the problem of poor fluorescence performance of naphthalimide dyes in aqueous solution but also provided a strong support for bioimaging of organic small molecules at low concentrations in cells.
Xu-Rong Liu: Writing – original draft. Xu Xu: Resources. Jian-Feng Ge: Writing – review & editing, Resources, Methodology, Funding acquisition. Ru Sun: Writing – review & editing, Methodology.
The authors declare that they have no known competing financial interests or personal relationships that could have appeared to influence the work reported in this paper.
This work was financially supported by the Priority Academic Program Development of Jiangsu Higher Education Institutions (PAPD) and the Science and Technology Foundation of Suzhou (No. SZM 202214).
Supplementary material associated with this article can be found, in the online version, at doi:
A.M. Gibbons, M. Boadu, P.E. Ohno, Anal. Chem. 96 (2024) 19947–19954. doi: 10.1021/acs.analchem.4c04291
M. Peng, H. Wei, Q. Wang, et al., ACS Appl. Mater. Interfaces 17 (2025) 11742–11751. doi: 10.1021/acsami.4c19915
X. Qu, B. Ji, H. Gong, et al., Chin. Chem. Lett. 36 (2025) 110766. doi: 10.1016/j.cclet.2024.110766
A. Adnan Ashour, M.F. Felemban, F.J. Tayeb, et al., Dyes Pigments 236 (2025) 112648. doi: 10.1016/j.dyepig.2025.112648
Z. Zheng, S. Gong, Q. Li, et al., Chin. Chem. Lett. 36 (2025) 110191. doi: 10.1016/j.cclet.2024.110191
Q. Pang, F. Huo, Y. Yue, C. Yin, Chin. Chem. Lett. 36 (2025) 110713. doi: 10.1016/j.cclet.2024.110713
L. Yuan, Y. Su, R. Zhang, et al., Talanta 266 (2024) 125123. doi: 10.1016/j.talanta.2023.125123
M.W. Choi, G. Kim, A. Seitkazina, et al., Dyes Pigments 207 (2022) 110699. doi: 10.1016/j.dyepig.2022.110699
L. Hu, J. Cao, Y. Lv, Chem. Eng. J. 492 (2024) 152270. doi: 10.1016/j.cej.2024.152270
M. Cao, F. Hu, X. Han, et al., Chin. J. Chem. 33 (2015) 351–355. doi: 10.1002/cjoc.201400881
T. Yuan, Q. Xia, Z. Wang, et al., ACS Appl. Mater. Interfaces 16 (2024) 4478–4492. doi: 10.1021/acsami.3c16784
D. Staneva, E. Vasileva-Tonkova, I. Grabchev, J. Photochem. Photobiol. A: Chem. 382 (2019) 111924. doi: 10.1016/j.jphotochem.2019.111924
S. Bakkialakshmi, T. Menaka, J. Mol. Liq. 158 (2011) 117–123. doi: 10.1016/j.molliq.2010.11.004
J. Cha, R.R. Nani, M.P. Luciano, et al., Biorg. Med. Chem. Lett. 28 (2018) 2741–2745. doi: 10.1016/j.bmcl.2018.02.040
R. Tovtik, E. Muchová, L. Štacková, et al., J. Org. Chem. 88 (2023) 6716–6728. doi: 10.1021/acs.joc.3c00005
B.K. Paul, N. Guchhait, J. Colloid Interface Sci. 353 (2011) 237–247. doi: 10.1016/j.jcis.2010.09.030
B.K. Paul, A. Samanta, N. Guchhait, Langmuir 26 (2010) 3214–3224. doi: 10.1021/la903196k
B.K. Paul, N. Ghosh, S. Mukherjee, J. Phys. Chem. B 120 (2016) 3963–3968. doi: 10.1021/acs.jpcb.6b01385
E.G. Tomarchio, C. Zagni, S. Dattilo, et al., Carbohydr. Polym. 356 (2025) 123412. doi: 10.1016/j.carbpol.2025.123412
J. Huang, X. Wang, T. Huang, et al., Carbohydr. Polym. 333 (2024) 121985. doi: 10.1016/j.carbpol.2024.121985
S. Wu, Y. Luo, F. Zeng, et al., Angew. Chem. Int. Ed. 46 (2007) 7015–7018. doi: 10.1002/anie.200701396
G. Crini, S. Fourmentin, É. Fenyvesi, et al., Environ. Chem. Lett. 16 (2018) 1361–1375. doi: 10.1007/s10311-018-0763-2
K.A. Al-Hassan, N.I. Saleh, I.I. Abu-Abdoun, Y.A. Yousef, J. Inclusion Phenom. Macrocyclic Chem. 61 (2008) 361–365. doi: 10.1007/s10847-008-9430-8
T.C. Barros, S.H. Toma, H.E. Toma, et al., J. Phys. Org. Chem. 23 (2010) 893–903. doi: 10.1002/poc.1692
R.N. Dsouza, U. Pischel, W.M. Nau, Chem. Rev. 111 (2011) 7941–7980. doi: 10.1021/cr200213s
H.C. Hao, G. Zhang, Y.N. Wang, et al., J. Mater. Chem. B. 10 (2022) 5796–5803. doi: 10.1039/d2tb01351g
G.W. Chen, S.Y. Li, H.J. Liu, et al., Spectrochim. Acta Part A: Mol. Biomol. Spectrosc. 329 (2025) 125540. doi: 10.1016/j.saa.2024.125540
S.Y. Li, W.L. Wang, C. Wang, et al., Org. Biomol. Chem. 21 (2023) 8084–8088. doi: 10.1039/d3ob01427d
H.J. Liu, G. Zhang, Y.J. Xu, et al., Chem. Eur. J. 29 (2023) e202302782. doi: 10.1002/chem.202302782
J. Liu, X. Liu, Y. Yuan, et al., ACS Appl. Mater. Interfaces 10 (2018) 26473–26484. doi: 10.1021/acsami.8b05232
A. Ravi, A. Pathigoolla, H. Balan, et al., Angew. Chem. Int. Ed. 62 (2023) e202307324. doi: 10.1002/anie.202307324
Z. Wang, Y. Ren, Y. Zhu, et al., Angew. Chem. Int. Ed. 57 (2018) 9008–9012. doi: 10.1002/anie.201804400
G.W. Chen, R. Sun, J.F. Ge, Adv. Opt. Mater. 13 (2025) e02027. doi: 10.1002/adom.202502027
J.X. Cao, L. Wang, T.G. Liu, J.Y. Wang, Spectrochim. Acta Part A: Mol. Biomol. Spectrosc. 303 (2023) 123207. doi: 10.1016/j.saa.2023.123207
Z. Li, Q. Qiao, N. Xu, et al., Chin. Chem. Lett. 35 (2024) 108824. doi: 10.1016/j.cclet.2023.108824
G.A. Baker, N.J. Crane, R.C. Mayrhofer, T.A. Betts, J. Chem. Educ. 79 (2002) 1261. doi: 10.1021/ed079p1261
X. Cao, A. Gao, J.T. Hou, T. Yi, Coord. Chem. Rev. 434 (2021) 213792. doi: 10.1016/j.ccr.2021.213792
X. Cao, Q. Ding, N. Zhao, et al., Sens. Actuators B: Chem. 256 (2018) 711–720. doi: 10.1016/j.snb.2017.09.210
Q. Wang, H. Wu, A. Gao, et al., Chin. Chem. Lett. 34 (2023) 107644. doi: 10.1016/j.cclet.2022.06.067
Y. Huang, J. Liang, Z. Fan, Talanta 259 (2023) 124529. doi: 10.1016/j.talanta.2023.124529

Scheme 1 (a) The synthetic route of dyes 1a-1c, the isolated yields: 19%−27%. (b) The inclusion mechanism with M-β-CD and the structure of dyes 1a-1c.

Figure 1 Fluorescence spectra of dyes 1a (a), 1b (b), 1c (c) (10 µmol/L) in different ratios of M-β-CD solutions (slit widths: 3 nm/3 nm); Inset: the relationship between fluorescent intensity at 550 nm for 1a, 548 nm for 1b, 544 nm for 1c with the concentration of M-β-CD. (d) The linear relationship between 1/(F-F0) and 1/[M-β-CD].

Figure 2 1H NMR spectra of the 1:0 and 1:1 mixtures of 4.0 mmol/L dye 1b with M-β-CD in DMSO-d6/D2O (9 : 1, v/v) solution.

Figure 3 Dynamic light scattering of 1a (a), 1b (b), 1c (c) in water and M-β-CD solution respectively.

Figure 4 Colocalization images of HeLa cells with dyes 1a-1c (1.0 µmol/L) and corresponding commercial organelle-makers. (a1–a3) The bright field images. (b1–b3) The green channel images of dyes 1a-1c. (c1–c3) The red channel images of commercial organelle-trackers (Lyso-Tracker Red, ER-Tracker Red and Golgi-Tracker Red (100 nmol/L)). (d1–d3) Merged image of the green and red channel. (e1–e3) The fluorescent intensity correlation plots. (f1–f3) Fluorescence intensity of the region of interests (ROIs).

Figure 5 Fluorescent images of dyes 1a-1c with different concentrations cocultured in HeLa cells: (a1–c1) 0.40 µmol/L, (a2-c2) 0.60 µmol/L, (a3-c3) 0.80 µmol/L, (a4-c4) 1.0 µmol/L. (d) Average fluorescent intensity of dyes 1a-1c in HeLa cells. Data were shown as mean ± SD (n = 3).

Figure 6 Fluorescent images of dyes 1a-1c (0.40 µmol/L) with the absence or presence of M-β-CD in HeLa cells. (a1–c1) Without M-β-CD. The concentration of M-β-CD: (a2-c2) 1.6 µmol/L for 1a, 5 µmol/L for 1b and 10 µmol/L for 1c; (a3-c3): 3.2 µmol/L for 1a, 10 µmol/L for 1b and 20 µmol/L for 1c; (a4-c4) 4.8 µmol/L for 1a, 15 µmol/L for 1b and 30 µmol/L for 1c; (a5-c5) 6.4 µmol/L for 1a, 20 µmol/L for 1b and 40 µmol/L for 1c. (d) Average fluorescent intensity of dyes 1a-1c with different M-β-CD in HeLa cells.
Table 1. Optical properties of dyes 1a-1c in water with the absence or presence of M-β-CD.
| Probe | λAbs,max (nm) | λEm,max (nm) | Stokes shift (nm) | ε (× 104 L mol−1 cm−1) | Φ (%)a |
| 1a | 412 | 563 | 151 | 1.25 | 16 |
| 1a+M-β-CDb | 410 | 548 | 138 | 1.14 | 54 |
| 1b | 430 | 563 | 133 | 0.98 | 25 |
| 1b+M-β-CDb | 419 | 553 | 134 | 0.82 | 79 |
| 1c | 417 | 544 | 127 | 1.12 | 19 |
| 1c+M-β-CDb | 419 | 544 | 125 | 1.12 | 43 |
| a Coumarin-153 (Φ = 54.7% in ethanol) was used as the reference compound. b [M-β-CD]/[dyes] = 100. | |||||
 下载: 导出CSV

 扫一扫看文章


扫一扫关注我们
 下载:
下载: