Citation:
Pengpeng Lu, Weikang Wang, Yue Zhao, Hui Dong, Limin Zhang. A multi-signal readout-SERS probe with multiple binding sites for simultaneous recognition of biological thiols in living neurons and brains[J]. Chinese Chemical Letters,
2026, 37(10): 112236.
doi:
10.1016/j.cclet.2025.112236
A multi-signal readout-SERS probe with multiple binding sites for simultaneous recognition of biological thiols in living neurons and brains
English
A multi-signal readout-SERS probe with multiple binding sites for simultaneous recognition of biological thiols in living neurons and brains
Shanghai Key Laboratory of Green Chemistry and Chemical Processes, Department of Chemistry, School of Chemistry and Molecular Engineering, East China Normal University, Shanghai 200241, China
* Corresponding author. E-mail address: lmzhang@chem.ecnu.edu.cn (L. Zhang). 1 These authors contributed equally to this work.
Received Date:
25 September 2025 Accepted Date:
08 December 2025 Revised Date:
25 November 2025 Available Online:
15 October 2026
Abstract:
The simultaneous discrimination of structurally similar biological thiols in living systems remains a significant challenge. To address this, we designed a novel self-calibrating SERS probe, 2-(3,5-dinitrophenoxy)-4-(2-(4-ethynylbenzoylamino)ethyl)phenyl-2-fluoro-5-nitrobenzoate (DEP), for the simultaneous detection of hydrogen sulfide (H2S), polysulfide (H2Sn), and cysteine (Cys). This single-molecule probe incorporates three distinct binding sites, each specific to a different biothiol, enabling multiplex detection through five characteristic Raman signals (178, 264, 454, 1186, and 1600 cm-1). The Raman band at 2056 cm-1, located in the silent region, serves as an internal reference to establish a ratiometric sensing strategy, thereby improving detection accuracy. The resulting spectral variations were processed statistically using principal component analysis (PCA), allowing for the simultaneous assay of the three thiols. The DEP probe was anchored onto biocompatible gold nanorods (AuNRs), optimized for 785 nm laser excitation, to form the final SERS biosensor. The developed platform successfully identified and differentiated H2S, H2Sn, and Cys in complex biological environments, including living neurons and brain microdialysates.
Biological thiols represent a crucial class of reactive sulfur species (RSS) in the brain, playing vital roles in physiological processes such as oxidative stress regulation, signal transduction, and metal ion chelation [1–3]. Among them, hydrogen sulfide (H2S), the simplest biological thiol, helps maintain intracellular redox homeostasis and modulates fundamental signaling pathways involved in neurotransmission, cardiovascular function, and apoptosis [4–6]. Recently, some of these functions have also been attributed to its oxidized form, hydrogen polysulfides (H2Sn). The relationship and distinction between H2S and H2Sn in both physiological and pathological contexts of the brain remain subjects of active investigation [7]. Cysteine (Cys), a metabolic precursor to H2S and H2Sn, also serves critical functions in the brain. Given the interconnected nature of their metabolism, changes in the level of one thiol can significantly influence the others. Thus, the simultaneous detection and discrimination of H2S, H2Sn, and Cys are essential for elucidating their production, metabolic pathways, and physiological roles in biological systems.
However, a great challenge which have to confront is distinguishing the readout signal of multiplex molecules from numerous interferences potentially co-existing in biological systems. Conventional sensing approaches that rely on a single signal output are often inadequate for mapping multiple analytes in such complex settings. Surface enhanced Raman spectroscopy (SERS), with its ultra high sensitivity and spectral resolution, has emerged as a powerful tool for the multiplex detection of biological species [8–11]. However, typical SERS analysis mainly involves solid substrate-based analysis and nanoparticle sol-based analysis often suffers from a fundamental trade off, which the sensitive Raman substrate is non-selective for targets [12,13]. The nonadsorptive molecules close enough to the SERS substrate also can generate SERS signals, resulting in great interference towards the detection of targets, which greatly block the application of SERS analyzer in complicated measurement systems, for instance, brain environments [14–16]. This problem is sharply amplified when several targets with similar molecular structure are demanded to be detected in the biological samples once signals from background molecules can swamp the signal of the analytes. Furthermore, achieving both high sensitivity and reproducibility simultaneously remains challenging, due to difficulties in controlling the uniformity of nanoscale hot spots and in efficiently positioning target molecules within these predefined enhancement regions [17,18]. The ratiometric concept, which incorporates an internal reference signal to correct for SERS fluctuations, has been proposed to improve detection accuracy [19–22]. However, such discrete internal tags face localization issues on the nanoscale metal surface similar to those of the target analytes. Even with uniform co-distribution, competitive adsorption and dynamic molecular exchange on the surface can still occur, particularly in complex sample matrices.
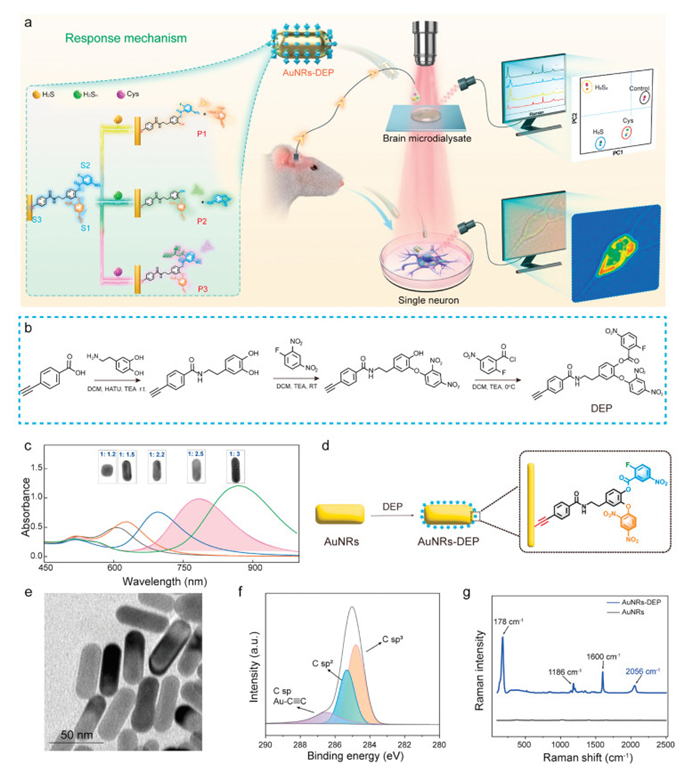
In response to the above challenges, we designed a novel SERS probe (AuNRs-DEP) for the simultaneous discrimination of H2S, H2Sn, and Cys in single neurons and cerebral microdialysates by monitoring ratiometric SERS signal changes. The sensing molecule, 2-(3,5-dinitrophenoxy)-4-(2-(4-ethynylbenzoylamino)ethyl)-phenyl-2-fluoro-5-nitrobenzoate (DEP), was synthesized with three functional sites: (S1) an N-(4-(2,5-dinitrophenoxy)phenyl group for chemoselective recognition of H2S via thiolysis of the dinitrophenyl ether; (S2) a 2-fluoro-5-nitrobenzoyl moiety that distinguishes H2Sn and Cys through nucleophilic aromatic substitution and thiol-fluorine exchange, respectively; and (S3) an acetylene group (C≡C) in the Raman-silent region, which serves both as a stable anchoring site on the Au surface and as an internal reference for calibration. Additionally, gold nanorods (AuNRs) with different length-to-diameter (L/D) ratios were synthesized, and an optimal L/D ratio was selected to match the laser wavelength, thereby improving detection sensitivity. The distinct Raman responses generated from each recognition site were processed using principal component analysis (PCA) [23–28]. The first principal component (PC1) exhibited a good linear relationship with the logarithm of the concentrations of H2S, H2Sn, and Cys. Consequently, the AuNRs-DEP SERS probe enabled simultaneous imaging and sensing of these thiols in living neurons as well as in mouse brain microdialysates when integrated with microdialysis sampling (Fig. 1a).
Figure 1
Figure 1.
(a) The principle of the developed SERS probe for the simultaneous biosensing of H2S, H2Sn and Cys in brain microdialysate and single neuron. (b) Synthesis routes for DEP. (c) UV–vis absorbance spectra of AuNRs and the corresponding TEM images. (d) Schematic illustration of the DEP assembled on AuNRs. (e) TEM of AuNRs-DEP. (f) XPS spectra of Au-C≡C. (g) SERS spectra of AuNRs-DEP and AuNRs.
As a starting point of this work, we designed and created a new recognition probe, DEP, for multi-detection of RSS (Fig. 1b). The structure of DEP was characterized by 1H NMR, 13C NMR, and mass spectrum (Figs. S1-S6 in Supporting information). The probe consists of two key structural segments: (1) N-(4-(2,5-dinitro-phenoxy)phenyl moiety (P1) was designed to chemoselective recognize H2S based on thiolysis of the dinitrophenyl ether reaction (Reaction 1). (2) 2-Fluoro-5-nitrobenzoyl moiety (P2) was used to recognize H2Sn, and Cys via nucleophilic reaction (Reaction 2) and substitution at the fluorine site (P3) (Reaction 3), respectively. We also synthesized AuNRs with varying length-to-diameter ratios. The resulting AuNRs exhibited a weak transverse plasmon band around 524 nm and a strong longitudinal plasmon band that red-shifted from 604 nm to 850 nm as the length-to-diameter ratio increased from 1:1.2 to 1:3 (Fig. 1c). This spectral shift can be attributed to the increased surface negative charge on the Au seeds in the presence of higher AgNO₃ concentrations, which promotes anisotropic growth and elongation of the nanorods. An AuNR sample with a length-to-diameter ratio of 1:2.5 was selected for subsequent experiments, and a 785 nm laser was chosen as the excitation source due to its strong tissue penetration, minimal photodamage, and low autofluorescence interference. Using 4-mercaptobenzoic acid (4-MBA) as a standard molecule, the SERS enhancement factor (EF) of the AuNRs was estimated to be 1.8 × 10⁷ (Fig. S7 in Supporting information). The DEP molecules were then anchored onto the AuNRs via Au-C≡C bonds to form the final SERS probe, denoted as AuNRs-DEP (Fig. 1d). TEM imaging confirmed the uniform morphology of the AuNRs-DEP, with nanorod lengths of approximately 50 nm (Fig. 1e). XPS was used to verify the modification of DEP at AuNRs (Fig. 1f). Moreover, the peaks at 402.6 eV (-NO2) and 688.0 eV (F1s) demonstrated the DEP probes have been successfully modified at AuNRs (Fig. S8 in Supporting information). The SERS spectra were also recorded of AuNRs-DEP probe. The typical SERS bands located at 2056, 1600, 1186 and 178 cm-1 were observed at AuNRs-DEP probe, which were ascribed to Au-C≡C stretching, Ring stretching [29], CN stretching [30,31], the bending vibration of C-F bond [32], respectively (Fig. 1g and Table S1 in Supporting information). The strongest SERS intensity was observed under 785 nm laser excitation, which can be attributed to the electromagnetic enhancement resulting from the close match between the surface plasmon resonance of the AuNRs and the laser wavelength (Fig. S9 in Supporting information).
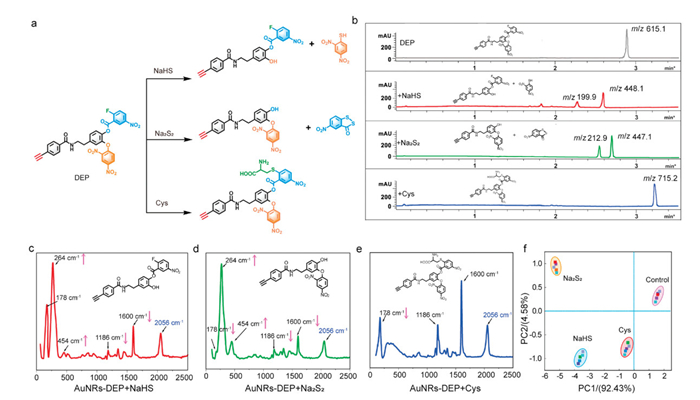
FTIR spectroscopy and LC-MS were used to confirm the design concept and the chemical products of DEP with different targets. Notably, NaHS and Na2S2 were selected as the respective donors for H2S and H2Sn under physiological pH conditions, where these species predominantly exist in their anionic forms (HS- and HSn-) [33,34]. Combined with the broad peaks located at ~3200–3600 cm-1 (-OH group) (Fig. S10 in Supporting information), new m/z peaks of 448.1, 447.1, 715.2 (Figs. 2a and b, Fig. S11 in Supporting information) confirmed that the chemical products of DEP after reacting with NaHS, Na2S2 and Cys were P1, P2, and P3. Next, the SERS response of the AuNRs-DEP probe towards NaHS, Na2S2 and Cys were investigated. As displayed in Figs. 2c-e, two new peaks at 264 cm-1 (ring out-of-plane bending) and 454 cm-1 (O—H out-of-plane bending vibration) appeared in artificial cerebrospinal fluid (aCSF) solution (pH 7.4) with the addition of 30 µmol/L NaHS (Fig. 2c) [35]. At the same time, the corresponding peak intensities at 178, 1186, and 1600 cm-1 were decreased because that the thiolysis of NaHS to DEP gave rise to the breakage of the ether bond, generating a phenolic structure. Similar changes were observed at AuNRs-DEP with the addition of Na2S2. Two peaks at 264 and 454 cm-1 appeared, and the peak intensities at 178, 1186, and 1600 cm-1 were decreased (Fig. 2d). The bi-nucleophilic reaction of Na2S2 and DEP also generate the phenolic structure, leading to similar SERS spectra as that caused by NaHS. However, it is worth noting that the varied amount of the peak intensity caused by Na2S2 with same amount was different from those of NaHS, and could be taken as the detection response to distinguish Na2S2 and NaHS. Unlike Na2S2 and NaHS, the addition of Cys gave rise to different phenomenon, in which the SERS intensity at 178 cm-1 decreased due to the nucleophilic substitution reaction between -SH of Cys and Fluorine atoms of DEP (Fig. 2e). Furthermore, the band at 2056 cm-1 remained constant with the addition of three kinds of targets because of SERS signal readout in silent region, and thus was used as an internal reference to simultaneously ensure the accuracy of multi-detection.
Figure 2
Figure 2.
(a) The reaction mechanism of DEP molecules with three sulfides. (b) LC-MS analysis of DEP solution (30 µmol/L) before and after reaction with NaHS (30 µmol/L), Na2S2 (30 µmol/L) or Cys (30 µmol/L), respectively. The m/z peaks at 616.1, 448.1, 448.0, and 715.2 were assigned to be DEP, and products of DEP with NaHS (denoted as p1), Na2S2 (p2) and Cys (p3) respectively. (c-e) SERS spectra of the developed probe after recognition of NaHS (c), Na2S2 (d) and Cys (e) respectively. (f) PCA analysis based on I178/I2056, I264/I2056, I454/I2056, I1186/I2056, I1600/I2056 to distinguish NaHS, Na2S2 and Cys.
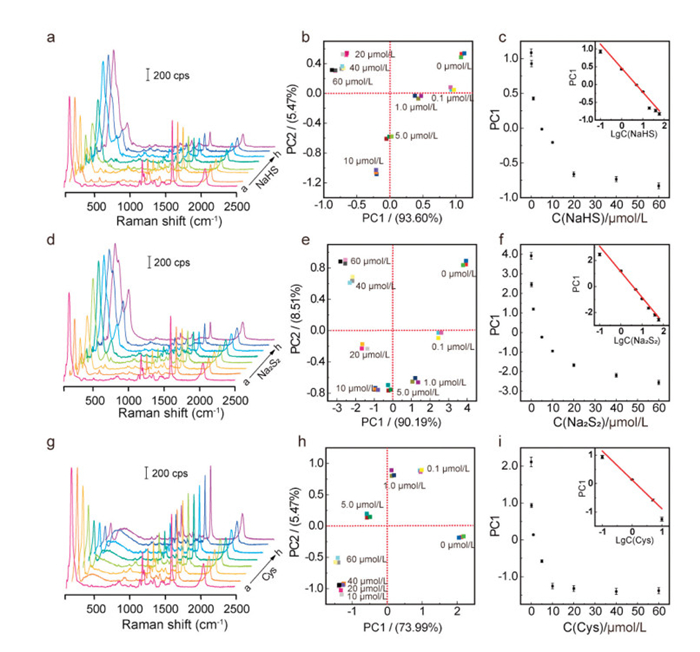
As a tool for the analysis of highly complex data, PCA was then employed to quantitatively distinguish the SERS responses of AuNRs-DEP probe for NaHS, Na2S2 and Cys. The Raman intensity of the characteristic response bands was firstly normalized through taking using the Raman intensity of 2056 cm-1 (Au-C≡C) as the inner reference. Then, the PCA were calculated from the peak intensity of 178, 264, 454, 1186, and 1600 cm-1 through choosing three dimensions to describe 100% of the variance (Fig. S12 in Supporting information). A SERS response matrix consisting of five peaks was built to gain three canonical factors (92.43%, 4.58%, and 2.99%). The most significant two factors were plotted as Fig. 2f. The first principal component (PC1) and second principal component (PC2) revealed the trends in each dataset. Each dataset was clustered as maximizing covariance. The variance levels in PC1 and PC2 were 92.43% and 4.58%, respectively. The clusters of RSS data were found to be distinguishable from that obtained in blank aCSF. Moreover, three active sulfurs (NaHS, Na2S2, and Cys) exhibited different PC1, PC2 values. These results confirmed that AuNRs-DEP probe had high discrimination capability for the simultaneous PCA analysis of NaHS, Na2S2 and Cys. Then, PCA was performed using five ratios of peak intensit (178, 264, 454, 1186, 1600 cm-1) to the peak intensity (2056 cm-1) as ratiometric signal readouts under different NaHS concentrations. It was found that PC1 value showed a good linear relationship with the logarithm of NaHS concentration (lgC(NaHS)) ranged from 0.1 µmol/L to 60 µmol/L (Figs. 3a-c). Moreover, the PC1 value also has a good linear relationship with the logarithm of Na2S2 concentration (lgC(Na2S2)) ranging from 0.1 µmol/L to 60 µmol/L (Figs. 3d-f). When adding different concentrations of Cys into blank aCSF solution (pH 7.4), PC1 value showed a good linear response with the logarithm of Cys concentration (lgC(Cys)) from 0.1 µmol/L to 10 µmol/L (Figs. 3g-i). More importantly, the data clusters of three compounds were small, which demonstrated AuNRs-DEP probe possessed good accuracy. The amounts of Cys, NaHS and Na2S2 were selected referring to their physiological levels in brain [36–40].
Figure 3
Figure 3.
SERS spectra of AuNRs-DEP probe with addition of various concentrations of NaHS (a), Na2S2 (d) and Cys (g) in aCSF (pH 7.4) respectively. NaHS, Na2S2, Cys: 0, 0.1, 1.0, 5.0, 10, 20, 40, 60 µmol/L. PCA score plots for SERS response patterns obtained with AuNRs-DEP probe against varying concentrations of NaHS (b), Na2S2 (e) and Cys (h). Score plots of PC1 versus the concentrations of NaHS (c), Na2S2 (f) and Cys (i). Inset: Linear detection ranges for NaHS (c), Na2S2 (f) and Cys (i).
Encouraged by the above experimental results, we recorded the individual SERS responses of the AuNRs-DEP sensor array upon the addition of specific biological thiols to aCSF, and subsequently fitted the concentrations based on the calibration curves. As shown in Table S2 (Supporting information), the evaluated values were in good agreement with the added concentrations. These data collectively demonstrate that the AuNRs-DEP sensor array holds significant potential for recognition of these three biological thiols in complex environments. Next, the sensing system was challenged with mixed solutions of NaHS, Na2S2, and Cys at varying molar ratios. Each mixture produced a unique SERS response pattern, which was reliably differentiated in the PCA score plot (Fig. S13 in Supporting information). These results confirm that the sensing system can successfully identify and accurately discriminate ternary thiol mixtures.
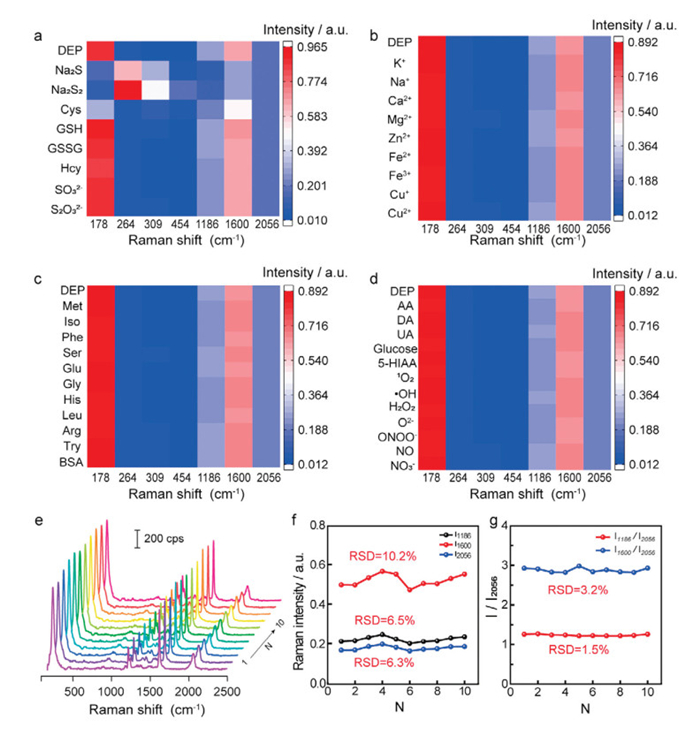
The selectivity is quite important for further application of simultaneous detection in brain environment. As a consequence, the selectivity test of the developed AuNRs-DEP probe for the simultaneous determination of NaHS, Na2S2 and Cys against metal ions (K+, Na+, Ca2+, Mg2+, Zn2+, Fe2+, Fe3+, Cu+, Cu2+), amino acids (Met, Iso, Phe, Ser, Glu, Gly, His, Leu, Arg, Try), protein (BSA), reactive oxygen species (1O2, •OH, O2-, H2O2), reactive nitrogen species (NO, NO3-, ONOO-), RSS (GSH, GSSG, Na2SO3, Na2S2O3, Hcy) and other biologically relevant substances (DA, UA, AA, glucose, 5-HIAA, ATP) were tested (Figs. 4a-d). The potential interferences could be separately grouped from the clusters for NaHS, Na2S2 and Cys, in particular for sulfur-containing species, in particular Hcy. Hcy has similar molecular structure as that of Cys, which is an important potential interference. As a result, we also tested the SERS response of AuNRs-DEP to Hcy. Negligible variation was observed, indicating that Hcy can not react with DEP (Fig. S14 in Supporting information). This point was further confirmed by FTIR (Fig. S15 in Supporting information) and the same m/z (616.1) LC-MS characterization (Fig. S16 in Supporting information). This observation might be explained by large sterically hinderance of Hcy. The results confirmed that the AuNRs-DEP probe could achieve the selective detection of RSS in complex biological samples. The uniform SERS substrate is vital to obtain the precise location of hot spots at SERS substrate. Because the hot spots are strongly dependent on the distance and uniformity of nanoparticles. The reproducibility of AuNRs-DEP probe was evaluated. As shown in Fig. 4e, the typical SERS spectra of 10 AuNRs-DEP probes with the same prepared process. The corresponding Raman intensity at 1186, 1600 and 2056 cm-1 were collected, exhibiting the RSD in SERS intensity smaller than 10.2%, 6.5% and 6.3%, respectively (Fig. 4f). Surprisingly, the RSD was greatly decreased to 3.2% and 1.5% as using ratio of Raman intensity at 1186, 1600 to that of 2056 cm-1 (Fig. 4g). These results indicate that the utilization of 2056 cm-1 as an internal reference not only improved the accuracy of detection, as well as improved reproducibility. In addition, no obvious SERS changes (< 1.1%) were observed after storage in aCSF for 72 h, indicating the AuNRs-DEP probe had a long-term stability (Fig. S17 in Supporting information). Negligible change of SERS spectra was obtained at AuNRs-DEP probe in aCSF with pH varying from 6.0 to 8.0, suggesting the AuNRs-DEP probe has good pH stability (Fig. S18 in Supporting information). As demonstrated above, the developed SERS probe exhibited the intrinsic characteristics of high sensitivity, long-term stability and good reproducibility. As a result, the probe AuNRs-DEP has potential applications in single neuron and biological fluids.
Figure 4
Figure 4.
Heat map derived from SERS intensity pattern for different interferences including (a) various sulfur-containing species (10 µmol/L), (b) metal ions (10 µmol/L), (c) amino acids (100 µmol/L) and BSA (10 mg/mL) and (d) biological active molecules (10 µmol/L). (e) SERS spectra of ten AuNRs-DEP probes in aCSF solution (pH 7.4) and (f) the corresponding variation of SERS intensity at 1186, 1600, 2056 cm-1, and (g) the variation of the SERS intensity ratio of bands at 1186, 1600 cm-1 to that of 2056 cm-1 (I/IR).
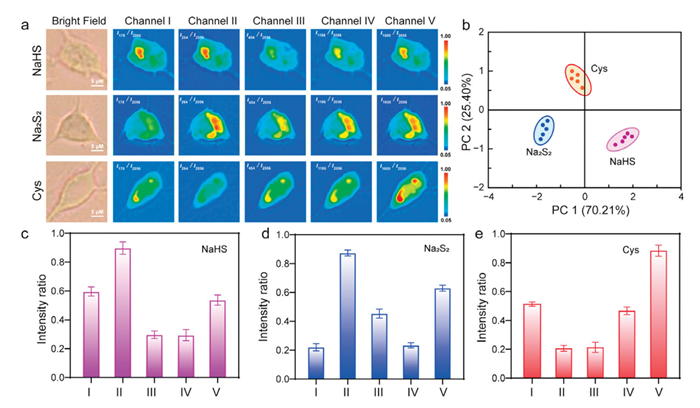
Building on the demonstrated analytical performance, reproducibility, and long-term stability of the probe, we evaluated its capability for distinguishing RSS in living neurons. The excellent biocompatibility of the AuNRs-DEP probe was first confirmed by CCK-8 and apoptosis assays, which demonstrated high neuronal viability (95%) after 24-h incubation with the AuNRs-DEP probe at the working concentration of 25 µg/mL, with viability consistently exceeding 90% even at elevated concentrations up to 100 µg/mL, indicating excellent biocompatibility (Fig. S19a in Supporting information). This result was further corroborated by flow cytometry apoptosis analysis, which showed over 84% of cells remained viable across all tested concentrations (25–100 µg/mL), collectively confirming the low cytotoxicity of our probe (Fig. S19b in Supporting information). Furthermore, efficient cellular uptake and uniform intracellular distribution of the nanoprobes were verified by quantitative ICP-MS analysis and dark-field imaging (Fig. S20 in Supporting information), confirming their successful internalization into neurons. Subsequently, neurons were co-incubated with the AuNRs-DEP probe (25 µg/mL) and individual exogenous RSS (30 µmol/L), and SERS imaging across five characteristic channels was performed (Fig. 5a). PCA based on the distinct SERS response patterns (Figs. 5c-e) yielded a score plot (Fig. 5b) in which the three RSS analytes showed clear and distinct clustering. These results confirm not only the RSS recognition ability of the AuNRs-DEP probe in living cells but also its biosafety and efficient cellular delivery.
Figure 5
Figure 5.
(a) SERS imaging of AuNRs-DEP probe in neurons in presence of 10 µmol/L NaHS, Na2S2 and Cys, respectively. (b) PCA score plot of AuNRs-DEP probe in response to NaHS, Na2S2 and Cys in neuronal cells. (c-e) Ratiometric peak intensities of I178/I2056, I264/I2056, I454/I2056, I1186/I2056 and I1600/I2056 obtained in (a).
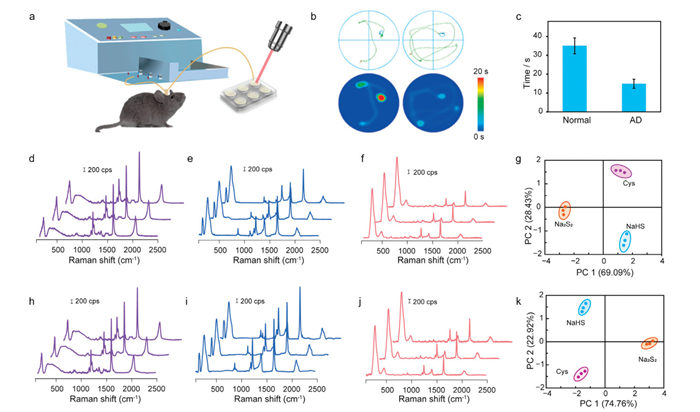
Inspired by the above results, we further evaluated the ability of the AuNRs-DEP probe to identify H2S, H2Sn, and Cys in complex microdialysate samples (Fig. 6a). Given the reported association between disrupted RSS metabolism and neurodegenerative diseases such as Alzheimer's disease (AD), we prepared cerebral microdialysates from both normal and AD model mice [41–44]. The successful establishment of the AD mouse model was verified by the Morris water maze test (Fig. 6b) [45,46]. As shown in Fig. 6c, normal mice spent significantly more time in the target quadrant than AD mice, indicating impaired spatial memory in the AD group. These behavioral results confirmed the successful construction of the AD mouse model.
Figure 6
Figure 6.
(a) Schematic illustration for extracting and monitoring cerebral microdialysates. (b) The Morris water maze pathway diagrams of normal mice (left), AD mice (right), and corresponding heat map normal mice and AD mice (bottom). (c) Mice stay in target quadrant time statistics. SERS spectra obtained with AuNRs-DEP probe in normal mouse brain microdialysis solution with 10 µmol/L Cys (d), NaHS (e), Na2S2 (f) and PCA score plots of AuNRs-DEP probe in response to NaHS, Na2S2 and Cys (g). SERS spectra obtained with AuNRs-DEP probe in AD mouse brain microdialysis solution with 10 µmol/L Cys (h), NaHS (i), Na2S2 (j) and PCA score plots of AuNRs-DEP probe in response to NaHS, Na2S2 and Cys (k).
The SERS response of the AuNRs-DEP probe was then recorded following the addition of 10 µmol/L NaHS, Na2S2, or Cys to brain microdialysates from both normal and AD mice (Figs. 6d-f, 6h-j). Changes in the five ratiometric signals (I178/I2056, I264/I2056, I454/I2056, I1186/I2056, and I1600/I2056) were monitored for each analyte. Upon addition of Cys, a distinct decrease in the peak at 178 cm-1 was observed. For Na2S2 and NaHS, the peak at 2056 cm-1 remained stable, while the intensities at 178, 1186, and 1600 cm-1 decreased to varying degrees. Subsequent PCA clearly differentiated the three spiked sulfur species based on their distinct SERS response patterns (Figs. 6g and k). Notably, the PCA score plots revealed a clear separation between the microdialysates from normal and AD mice, even when spiked with the same concentration of analyte. This distinct clustering demonstrates that our AuNRs-DEP probe is sensitive enough to detect the inherent differences in the biological matrix between normal and disease states. All of these results confirm the capability of the developed probe to distinguish exogenous H2S, H2Sn, and Cys.
In this study, we have developed a novel self-calibrating SERS probe (AuNRs-DEP) for the simultaneous detection of H2S, H2Sn, and Cys in living neurons and complex biological environments, such as brain microdialysates. The probe takes advantage of multiple binding sites and an internal reference peak to enable accurate differentiation of these biologically relevant thiols in real-time. Through a combination of multivariate PCA analysis, we have demonstrated that this probe can effectively discriminate between different thiols in the presence of complex biological matrices. Although the quantification of endogenous thiol levels in AD versus normal mouse brains was beyond the scope of this study due to the challenge of accurately measuring subtle endogenous differences, the findings underscore the probe's potential for detecting changes in thiol levels in complex biological systems, paving the way for future studies in the context of disease-relevant environments. Our results highlight the significance of this approach for advancing analytical methods aimed at further understanding the role and interconversion of thiols in diseases like Alzheimer's. This work provides a solid foundation for future research focused on understanding the dynamic behavior of biological thiols in neurodegenerative diseases and other complex biological conditions.
CRediT authorship contribution statement
Pengpeng Lu: Data curation. Weikang Wang: Formal analysis. Yue Zhao: Writing – original draft, Data curation. Hui Dong: Software, Formal analysis, Data curation. Limin Zhang: Writing – review & editing, Conceptualization.
Declaration of competing interest
The authors declare that they have no known competing financial interests or personal relationships that could have appeared to influence the work reported in this paper.
Acknowledgments
The authors greatly appreciate the financial support from National Natural Science Foundation of China (Nos. 22374049, 22022402 and ECNU-SPDH CCTM-202510 for L. Zhang, and No. 22304057 for W. Wang). We also gratefully acknowledge the support from the East China Normal University Multifunctional Platform for Innovation (004). We sincerely thank the Materials Characterization Center of East China Normal University for help with cell imaging.
Supplementary materials
Supplementary material associated with this article can be found, in the online version, at doi:10.1016/j.cclet.2025.112236.
X.L. He, N. Yan, H. Zhang, et al., Neurochem. Int. 67 (2014) 1–8. doi: 10.1155/2014/106082
Figure 1
(a) The principle of the developed SERS probe for the simultaneous biosensing of H2S, H2Sn and Cys in brain microdialysate and single neuron. (b) Synthesis routes for DEP. (c) UV–vis absorbance spectra of AuNRs and the corresponding TEM images. (d) Schematic illustration of the DEP assembled on AuNRs. (e) TEM of AuNRs-DEP. (f) XPS spectra of Au-C≡C. (g) SERS spectra of AuNRs-DEP and AuNRs.
Figure 2
(a) The reaction mechanism of DEP molecules with three sulfides. (b) LC-MS analysis of DEP solution (30 µmol/L) before and after reaction with NaHS (30 µmol/L), Na2S2 (30 µmol/L) or Cys (30 µmol/L), respectively. The m/z peaks at 616.1, 448.1, 448.0, and 715.2 were assigned to be DEP, and products of DEP with NaHS (denoted as p1), Na2S2 (p2) and Cys (p3) respectively. (c-e) SERS spectra of the developed probe after recognition of NaHS (c), Na2S2 (d) and Cys (e) respectively. (f) PCA analysis based on I178/I2056, I264/I2056, I454/I2056, I1186/I2056, I1600/I2056 to distinguish NaHS, Na2S2 and Cys.
Figure 3
SERS spectra of AuNRs-DEP probe with addition of various concentrations of NaHS (a), Na2S2 (d) and Cys (g) in aCSF (pH 7.4) respectively. NaHS, Na2S2, Cys: 0, 0.1, 1.0, 5.0, 10, 20, 40, 60 µmol/L. PCA score plots for SERS response patterns obtained with AuNRs-DEP probe against varying concentrations of NaHS (b), Na2S2 (e) and Cys (h). Score plots of PC1 versus the concentrations of NaHS (c), Na2S2 (f) and Cys (i). Inset: Linear detection ranges for NaHS (c), Na2S2 (f) and Cys (i).
Figure 4
Heat map derived from SERS intensity pattern for different interferences including (a) various sulfur-containing species (10 µmol/L), (b) metal ions (10 µmol/L), (c) amino acids (100 µmol/L) and BSA (10 mg/mL) and (d) biological active molecules (10 µmol/L). (e) SERS spectra of ten AuNRs-DEP probes in aCSF solution (pH 7.4) and (f) the corresponding variation of SERS intensity at 1186, 1600, 2056 cm-1, and (g) the variation of the SERS intensity ratio of bands at 1186, 1600 cm-1 to that of 2056 cm-1 (I/IR).
Figure 5
(a) SERS imaging of AuNRs-DEP probe in neurons in presence of 10 µmol/L NaHS, Na2S2 and Cys, respectively. (b) PCA score plot of AuNRs-DEP probe in response to NaHS, Na2S2 and Cys in neuronal cells. (c-e) Ratiometric peak intensities of I178/I2056, I264/I2056, I454/I2056, I1186/I2056 and I1600/I2056 obtained in (a).
Figure 6
(a) Schematic illustration for extracting and monitoring cerebral microdialysates. (b) The Morris water maze pathway diagrams of normal mice (left), AD mice (right), and corresponding heat map normal mice and AD mice (bottom). (c) Mice stay in target quadrant time statistics. SERS spectra obtained with AuNRs-DEP probe in normal mouse brain microdialysis solution with 10 µmol/L Cys (d), NaHS (e), Na2S2 (f) and PCA score plots of AuNRs-DEP probe in response to NaHS, Na2S2 and Cys (g). SERS spectra obtained with AuNRs-DEP probe in AD mouse brain microdialysis solution with 10 µmol/L Cys (h), NaHS (i), Na2S2 (j) and PCA score plots of AuNRs-DEP probe in response to NaHS, Na2S2 and Cys (k).


 DownLoad:

 下载:
下载:


 下载:
下载:

