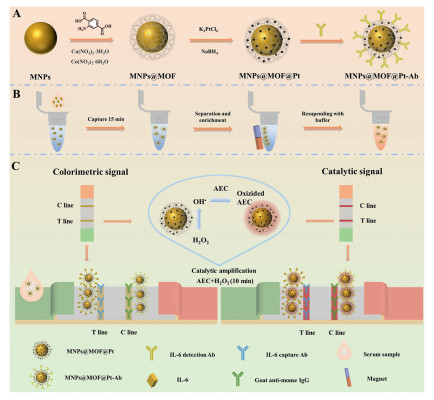
Scheme 1.
(A) Preparation of MNPs@MOF@Pt-Ab immunoprobes. (B) The process of capturing IL-6 by immunoprobes. (C) Schematic diagram of MNPs@MOF@Pt-based LFIA for the detection of IL-6.
Metal-organic framework mediated magnetic nanozyme enhanced lateral flow immunoassay diagnosis
Ying Wang , Zhengna Duan , Jin Shen , Ruilong Song , Xiaoya Hu , Yun Shu

As an inflammatory marker, interleukin-6 (IL-6) shows important clinical significance in infectious diseases, autoimmune diseases, tumors, and cardiovascular diseases [1-3]. Traditional detection techniques were unable to meet the requirements of point-of-care testing (POCT). Lateral flow immunoassays (LFIA) have received extensive attention in POCT disease diagnosis due to its advantages of rapidity, simplicity, stability, and instrument-free detection [4-7]. However, the color intensity of traditional gold nanoparticles (Au NPs)-based LFIA is relatively weak, and its insufficient sensitivity makes it difficult to detect low-concentration serum markers [8-10]. Therefore, there is an urgent need to design novel signal labels for enhancing the detection sensitivity of LFIA.
In recent years, catalytic colorimetric nanomaterials have garnered increasingly widespread attention in the field of biosensing due to their unique colorimetric properties and catalytic functions [11-13]. The enzyme-like activity of these nanoparticles can catalyze the oxidation of chromogenic substrate for colorimetric signal amplification, further improving the detection sensitivity [14-17]. Based on the above advantages, these nanomaterials can be used as novel signal labels for LFIA. Catalytic colorimetric nanomaterials mainly include metal-based (e.g., gold, platinum and iron oxide), carbon-based (e.g., carbon nanotubes (CNTs) and graphene oxide (GO)) and nanocomposites based on natural enzymes [18-23]. Iron oxide nanoparticles (Fe3O4 NPs) were the first nanomaterials to be discovered with peroxidase-like activity. Their magnetic properties, inherent color and catalytic activity features have attracted widespread attention [24,25]. However, the inherent color brightness and catalytic activity of Fe3O4 NPs are insufficient, leading to low detection sensitivity and thus limits their wide application in the field of biosensing [26,27]. In order to enhance the detection sensitivity of Fe3O4 NPs, many researchers have reported the preparation of various multifunctional nanocomposite materials to improve the color intensity and enzymatic activity of Fe3O4 NPs [28,29]. Among them, noble metal nanoparticles have attracted widespread attention due to their excellent enzyme-like activity. However, due to the small size of precious metal nanoparticles, they are prone to aggregation and cannot be effectively deposited on the surface of the Fe3O4 NPs [30,31]. Moreover, the Fe3O4 NPs have a magnetic shielding effect, and direct deposition would cause a significant decrease in their saturation magnetization [32,33]. Therefore, an interfacing layer needs to be introduced between Fe3O4 NPs and noble metal nanoparticles to glue them.
Recent studies have shown that metal-organic framework (MOF), due to their high porosity, high specific surface area and excellent stability, can provide an ideal platform for the loading of nanoparticles [34-39]. Our previous work reported that a Zr-MOF was used as the matrix for loading PtNi nanoparticles (PtNi NPs), which effectively prevented the aggregation of PtNi NPs and thereby enhanced its stability and catalytic activity [40]. Therefore, MOF can serve as an excellent carrier to load noble metal nanoparticles, thereby enhancing their stability.
In this study, MOF was used as a mediate interfacing layer for loading Pt nanoparticles (Pt NPs) on the magnetic nanoparticles (MNPs) to obtain a multifunctional magnetic catalytic colorimetric nanomaterial (MNPs@MOF@Pt). And then a catalytic-colorimetric LFIA based on MNPs@MOF@Pt was constructed for the highly sensitive detection of IL-6 in serum (Scheme 1). Firstly, Cu-Co MOF was grown in situ using MNPs as the core, and then Pt NPs was also in situ grown on MOF surface to prepare the MNPs@MOF@Pt nanocomposite material. Results indicated that the MOF interfacing layer facilitates the uniform growth of Pt NPs on MNPs. And the loading of Pt NPs endows the MNPs@MOF with excellent peroxidase activity and enhanced colorimetric signal intensity. Furthermore, the obtained MNPs@MOF@Pt deserves three functions of rapid magnetic response, increased colorimetric signal intensity and excellent catalytic activity. Following integration with the dual-antibody sandwich LFIA platform, the detection limits of IL-6 before and after catalysis were 8.3 and 2.8 pg/mL, respectively, representing a 58-fold and 171-fold improvement compared to Au NPs-based LFIA. In conclusion, this study indicates that the proposed multifunctional nanocomposite material can serve as a novel signal marker for LFIA, and it shows great potential for application in POCT.
The Fe3O4 NPs were first synthesized by a solvothermal method according to the previously reported method [41]. Transmission electron microscopy (TEM) (Fig. 1A) and scanning electron microscopy (SEM) images (Fig. S1A in Supporting information) revealed that the synthesized MNPs with an average size of 207 ± 18 nm. Subsequently, MNPs@MOF was prepared by in-situ growth of a Cu-Co MOF shell using MNPs as the core. It can be observed from Fig. 1B and Fig. S1B (Supporting information) that the obtained MNPs@MOF showed a distinct core-shell structure and the size of 259 ± 23 nm. Finally, the Pt nanoparticles with sizes of approximately 7 nm were loaded onto the MNPs@MOF, resulting in the formation of MNPs@MOF@Pt nanocomposite materials (Fig. 1C and Fig. S1C in Supporting information). The high-resolution TEM (HRTEM) image (Fig. 1D) of MNPs@MOF@Pt showed that the interplanar spacing of the [111] plane of Pt NPs was 0.238 nm. The energy dispersive spectroscopy (EDS) mapping images (Fig. 1E) and energy dispersive X-ray (EDX) spectrum (Fig. S2 in Supporting information), both indicated that the elements of Fe, Cu, Co, Pt, C, N and O were uniformly distributed in the MNPs@MOF@Pt nanocomposite. The crystal structure of the nanocomposites was analyzed through X-ray diffraction (XRD). As illustrated in Fig. 1F, the diffraction peaks of the MNPs@MOF@Pt nanocomposite material match well with those of MNPs, Cu-Co MOF and Pt NPs. Specifically, the main peak at 35.4° belongs to the (311) crystal plane of MNPs (JCPDS 74–0748), the main peak at 40.2° belongs to the (111) crystal plane of Pt NPs (JCPDS No 87–0647), the diffraction peaks at 43.3°, 50.4° and 74.1° correspond to the (111), (200) and (220) crystal planes of the MOF (JCPDS No 85–1326), respectively. As shown in the Fourier transform infrared (FT-IR) spectra of Fig. 1G, the absorption peaks at 1632 and 1406 cm-1 were ascribed to the stretching vibrations of C=O and C—O bonds in carboxylate groups respectively, whereas the peak at 619 cm-1 was associated with the stretching vibrations of Fe-O bonds.
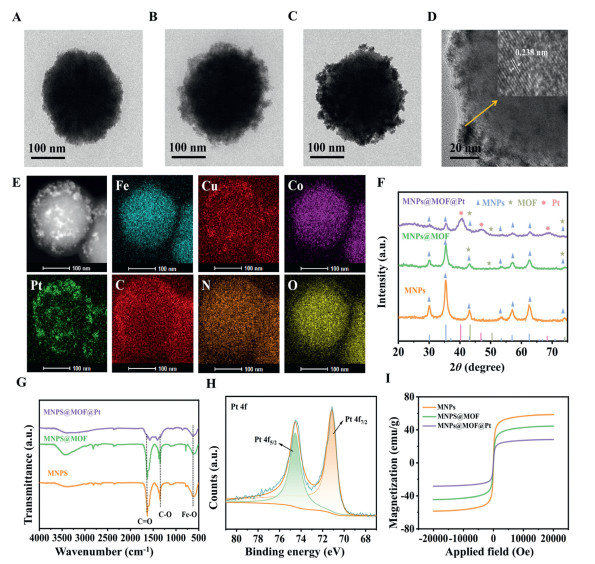
Furthermore, the X-ray photoelectron spectroscopy (XPS) analysis (Fig. S3 in Supporting information) showed that the surface of the nanocomposite materials contained Fe, Cu, Co, Pt, C, N and O elements, which was consistent with previous results of EDS mapping and EDX analysis. The high-resolution Fe 2p spectrum were exhibited in Fig. S4A (Supporting information), the peaks at 710.60 and 724.30 eV are assigned to Fe2+ in the Fe 2p3/2 and Fe 2p1/2 orbitals, respectively, whereas the peaks at 712.20 and 726.36 eV correspond to Fe3+ in the Fe 2p3/2 and Fe 2p1/2 orbitals, respectively. The satellite peak at 718.69 eV can be attributed to the coexistence of Fe2+and Fe3+. The peaks at 931.85 and 951.87 eV (Fig. S4B in Supporting information) were assigned to the Cu 2p3/2 and Cu 2p1/2 states of Cu, respectively, confirming the presence of Cu2+. The high-resolution Co 2p spectra (Fig. S4C in Supporting information) revealed a binding energy of 782.79 eV for Co 2p3/2. In the Pt 4f spectra (Fig. 1H), two peaks corresponding to Pt 4f7/2 (71.14 eV) and Pt 4f5/2 (74.55 eV) were observed. Compared with the individual Pt NPs, the platinum peak shifts towards the high binding energy direction and undergoes electron transfer [42]. The high-resolution C 1s spectra (Fig. S5A in Supporting information) showed four peaks at 284.8, 286.1, 287.9 and 288.6 eV, which corresponded to the bond of C—C, C—O, C=O and O—C=O, respectively. The high-resolution N 1s spectra (Fig. S5B in Supporting information) showed a peak at 399.8 eV, which corresponded to the bond of N—H. The two peaks of O 1s spectra (Fig. S5C in Supporting information) located at 530.0 and 531.5 eV, which were attributed to the bond of Fe-O and C—O, respectively. In conclusion, all the aforementioned results collectively confirmed the successful preparation of the MNPs@MOF@Pt nanocomposite. In addition, the superparamagnetism of the nanocomposite materials were studied and results were showed in Fig. 1I, in which the saturation magnetization values of MNPs, MNPs@MOF and MNPs@MOF@Pt were 58.5, 44.6 and 28.3 emu/g, respectively. Magnetic recovery efficiency was a key indicator for evaluating the practical application value of MNPs@MOF@Pt nanocomposites. As shown in Fig. S6A (Supporting information), there was a linear correlation between the concentration of MNPs@MOF@Pt nanocomposites and its absorbance at 450 nm. The absorbance of MNPs@MOF@Pt and its supernatant after magnetic separation was recorded respectively (Fig. S6B in Supporting information), the concentration of the material before and after magnetic separation was calculated according to the above linear regression equation. Then the magnetic recovery efficiency of MNPs@MOF@Pt nanocomposites was calculated to be about 95%.
The peroxidase-like activity of the nanomaterials was investigated by monitoring the changes of the color and absorbance using 3,3′,5,5′-tetrame-thylbenzidine (TMB) as chromogenic substrate under the presence of H2O2. The peroxidase-like activities of MNPs, MNPs@Cu-MOF, MNPs@Cu-Co MOF, MNPs@Cu-MOF@Pt and MNPs@Cu-Co MOF@Pt were compared under the same conditions. As shown in Fig. 2A, the MNPs displayed relatively weak catalytic activity. With a bimetallic Cu-Co MOF coating, the overall catalytic activity enhanced, and the catalytic activity of bimetallic MNPs@Cu-Co MOF exhibited 4-fold higher activity than MNPs@Cu-MOF. Moreover, after loading Pt NPs on MOF, the overall catalytic activity significantly enhanced. The reason may be that an electron transfer occurred between Pt NPs and MNPs@Cu-Co MOF which proved by previous XPS analysis, thereby enhancing the peroxidase activity. The catalytic activity of MNPs@Cu-Co MOF@Pt was also higher than that of MNPs@Cu-MOF@Pt. It indicated that Cu-Co MOF can be a good matrix to load Pt NPs.
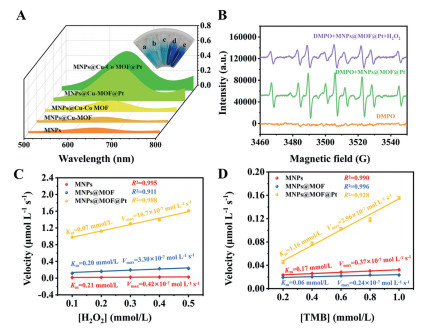
Subsequently, free radicals generated during the catalytic process were analyzed by electron paramagnetic resonance (EPR) technique. As illustrated in Fig. 2B, when 5,5-dimethyl-1-pyrroline-N-oxide (DMPO) was used as the spin trapping agent, the obvious DMPO—H characteristic signal was observed in the absence of H2O2. This phenomenon indicated that the hydroxyl in nanocomposite was first catalyzed by Pt NPs to generate H•. The amount of generated H• was reduced after the addition of H2O2. It is speculated that OH• might have been produced but there was no obvious intensity value of 1:2:2:1 quadruple peak, which might be due to the overlapping of the OH• peak with the H• peak [43].
In addition, in order to further investigate the catalytic activity of nanozymes, steady-state kinetic analysis was conducted for MNPs, MNPs@MOF and MNPs@MOF@Pt, respectively. The values of Michaelis–Menten constant (Km) and maximum initial velocity (Vmax) under different concentrations of H2O2 and TMB were calculated by the Lineweaver-Burk equation ((1), (2)), which were used to evaluate the catalytic ability of the nanozyme.
|
|
(1) |
|
|
(2) |
According to the above equation, the MNPs@MOF@Pt demonstrated the smallest value of Km (0.07 mmol/L) and maximal value Vmax (16.7 × 10⁻⁷ mol L-1s-1) under different concentrations of H2O2, compared with the other two types of nanomaterials (Fig. 2C, Figs. S7-S9 and S13A in Supporting information); the values of Km and Vmax for MNPs@MOF@Pt were determined to be 1.16 mmol/L and 2.96 × 10⁻⁷ mol L-1s-1, respectively, under different concentrations of TMB (Fig. 2D, Figs. S10-S12 and S13B in Supporting information). Furthermore, compared with the previously reported nanozymes and nature enzyme (Table S1 in Supporting information), the Km value of the MNPs@MOF@Pt was lower and the Vmax was higher. These results all indicated that the MNPs@MOF@Pt nanozymes possess excellent substrate affinity and relatively high peroxidase-like activity.
In order to ensure the accuracy and reproducibility of MNPs@MOF@Pt nanomaterials during the testing process, its stability under different media and temperatures was further studied. First, the UV–vis absorption spectra of MNPs, MNPs@MOF and MNPs@MOF@Pt were recorded (Fig. S14A in Supporting information), the absorbance of MNPs@MOF@Pt showed strongest at 450 nm. Therefore, the absorbance at 450 nm was monitored to study the storage stability of MNPs@MOF@Pt in PBS buffer solution and serum. The MNPs@MOF@Pt nanocomposites were stored in PBS buffer and serum at room temperature for 10 days, respectively (Fig. S14B in Supporting information). It is observed that the absorbance value at 450 nm remained at 89.5% and 93.1% of the original value respectively, indicating that it has good storage stability in different medium. Subsequently, the changes in absorbance intensity of MNPs@MOF@Pt after incubation at 60 ℃ for 12 h and its peroxidase-like catalytic ability for TMB were recorded respectively to study its thermal stability. The absorbance of MNPs@MOF@Pt at 450 nm was 81.9% of the original value (Fig. S14C in Supporting information), and the absorbance of the oxidation product TMBox at 652 nm remains at 75.1% of the original value (Fig. S14D in Supporting information) after incubation of MNPs@MOF@Pt at 60 ℃ for 12 h. In summary, the MNPs@MOF@Pt showed excellent stability.
In addition, the stability of MNPs@MOF@Pt on the test strips was also investigated in order to facilitate its better application in LFIA. First of all, the MNPs, MNPs@MOF and MNPs@MOF@Pt of the same concentration were sprayed onto the test strips at the same flow rate respectively, and it was observed that the signal intensity of the bands gradually increased (Fig. 3A). The results suggested that the incorporation of Pt NPs not only improved the catalytic activity but also amplified the colorimetric signal intensity. The MNPs@MOF@Pt was sprayed onto the test strip and stored at 4 ℃ for 8 d. The color intensity of the band and the catalytic oxidation ability of 3-amino-9-ethylcarbazole (AEC) were measured every two days (Fig. 3B), The band intensity of the three parallel experiments showed almost no change. These results indicated that MNPs@MOF@Pt could serve as an excellent colored probe.
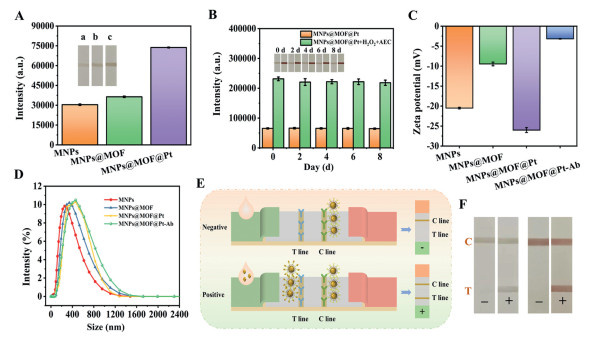
In this study, the MNPs@MOF@Pt-Ab probe was prepared by the method of electrostatic adsorption. Subsequently, the immunoprobes were analyzed via zeta potential and dynamic light scattering (DLS) measurements. As depicted in Fig. 3C, the zeta potential of MNPs shifted from −20.70 mV to −9.06 mV after loading MOF, and then further changed to −26.70 mV after Pt NPs loading. After being conjugated with antibodies, the zeta potential of MNPs@MOF@Pt was transformed into −3.16 mV. Fig. 3D displays that the hydrodynamic diameter of MNPs@MOF@Pt-Ab was larger than that of MNPs@MOF@Pt. And it can be also observed that the hydrodynamic diameter of MNPs@MOF@Pt, MNPs@MOF and MNPs is in the order of MNPs@MOF@Pt > MNPs@MOF > MNPs. All above results further demonstrated the successful preparation of MNPs@MOF@Pt and immunoprobes. In addition, the MNPs@MOF@Pt-Ab was used as a signal label for construction of dual-readout LFIA platform for the detection of IL-6. Fig. 3E illustrates the detection principle of the MNPs@MOF@Pt-based dual-antibody sandwich LFIA for IL-6. The target IL-6 was present in the sample and first captured by immunoprobes. Through capillary effect, the immunocomplexes were captured by the IL-6 capture antibodies on the T line to form a sandwich structure. Excessive probes were captured by goat anti-mouse IgG immobilized on the C line. When there was no target object present, the probe was directly captured by IgG on the C line. Subsequently, the test strip was immersed in AEC chromogenic substrate solution for reaction. The T line and C line were covered with a large amount of insoluble reddish-brown precipitates. The colorimetric signal enhancement leads to an improvement in the detection sensitivity of LFIA. Fig. 3F showed the results of the MNPs@MOF@Pt-based LFIA for the detection of IL-6, which were consistent with the design principle. In conclusion, this method for detecting of IL-6 is feasible.
To achieve best detection performances, the MNPs@MOF@Pt-based LFIA were systematically optimized. Firstly, the concentration of the IL-6 detection antibodies coupled to MNPs@MOF@Pt was optimized. Fig. S15A (Supporting information) showed that the T line intensity was the highest when the antibody concentration was 17 µg/mL. Therefore, the optimal antibody concentration was determined to be 17 µg/mL. As illustrated in Fig. S15B (Supporting information), the highest T line intensity was achieved when the volume of the immunoprobes was 5 µL, so it was selected as the optimal amount of volume of probe. Blocking solution can reduce background interference and enhance the specificity of the detection signal. When the final concentration of bovine serum albumin (BSA) was 1.1%, the sealing effect was the best (Fig. S15C in Supporting information). Furthermore, MNPs@MOF@Pt exhibited excellent peroxidase-like activity, it was necessary to study the reaction time and substrate concentration of the catalyzed reaction. The catalytic reaction conditions were optimal when the catalytic time was 10 min and the concentration of AEC was 0.04% (Figs. S16A and B in Supporting information).
Under the aforementioned optimal detection conditions, standard samples of IL-6 with different concentrations were tested by the MNPs@MOF@Pt-based LFIA. The color of the T lines before and after catalysis gradually darkened with increasing IL-6 concentration (Fig. 4A). Figs. 4B and C indicated that the intensity of the T lines before and after catalysis had a good linear relationship within the concentration range of IL-6 (0–50 ng/mL). The linear regression equation before catalysis was y = 0.1807x + 4.4555 (R2 = 0.978), with a limit of detection (LOD) of 8.3 pg/mL. The linear regression equation after catalysis was y = 0.2115x + 4.8841 (R2 = 0.991), with a LOD of 2.8 pg/mL. As shown in Fig. S17 (Supporting information), the MNPs@MOF@Pt-based LFIA outperformed the Au NPs-based LFIA (LOD = 0.48 ng/mL) for IL-6 detection. Compared with other methods for detecting IL-6 (Table S2 in Supporting information), this method demonstrates excellent analytical performance in the aspect of detection. These results suggest that MNPs@MOF@Pt-Ab can serve as an excellent signal probe for detecting IL-6 to improve detection sensitivity.
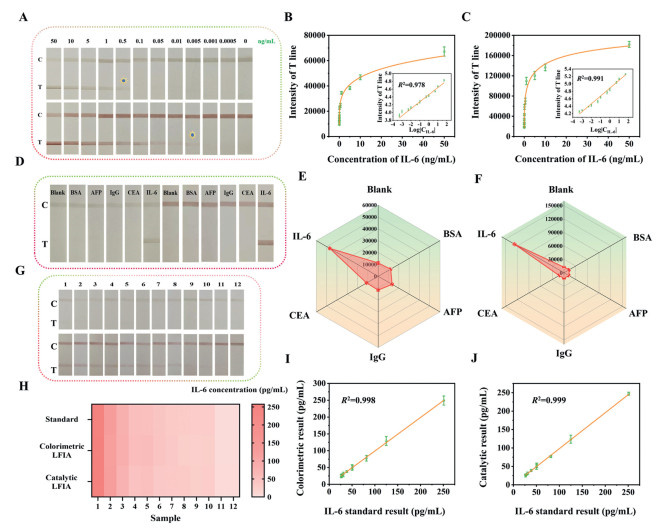
In addition, the selectivity and anti-interference of the MNPs@MOF@Pt-based LFIA was investigated by detecting several potential interfering proteins, including BSA, alpha-fetoprotein (AFP), carcinoembryonic antigen (CEA) and human IgG (all at 10 ng/mL). Figs. 4D-F displays that the significant signal response was observed for IL-6 (10 ng/mL), and the blank control and other interfering substances showed no obvious response. IL-6 was added together with these interferents to investigate the anti-interference performance, respectively. As shown in Fig. S18 (Supporting information), the interferents had little impact on IL-6 detection. These findings confirmed the excellent selectivity and anti-interference capability of the proposed method. To further investigate the reproducibility of the LFIA, we conducted parallel test by using five individual IL-6 (10 ng/mL) test strips. As illustrated in Fig. S19 (Supporting information), the relative standard deviations (RSD) before and after catalysis for five test strips were 2.4% and 7.4% respectively, which indicated that this detection method displayed good reproducibility. The test strips coated with IL-6 capture antibodies were stored at 4 ℃. Then the test strips were used to detect IL-6 every five days to verify the stability of this method. The intensity of the T lines was 93.7% and 94.4% of the colorimetric and catalytic origin values respectively after stored for 30 days (Fig. S20 in Supporting information). It indicated that this LFIA possessed excellent stability.
The practicability of the MNPs@MOF@Pt-based LFIA was further evaluated by testing 12 clinical human serum samples, including 2 healthy individuals (numbers 11–12) and 10 patients (numbers 1–10). The human serum samples were obtained from Subei People's Hospital in Jiangsu Province. Ethical approval for the use of these samples was granted by the Ethics Committee of Yangzhou University (Approval No. YXYLL-2023–104). Detection results were compared with the results measured by the standard method in hospital. Figs. 4G and H reveals that the colorimetric and catalytic signals can correctly distinguish all patient and healthy human serum samples without false negative or false positive results. Moreover, the results before and after catalysis were highly correlated with the standard results (Figs. 4I and J, correlation coefficient of 0.998 and 0.999, respectively). Finally, different concentrations of IL-6 antigen (10, 50, 250 pg/mL) were separately added to two serum samples for the determination of recovery rates. The results indicated that the average recovery rate ranged from 97.7%−100.2% by colorimetric method and 92.6%−100.0% by catalytic method (Table S3 in Supporting information). In conclusion, this MNPs@MOF@Pt-based LFIA showed great potential for application in clinical diagnosis.
In summary, this study reported a multifunctional MNPs@MOF@Pt magnetic nanozyme that integrates colorimetric, catalytic and magnetic properties, and it was applied to a LFIA platform for the highly sensitive detection of IL-6 in human serum. The experimental findings indicated that the prepared MNPs@MOF@Pt composite materials displayed the following advantages: (1) The magnetic properties of this material effectively reduced the matrix interference in sample analysis, achieved the enrichment of the target substance, and enhanced the detection sensitivity; (2) The MOF shell provided a stable loading platform for Pt NPs and generated an efficient synergistic catalytic effect, significantly enhancing the catalytic activity of the nanomaterials; (3) The MNPs@MOF@Pt composite material showed excellent biocompatibility. When coupled with antibodies, it can protect the high activity of the antibodies and reduce the interference caused by non-specific adsorption. Based on the above advantages, the MNPs@MOF@Pt-based LFIA platform successfully achieved highly sensitive detection of IL-6 (2.8 pg/mL). This study demonstrated that the prepared MNPs@MOF@Pt multifunctional magnetic nanozyme can serve as a novel label for the LFIA platform and hold great application potential in POCT disease diagnosis.
The authors declare that they have no known competing financial interests or personal relationships that could have appeared to influence the work reported in this paper.
Ying Wang: Writing – original draft, Methodology, Formal analysis. Zhengna Duan: Investigation, Methodology. Jin Shen: Investigation, Methodology. Ruilong Song: Visualization, Methodology. Xiaoya Hu: Supervision. Yun Shu: Conceptualization, Supervision, Methodology, Writing – review & editing, Project administration.
We gratefully acknowledge the financial support from the NSFC (No. 21705141), the Project for Science and Technology of Yangzhou (No. YZ2024071), the High-end talent support program of Yangzhou University, and the open funds of the State Key Laboratory of Chem and Biosensing (Hunan University).
Supplementary material associated with this article can be found, in the online version, at doi:
R.D. Crapnell, W. Jesadabundit, A. García-Miranda Ferrari, et al., Anal. Chem. 93 (2021) 5931–5938. doi: 10.1021/acs.analchem.1c00417
Y. Zhang, D. Liu, W. Chen, et al., Adv. Mater. 36 (2024) 2409661. doi: 10.1002/adma.202409661
M. Chen, G. Liu, L. Wang, et al. Anal. Chem. 97 (2025) 4397–4406. doi: 10.1021/acs.analchem.4c05537
Y. Wang, J. Shen, R. Song, et al., Talanta 266 (2024) 125017. doi: 10.1088/1361-6544/ad8c0d
W. Wang, Q. Cao, J. He, et al., Nano Lett. 24 (2024) 8311–8319. doi: 10.1021/acs.nanolett.4c01568
Y. Chen, J. Ma, X. Yin, et al., Biosens. Bioelectron. 224 (2023) 115075. doi: 10.1016/j.bios.2023.115075
H.J. Gong, Q.T. Zeng, S.L. Gai, et al., Chin. Chem. Lett. 36 (2025) 110059. doi: 10.1016/j.cclet.2024.110059
D. Li, M. Huang, Z. Shi, et al., Anal. Chem. 94 (2022) 2996–3004. doi: 10.1021/acs.analchem.1c05364
L. Jing, C.Y. Xie, Q.Q. Li, et al., J. Anal. Test. 6 (2022) 120–128. doi: 10.1007/s41664-022-00228-w
G.C. Guo, T.Y. Zhao, R.C. Sun, et al., Chin. Chem. Lett. 35 (2024) 109198. doi: 10.1016/j.cclet.2023.109198
M. Song, J. Xing, H. Cai, et al., ACS Nano 17 (2023) 10748–10759. doi: 10.1021/acsnano.3c02164
Z. Wei, K. Luciano, X. Xia, ACS Nano 16 (2022) 21609–21617. doi: 10.1021/acsnano.2c10574
R. Chen, X. Chen, Y. Zhou, et al., ACS Nano 16 (2022) 3351–3361. doi: 10.1021/acsnano.2c00008
V.G. Panferov, W. Zhang, N. D'Abruzzo, et al., Langmuir. 41 (2025) 4894–4905. doi: 10.1021/acs.langmuir.4c05238
X. Lin, P. Zhou, Q. Li, et al., Anal. Chem. 96 (2024) 10686–10695. doi: 10.1021/acs.analchem.4c01580
Y. Tang, Y. Chen, Y. Liu, et al., Anal. Chem. 94 (2022) 17787–17794. doi: 10.1021/acs.analchem.2c03433
V.G. Panferov, J. Liu, Adv. Opt. Mater. 12 (2024) 2401318. doi: 10.1002/adom.202401318
H. Song, D.H. Jung, Y. Cho, et al., Coord. Chem. Rev. 541 (2025) 216835. doi: 10.1016/j.ccr.2025.216835
C. Li, Y. Li, S. Wu, et al., Small Methods 9 (2024) 2400738.
P. Zhou, Y. Dai, X. Lin, et al., Adv. Funct. Mater. 34 (2024) 2400875. doi: 10.1002/adfm.202400875
P.K. Boruah, M.R. Das, J. Hazard. Mater. 385 (2020) 121516. doi: 10.1016/j.jhazmat.2019.121516
J. Liu, G. Ruan, W. Ma, et al., Biosens. Bioelectron. 198 (2022) 113823. doi: 10.1016/j.bios.2021.113823
R.X. Liu, F. Shi, Y.P. Xia, et al., Chin. Chem. Lett. 35 (2024) 109664. doi: 10.1016/j.cclet.2024.109664
F. Yu, B. Fan, Y. Chai, et al., Food Chem. X 22 (2024) 101485. doi: 10.1016/j.fochx.2024.101485
H.S. Zheng, Y.Y. Hou, S. Li, et al., Chin. Chem. Lett. 34 (2023) 107253. doi: 10.1016/j.cclet.2022.02.058
K. Wang, D. Yu, X. Liang, et al., Microchem. J. 204 (2024) 111104. doi: 10.1016/j.microc.2024.111104
C. Jiao, W. Duan, X. Wu, et al., Anal. Chem. 95 (2023) 11316–11325. doi: 10.1021/acs.analchem.3c01375
X. Liao, B. Li, L. Wang, et al., Biosens. Bioelectron. 264 (2024) 116637. doi: 10.1016/j.bios.2024.116637
C. Liu, X. Zhao, Z. Wang, et al., J. Nanobiotechnol. 21 (2023) 427. doi: 10.1145/3575693.3575731
B. Sun, V. Panferov, X. Guo, et al., Biosens. Bioelectron. 267 (2025) 116797. doi: 10.1016/j.bios.2024.116797
Y. Zhong, X.T. Zheng, Q.L. Li, et al., Biosens. Bioelectron. 224 (2023) 115033. doi: 10.1016/j.bios.2022.115033
S. Zhai, H. Dong, H. Wang, et al., J. Hazard. Mater. 477 (2024) 135296. doi: 10.1016/j.jhazmat.2024.135296
Y. Su, X. Chen, H. Huang, et al., Aggregate 5 (2024) e459. doi: 10.1002/agt2.459
K.Y. Wong, Z. Nie, M.S. Wong, et al., Adv. Mater. 36 (2024) 2404053. doi: 10.1002/adma.202404053
Q. Ye, T. Dai, J. Shen, et al., J. Anal. Test. 7 (2023) 16–24. doi: 10.1007/s41664-022-00246-8
Q. Ye, E. Yuan, J. Shen, et al., Adv. Sci. 10 (2023) 2304149. doi: 10.1002/advs.202304149
Y. Shu, Q. Ye, T. Dai, et al., J. Hazard. Mater. 430 (2022) 128360. doi: 10.1016/j.jhazmat.2022.128360
Y. Shu, Q. Ye, T. Dai, et al., ACS Sens. 6 (2021) 641–658. doi: 10.1021/acssensors.0c02562
Y. Gong, Y. Ding, Q. Tang, et al., Chin. Chem. Lett. 35 (2024) 108475. doi: 10.1016/j.cclet.2023.108475
J. Shen, Y. Wang, Z. Duan, et al., Biosens. Bioelectron. 273 (2025) 117189. doi: 10.1016/j.bios.2025.117189
L. Yan, L. Dou, T. Bu, et al., Food Chem. 261 (2018) 131–138. doi: 10.1016/j.foodchem.2018.04.016
X. Han, X. Ge, W.W. He, et al., Nano Res. 17 (2024) 4908–4915. doi: 10.1007/s12274-024-6483-y
X. Li, W. Tan, J. Fan, et al., ACS Nano 18 (2024) 24162–24172. doi: 10.1021/acsnano.4c05516

Scheme 1 (A) Preparation of MNPs@MOF@Pt-Ab immunoprobes. (B) The process of capturing IL-6 by immunoprobes. (C) Schematic diagram of MNPs@MOF@Pt-based LFIA for the detection of IL-6.

Figure 1 TEM images of (A) MNPs, (B) MNPs@MOF, and (C) MNPs@MOF@Pt. (D) HRTEM images of MNPs@MOF@Pt. (E) EDS mapping images of MNPs@MOF@Pt including the elements of Fe, Cu, Co, Pt, C, N, and O. (F) XRD spectra of MNPs, MNPs@MOF, and MNPs@MOF@Pt. (G) FT-IR spectra of MNPs, MNPs@MOF, and MNPs@MOF@Pt. (H) The high-resolution XPS spectra of Pt 4f for MNPs@MOF@Pt. (I) Magnetic hysteresis loops.

Figure 2 (A) The UV–vis absorption spectra of TMB oxidized by (a) MNPs, (b) MNPs@Cu-MOF, (c) MNPs@Cu-Co MOF, (d) MNPs@Cu-MOF@Pt, and (e) MNPs@Cu-Co MOF@Pt catalyzing H2O2. Inset shows the digital images of solutions. (B) EPR spectra of MNPs@MOF@Pt in DMPO system. Steady-state kinetic assay of MNPs, MNPs@MOF and MNPs@MOF@Pt by varying H2O2 concentration (C) and TMB concentration (D).

Figure 3 (A) Comparison of the grayscale values of MNPs, MNPs@MOF, and MNPs@MOF@Pt on the test strips at identical concentrations. (B) The comparison of colorimetric and catalytic intensities of MNPs@MOF@Pt sprayed on the test strips after storage for 8 d All tests were repeated three times. The zeta potential (C) and DLS (D) analysis of MNPs, MNPs@MOF, MNPs@MOF@Pt and MNPs@MOF@Pt-Ab immunoprobes. (E) Detection principle of MNPs@MOF@Pt-based LFIA for IL-6. (F) The test result.

Figure 4 (A) Results of MNPs@MOF@Pt-based LFIA strips in response to various concentrations of IL-6. The standard curves of the LFIA strips for colorimetric (B) and catalytic (C) analysis of IL-6. (D) Selectivity of MNPs@MOF@Pt-based LFIA strips. The colorimetric (E) and catalytic (F) intensity change of T line in the presence of IL-6 or other interferents, respectively. (G) Detection results of MNPs@MOF@Pt-based LFIA strips for IL-6 in human serum samples. (H) The heat map analysis of clinical samples. (I) Correlation analysis between the colorimetric assay results and the standard values. (J) Correlation analysis between catalytic assay results and standard values. All tests were repeated three times.

 扫一扫看文章

扫一扫关注我们
 DownLoad:
 下载:
下载:
 下载:
下载: