Citation:
Limin Yu, Lijing Wang, Huanning Li, Pan Li, Hongxia Liu, Meng Liu, Junjie Zhang, Wei Wei, Shijie Li. Ti–Cl bond induced fast electron transfer in OH− regulated SrBi4Ti4O15/BiOCl for enhanced piezo-photocatalytic antibiotic degradation[J]. Chinese Chemical Letters,
2026, 37(7): 112228.
doi:
10.1016/j.cclet.2025.112228
Ti–Cl bond induced fast electron transfer in OH− regulated SrBi4Ti4O15/BiOCl for enhanced piezo-photocatalytic antibiotic degradation
English
Ti–Cl bond induced fast electron transfer in OH− regulated SrBi4Ti4O15/BiOCl for enhanced piezo-photocatalytic antibiotic degradation
Henan engineering center of new energy battery materials, Henan D&A engineering center of advanced battery materials, Shangqiu Normal University, Shangqiu 476000, China
b.
Jiangxi province key Laboratory of environmental pollution prevention and pontrol in Mining and Metallurgy, Jiangxi University of Science and Technology, Ganzhou 341000, China
c.
National Engineering Research Center for Marine Facility Aquaculture, Zhejiang Ocean University, Zhoushan 316000, China
d.
Henan Engineering Research Center of Resource & Energy Recovery from Waste, School of Energy Science and Technology, Henan University, Zhengzhou 450046, China
e.
School of Chemistry and Civil Engineering, Shaoguan University, Shaoguan 512005, China
Received Date:
25 August 2025 Accepted Date:
07 December 2025 Revised Date:
14 November 2025 Available Online:
15 July 2026
Abstract:
This study presents a OH− concentration-regulated one-step hydrothermal synthesis of a novel SrBi4Ti4O15/BiOCl heterojunction for efficient antibiotic degradation. Precise control of alkaline conditions enabled the in-situ generation of Ti–Cl bonds at the heterointerface, with their presence and nature further corroborated by Raman and XPS analyses. The SBTO/BOC heterojunction demonstrated significantly enhanced charge separation, achieving a 91.5% tetracycline degradation rate under illumination, outperforming pure BiOCl (71.9%) and SBTO (54.8%). Radical trapping and EPR studies identified •O2− and •OH as the primary reactive species. The catalyst exhibited robust stability, broad pH tolerance, and resistance to ionic interference. Tetracycline degradation efficiency further improves under combined light and ultrasonic irradiation, leveraging piezoelectric polarization to boost charge separation. LC-MS analysis revealed reduced toxicity of degradation intermediates. This work highlights the strategic role of OH−-mediated interface engineering in designing efficient ferroelectric heterojunctions for wastewater remediation.
Antibiotics are crucial therapeutic agents in clinical and veterinary medicine for combating infectious diseases [1]. However, their widespread use has led to significant environmental release, necessitating effective wastewater treatment technologies. Current methods for antibiotic removal include ion exchange [2], electrochemical techniques [3], adsorption [4], and photocatalysis [5-10]. Among these, photocatalytic degradation has emerged as a promising, green, and energy-efficient advanced oxidation process (AOP). It utilizes solar energy to generate reactive oxygen species that can mineralize antibiotic residues [11-15]. The core of this technology lies in the development of efficient photocatalytic materials [16]. Research in this field expanded significantly after Fujishima and Honda's 1972 report on photoelectrochemical water splitting using TiO2 [17]. Since then, exploration has broadened to include various materials, from wide-bandgap metal oxides to narrow-bandgap chalcogenides and complex perovskites [18-21].
Recently, layered bismuth-based (LBB) materials, such as SBB, ABB, SABB, and S/ArBB structures, have shown excellent visible-light photocatalytic activity [22-26]. Intriguingly, the phase and type of these bismuth-based materials can be rapidly altered by varying the alkalinity (pH) of the synthesis solution [27]. A prominent strategy to enhance performance is constructing heterojunctions (e.g., Z-scheme [28-32], type-Ⅱ [33], p-n [34]), which improve charge separation efficiency and redox capabilities compared to single-component catalysts [35,36]. An example is our team's construction of an Au/MIL-101(Fe)/BiOBr S-scheme heterojunction for pollutant degradation [37]. However, most heterojunctions are fabricated via physical blending or multi-step processes, which often introduce defects or weak interfacial bonding, compromising charge transfer and practical utility. Therefore, the rational design of heterojunctions with precise interface control, high stability, and effectiveness in complex environments continues to be a critical research challenge.
SrBi4Ti4O15 (SBTO) combines benefits of piezoelectric, perovskite, and layered bismuth-based semiconductors, granting it excellent chemical stability, visible-light response, and photocatalytic potential [38]. However, research on SBTO has mainly focused on piezoelectric ceramics, with its photocatalytic applications remaining relatively unexplored [39]. Bismuth oxychloride (BiOCl, BOC) is a layered ternary oxide valued for its environmental compatibility, chemical stability, cost-effectiveness, and strong oxidation capacity [40-42]. Constructing an SBTO/BOC heterojunction could thus synergize the strengths of both materials. Although adjusting solution pH is known to yield different bismuth-based products, the underlying mechanism is not fully understood [27]. It is plausible that in-situ heterojunction formation could occur under specific pH conditions, yet no studies have reported such a precisely controlled, in-situ pH-regulated synthesis strategy for these heterojunctions.
This study demonstrates the in-situ construction of an SBTO/BOC heterojunction via a one-step hydrothermal method by precisely controlling the NaOH molarity. Under well-regulated alkaline conditions, the Cl atoms within BOC form chemical bonds with Ti atoms in SBTO, resulting in the generation of a tightly integrated SBTO/BOC heterointerface. XRD was systematically employed to monitor the phase evolution, confirming the gradual growth of SBTO on BOC nanosheets. Theoretical calculations, combined with ex situ and in situ XPS as well as in situ Kelvin probe force microscopy (KPFM), provide mechanistic insights into the formation of the heterojunction. Photoelectrochemical analyses reveal that the heterojunction exhibits significantly enhanced charge separation kinetics compared to pure BOC or SBTO. Moreover, the optimized SBTO/BOC heterojunction demonstrates superior performance in tetracycline (TC) degradation, achieving a degradation efficiency of 91.5% under simulated sunlight irradiation-substantially higher than those of the individual components and maintains stability over a wide pH range. This work establishes a novel strategy for designing stable and efficient photocatalysts through pH-mediated interface engineering, which will provide essential guidance for designing advanced materials for treatment of antibiotic wastewater.
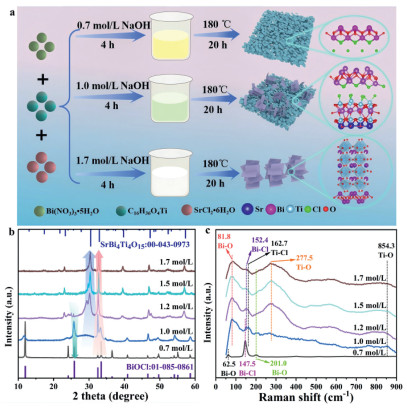
The synthesis processes for the SBTO/BOC composite, as well as pure SBTO and BOC, are illustrated in Fig. 1a. In this study, aggregated BOC nanosheets were successfully achieved through a one-step hydrothermal approach by adding 0.7 mol/L NaOH solution to a final volume of 35 mL. By fine-tuning the concentration of NaOH solution to 1 mol/L, we were able to control the proportion of SBTO nanosheets grown on BOC. And orthogonally stacked SBTO nanosheets were synthesised when the concentration of NaOH solution to 1.7 mol/L. The reasons for the evolution of crystal structure may be as follows: The phase evolution from BOC to SBTO is governed by the OH−-dependent hydrolysis equilibrium of Bi3+. At low NaOH concentration (0.7 mol/L), limited hydrolysis favors cationic bismuth species (e.g., Bi3+, Bi(OH)2+), which rapidly combine with Cl− to form BOC, consuming most bismuth and suppressing SBTO nucleation [40,43]. Conversely, at high NaOH concentration (1.7 mol/L), enhanced hydrolysis generates soluble [Bi(OH)4]−, whose electrostatic repulsion with Cl− inhibits BiOCl formation [39]. Here, Sr2+ acts as a bridge, attracting anionic [Bi(OH)4]− and Ti-complexes to promote SBTO crystallization [37,41]. At an intermediate concentration (1.0 mol/L), BiO+/Bi(OH)3 and [Bi(OH)4]− coexist, enabling concurrent growth of both phases [27]. The intimate contact between forming BOC and SBTO facilitates in-situ Ti–Cl bond formation, creating a coherent heterojunction as confirmed by XPS and HRTEM.
Figure 1
Figure 1.
(a) Schematic representation of the synthesis procedure for BOC, SBTO, and their composite heterojunction (SBTO/BOC). (b) XRD patterns and (c) Raman spectrums of samples synthesized at different concentrations of NaOH solution of 0.7, 1.0, 1.2, 1.5 and 1.7 mol/L, respectively.
As shown in Fig. 1b and Fig. S1 (Supporting information), when the NaOH concentration was set at 0.7 mol/L, the XRD pattern matched well with the standard diffraction peaks of BOC (JCPDS No 01–085–0861). Increasing the NaOH concentration to 1.7 mol/L resulted in a diffraction pattern that closely corresponded to that of SBTO (JCPDS No 00–43–0973). The SBTO/BOC heterojunction was successfully synthesized within the NaOH concentration range from 0.9 mol/L to 1.5 mol/L, where the characteristic diffraction peaks of SBTO gradually intensified. Moreover, XRD patterns collected at different reaction times clearly illustrate the progressive conversion of BOC into SBTO at 1.0 mol/L NaOH (Fig. S2 in Supporting information), confirming the above explanation and directly supporting the in situ growth mechanism of the SBTO/BOC heterojunction.
Raman spectroscopy enables precise identification of functional groups. As shown in Fig. 1c, at 0.7 mol/L OH−, peaks at 62.5 cm−1 and 147.5 cm−1 are assigned to Bi–O bending in (Bi2O2)2+ layers and asymmetric Bi–Cl bending, respectively [43]. With increasing OH− concentration, Bi–Cl peaks near 152.4 cm−1 weaken, while a Bi–O vibration at 81.8 cm−1 emerges in SBTO. Notably, a peak at 162.7 cm−1, attributed to the Ti–Cl bond [44], appears prominently at 1.0 mol/L NaOH, confirming interfacial bond formation under optimal conditions. Raman data also indicate effective Ti–Cl bonding after 20 h (Fig. S3 in Supporting information). Peaks at 277.5 cm−1 and 854.3 cm−1 (A1g) correspond to tilting/bending and symmetric expansion of (TiO6)2− octahedra, respectively [45]. These results, together with IR absorptions at 1045 cm−1 (Bi–Cl) and 1774 cm−1 (Ti–Cl) in Fig. S4 (Supporting information), provide definitive evidence for the successful construction of the SBTO/BOC heterostructure.
SEM and TEM images (Figs. S5 and S6 in Supporting information) show a clear evolution in morphology with increasing NaOH concentration. The elemental compositions ratios (measured by EDS in SEM) analysis (Table S1 in Supporting information) further reveals a gradual decrease in Cl content and a concurrent increase in Sr as OH− concentration rises. A similar trend-declining of Cl and increasing of Sr are observed with prolonged reaction time (Table S2 in Supporting information). N2 adsorption-desorption isotherms (Fig. S7 in Supporting information)) display H3-type hysteresis, with BET surface areas of 40.4, 74.8, and 25.6 m2/g for BOC, SBTO/BOC, and SBTO, respectively (Table S3 in Supporting information). Moreover, the SBTO/BOC heterojunction shows a smaller contact angle (Fig. S8 in Supporting information) than pure BOC or SBTO, indicating improved hydrophilicity beneficial for photocatalytic degradation in aqueous environments [46].
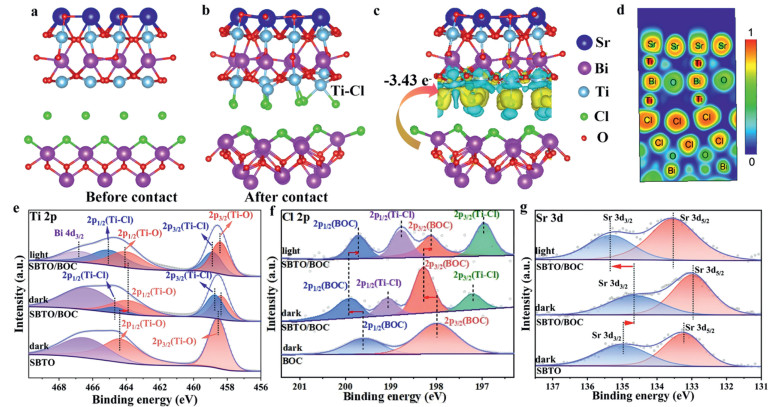
To confirm Ti–Cl bond formation, theoretical modeling was employed to simulate interfacial bonding configurations. As shown in Fig. 2a and b, the BOC (002) and SBTO (010) planes spontaneously form a stable interface via Ti–Cl bonding. The charge density difference (Fig. 2c) reveals electron accumulation (yellow) around Ti and depletion (cyan) near Cl, indicating electron transfer from BOC-Cl to SBTO-Ti and confirming the polar covalent nature of the Ti–Cl bond, essential for establishing an internal electric field (IEF). The electron localization function (ELF, Fig. 2d) further shows greater delocalization around Cl near SBTO, suggesting its role as a "charge transfer bridge." This covalent interaction, enabled by Ti 3d and Cl 3p orbital hybridization, strengthens interfacial coupling and facilitates efficient charge separation and migration. The Ti–Cl bond thus serves as a direct chemical and electronic bridge, accelerating carrier transfer by lowering energy barriers and enhancing orbital overlap between SBTO and BOC.
Figure 2
Figure 2.
Theoretical understanding of the promotion effect of the SBTO/BOC cocatalyst: (a) Visual representation of structures of BOC (002) surface and SBTO (010) surface before contact and (b) SBTO/BOC interface with Ti–Cl bonds are combined together after contact and (c) calculated charge density difference of SBTO/BOC interface. (d) ELF image of SBTO/BOC. Ex situ and in situ XPS profiles of BOC, SBTO/BOC and SBTO: (e) Ti 2p, (f) Cl 2p, (g) Sr 3d.
In situ and ex situ XPS analyses were conducted to elucidate the electron transfer behavior among the samples. Survey spectra (Fig. S9 in Supporting information) confirmed no detectable impurities except minor carbon signals. After accounting for the Bi 4d3/2 signal at 466.6 eV [47], the Ti 2p spectrum of the composite (Fig. 2e) reveals two distinct sets of peaks: Ti–O bonds at 463.9 eV (Ti 2p1/2) and 458.4 eV (Ti 2p3/2), and Ti–Cl bonds at 464.7 eV and 458.7 eV [48]. The Ti–Cl to Ti–O area ratio of ~0.32 provides quantitative evidence for substantial interfacial Ti–Cl bonding. Under dark conditions, Ti–O peaks in SBTO/BOC show a negative shift (~0.1 eV) relative to pure SBTO, suggesting electron accumulation around Ti. Under illumination, these peaks shift positively, indicating electron migration from SBTO to BOC. In the Cl 2p spectrum (Fig. 2f), peaks at 198.5 eV and 196.7 eV correspond to BOC [49], while those at 199.1 eV and 197.2 eV are assigned to Ti–Cl bonds [50]. The Ti–Cl related Cl 2p peaks are positively shifted compared to pure BOC. These opposite binding energy shifts between Cl 2p and Ti 2p strongly indicate electron transfer from BOC to SBTO via the Ti–Cl interface. Consistent trends are observed in the Sr 3d region (Figs. 2g) [51]. Collectively, XPS results reveal that electrons migrate from BOC to SBTO in the dark, while translate from SBTO to BOC under illumination.
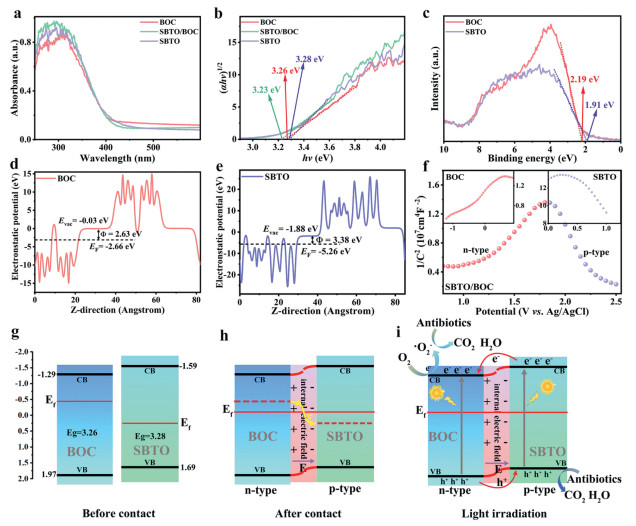
The charge transfer dynamics within the SBTO/BOC heterojunction were investigated through detailed band structure analysis. UV–vis DRS (Figs. 3a and b) yields bandgap energies (Eg) of 3.26 eV for BOC, 3.23 eV for SBTO/BOC, and 3.28 eV for SBTO, respectively. The similar Eg values (Fig. S10 in Supporting information) indicate that bandgap width is not the major contributor to the enhanced photocatalytic performance. XPS measurements (Fig. 3c) place the valence band (VB) maxima at 2.19 eV for BOC and 1.91 eV for SBTO and the VB positions of BOC and SBTO are 1.97 eV and 1.69 eV after correction. Then the corresponding conduction band (CB) potentials of −1.29 eV and −1.59 eV for BOC and SBTO, respectively. The Fermi level (EF) was estimated via DFT-calculated work functions. Electrostatic potential maps (Figs. 3d and e) give Φ(BOC) = 2.63 eV and Φ(SBTO) = 3.38 eV. Consequently, upon contact, electrons spontaneously transfer from BOC to SBTO to align their Fermi levels, consistent with ex situ XPS results. Mott-Schottky plots (Fig. 3f) confirm p-type behavior for SBTO (negative slope) and n-type for BOC (positive slope). Based on these results, the band alignment is schematically illustrated in Figs. 3g-i. The EF of BOC is higher than SBTO before contact, which results in electron transfer from BOC to SBTO, causing upward band bending in BOC and downward bending in SBTO after heterojunction formation (Fig. 3h). Under the conditions of both light and ultrasound (Fig. 3i), the piezoelectric field in SBTO aligns with the IEF, further bending the bands and promoting charge separation. The band bending promotes electrons accumulation in the CB of BOC and holes accumulation in the VB of SBTO, thereby facilitating redox reactions for pollutant degradation.
Figure 3
Figure 3.
(a) UV–vis DRS and (b) band gap plots of BOC, SBTO/BOC and SBTO. (c) VB-XPS spectra of BOC and SBTO. (d, e) Electrostatic potentials of BOC and SBTO. (f) Mott-Schottky curves of SBTO/BOC, BOC (inset), and SBTO (inset). (g-i) Band structure and electron flow mechanism of the SBTO/BOC heterojunction at before contact state, after contact state and light irradiation state, respectively.
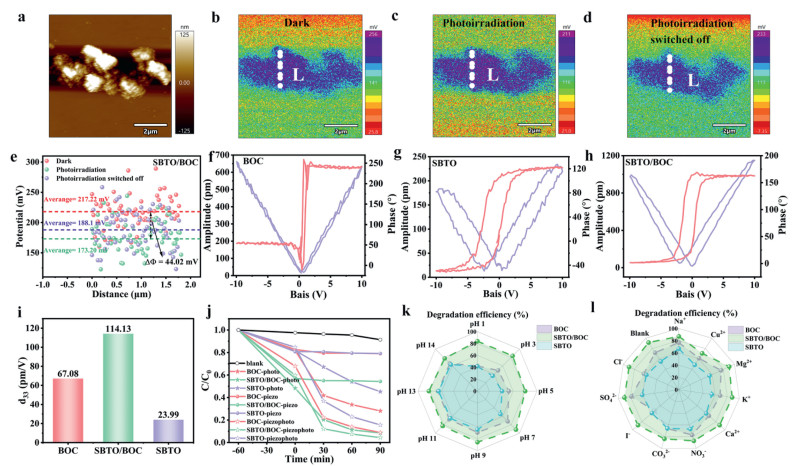
KPFM was employed to probe charge separation dynamics by measuring the contact potential difference (CPD), which reflects the migration and accumulation of photogenerated charges at the material surface [52]. As shown in Fig. S11 (Supporting information) and Fig. 4a-e, the surface potential distributions of the three catalysts were evaluated under dark and illuminated conditions. For SBTO/BOC, the average surface potential decreased from 217.22 mV in the dark to 173.20 mV under light, partially recovering to 188.1 mV after illumination ceased, corresponding to a net CPD change of 44.02 mV. In contrast, BOC and SBTO show markedly smaller CPD variations of 1.107 mV and 0.087 mV, respectively. This pronounced contrast highlights the reinforced surface electric field in the heterojunction, confirming the formation of an IEF [52]. The directional migration of electrons to lower energy states and holes to higher energy states aligns with an IEF-driven charge transfer mechanism. PFM further revealed the piezoelectric properties of the materials. The amplitude-voltage (A-V) hysteresis loops of SBTO/BOC (Fig. 4f-h) exhibit a more distinct "butterfly" shape compared to BOC and SBTO, indicating enhanced piezoelectric response and improved polarization switching. The piezoelectric coefficient (d33) of SBTO/BOC was calculated as 114.13 pm/V, substantially exceeding those of BOC (67.08 pm/V) and SBTO (23.99 pm/V) (Fig. 4i), demonstrating a synergistic enhancement of piezoelectric behavior in the composite [53]. These results underscore the critical role of the IEF in promoting charge carrier dynamics under external stimuli.
Figure 4
Figure 4.
SBTO/BOC of (a) AFM topography image in the dark, (b-d) KPFM images in dark, photoirradiation and irradiation turned off, respectively. (e) Corresponding surface potential distribution along the dotted line (L) in the panel (b-d). (f-h) Phase curves and amplitude voltage curves, (i) Piezoelectric coefficient (d33), (j) Piezo-photocatalytic degradation activity, (k) Satellite map illustrating degradation efficiency under different pH conditions, (l) Different anions and cations for BOC, SBTO/BOC, and SBTO, respectively.
The SBTO/BOC heterojunction exhibits superior charge separation efficiency, as directly evidenced by its significantly quenched photoluminescence (PL) intensity, which is only ~30% of that of pure SBTO or BOC (Fig. S12 in Supporting information). This indicates effective suppression of radiative electron-hole recombination [54,55]. Consistently, the heterojunction demonstrates a substantially higher photocurrent density under illumination (Fig. S13a in Supporting information). Further analysis of the Bode phase plot reveals a remarkable 3.2-fold increase in photoelectron lifetime (0.6098 s for SBTO/BOC) compared to BOC (0.1929 s), facilitating greater participation of photogenerated charges in surface redox reactions (Fig. S13b in Supporting information) [56]. Additionally, the significantly smaller semicircle radius (Fig. S13c in Supporting information) in the Nyquist plot for SBTO/BOC confirms a lower charge transfer resistance at the electrode-electrolyte interface. These collective findings unequivocally demonstrate the enhanced charge separation and transfer kinetics achieved by the heterojunction [29].
As a result, the SBTO/BOC heterojunction showed the highest photocatalytic efficiency (Fig. S14 in Supporting information). Moreover, it demonstrated superior piezo-photocatalytic activity compared to BOC and SBTO, as evidenced in Fig. 4j and Fig. S15a (Supporting information). Under combined conditions of light irradiation and ultrasonic, the TC degradation efficiency reached 92.47%, significantly surpassing the rates achieved by individual ultrasound or light irradiation. A comparative analysis with existing photocatalytic TC degradation studies (Table S4 in Supporting information) confirms that the SBTO/BOC catalyst exhibits markedly higher degradation efficiency per unit mass. The stability of the heterojunction was evaluated over five consecutive degradation cycles, retaining 69% of its initial activity (Fig. S15b in Supporting information), indicating substantial durability. Post-reaction XRD analysis (Fig. S15c) further verified the structural stability of the SBTO/BOC heterojunction.
The practical applicability of the catalysts is evaluated under varied pH conditions and in the presence of common interfering ions. The SBTO/BOC heterojunction demonstrates excellent pH stability (Figs. S15d, S16a, and S16d in Supporting information), and the degradation rate distribution map (Fig. 4k) confirms its superior efficiency across the entire pH range tested. Furthermore, even with competing anions and cations present, SBTO/BOC maintained the highest degradation performance, as shown in the corresponding distribution map (Fig. 4l) and Figs. S15e, f and S16b, c, e, f (Supporting information). These results underscore the outstanding environmental adaptability and structural robustness of the SBTO/BOC catalyst. Then the composite was also tested against other representative pollutants-norfloxacin (NOR, 20 mg/L), cefaclor (CFS, 50 mg/L), and o-phenylphenol (OPP, 20 mg/L). As illustrated in Fig. S17 (Supporting information), SBTO/BOC exhibited high removal efficiencies of 79.6% for NOR, 90.9% for CFS, and 61.3% for OPP, demonstrating its broad-spectrum degradation capability and strong potential for practical wastewater treatment applications.
To elucidate the photocatalytic degradation mechanism of TC, active species trapping experiments were conducted, as illustrated in Figs. S18a-f (Supporting information). The results indicate that the addition of VC, a scavenger for •O2−, significantly inhibited the photocatalytic degradation efficiency of TC across all tested systems. Meanwhile, •OH and h+slightly enhanced the degradation efficiency and the production of •OH has been explained in Supporting information. EPR spectroscopy in Figs. S18g-i (Supporting information) reveals that SBTO/BOC heterojunction displaying significantly stronger signals than BOC and SBTO.
To gain deeper insight into the degradation mechanism of TC, Fukui function analysis was employed to predict its electrophilic, nucleophilic, and radical sites. The molecular structure and atom numbering of TC are shown in Fig. S20a (Supporting information), while the electrostatic potential map (Fig. S20b in Supporting information) indicates that TC is highly susceptible to attack by holes and radicals [54,57]. Calculated Fukui indices (f+, f−, f0) are listed in Table S5 (Supporting information), with corresponding visualizations provided in Figs. S20c-e (Supporting information). Notably, atoms C15, C17, and C7 exhibit nucleophilic character, whereas C15, O19, and C17-with relatively high f0 values-prefer radical reactions. LC-MS analysis identified multiple TC degradation intermediates (Fig. S19 in Supporting information) with m/z values including 445, 415, 437, and others. As illustrated in Fig. S20f (Supporting information), degradation is mainly driven by •O2−, with secondary contributions from •OH and h+. Three primary pathways are proposed: Pathway Ⅰ involves hydroxylation and radical attack, where TC is oxidized to P1 (linked to O32 via Fukui analysis), then transformed into P2 (via C7), followed by ring cleavage to form P3 and P6. Pathway Ⅱ begins with dehydroxylation and methylation under •O2− attack, yielding P7, then proceeds via ring cleavage and amine elimination to form P8-P11 (associated with C15, C16, O19, O30), ultimately mineralizing to CO2 and H2O. Pathway Ⅲ proceeds through dehydroxylation to P13, followed by C-N cleavage and radical-mediated steps viaP15-P18 toward full mineralization. Similar intermediate analyses for NOR, CFS, and OPP are shown in Figs. S21, S23, and S25 (Supporting information), with their degradation primarily driven by •O2− and •OH (Figs. S22, S24, S26 in Supporting information). Toxicity assessment using T.E.S.T. [58] revealed that most intermediates exhibit low developmental toxicity (Fig. S20g in Supporting information), reduced mutagenicity (except P5 and P6, Fig. S20h in Supporting information), low oral acute toxicity (Fig. S20 in Supporting information), and minimal bioaccumulation potential (Fig. S20j in Supporting information). Overall toxicity is significantly reduced compared to TC, indicating lower ecological risk. The toxicity levels are comparable to or lower than those reported in other AOPs [59], confirming the environmental friendliness of the SBTO/BOC system.
This study presents an OH−-regulated strategy for the in situ construction of a SrBi4Ti4O15/BiOCl heterojunction. Interfacial Ti–Cl bonds function as electronic bridges, significantly promoting charge separation. The resulting catalyst achieves 91.5% degradation of tetracycline, exhibits excellent stability and adaptability, and demonstrates high efficiency in synergistic piezo-photocatalysis dominated by •O2−. Furthermore, the toxicity of the degradation intermediates is considerably reduced. This approach offers a promising avenue for the development of efficient and environmentally friendly catalytic systems for antibiotic wastewater remediation.
Declaration of competing interest
The authors declare that they have no known competing financial interests or personal relationships that could have appeared to influence the work reported in this paper.
This work was supported by grants from the Key scientific research projects of colleges and universities in Henan Province (Nos. 24A150032, 25B530003), the National Natural Science Foundation of China (No. 22202090), and the Scientific and Technological Research Project in Henan Province (Nos. 252102230098, 242102230084) the Open Cooperation Foundation of the Department of Chemical Science of Henan University (No. DCSHENU2413).
Supplementary materials
Supplementary material associated with this article can be found, in the online version, at doi:10.1016/j.cclet.2025.112228.
Figure 1
(a) Schematic representation of the synthesis procedure for BOC, SBTO, and their composite heterojunction (SBTO/BOC). (b) XRD patterns and (c) Raman spectrums of samples synthesized at different concentrations of NaOH solution of 0.7, 1.0, 1.2, 1.5 and 1.7 mol/L, respectively.
Figure 2
Theoretical understanding of the promotion effect of the SBTO/BOC cocatalyst: (a) Visual representation of structures of BOC (002) surface and SBTO (010) surface before contact and (b) SBTO/BOC interface with Ti–Cl bonds are combined together after contact and (c) calculated charge density difference of SBTO/BOC interface. (d) ELF image of SBTO/BOC. Ex situ and in situ XPS profiles of BOC, SBTO/BOC and SBTO: (e) Ti 2p, (f) Cl 2p, (g) Sr 3d.
Figure 3
(a) UV–vis DRS and (b) band gap plots of BOC, SBTO/BOC and SBTO. (c) VB-XPS spectra of BOC and SBTO. (d, e) Electrostatic potentials of BOC and SBTO. (f) Mott-Schottky curves of SBTO/BOC, BOC (inset), and SBTO (inset). (g-i) Band structure and electron flow mechanism of the SBTO/BOC heterojunction at before contact state, after contact state and light irradiation state, respectively.
Figure 4
SBTO/BOC of (a) AFM topography image in the dark, (b-d) KPFM images in dark, photoirradiation and irradiation turned off, respectively. (e) Corresponding surface potential distribution along the dotted line (L) in the panel (b-d). (f-h) Phase curves and amplitude voltage curves, (i) Piezoelectric coefficient (d33), (j) Piezo-photocatalytic degradation activity, (k) Satellite map illustrating degradation efficiency under different pH conditions, (l) Different anions and cations for BOC, SBTO/BOC, and SBTO, respectively.

 DownLoad:

 下载:
下载:


 下载:
下载:
