Key Laboratory of Luminescence Analysis and Molecular Sensing, Ministry of Education, School of Materials and Energy, College of Sericulture, Textile and Biomass Sciences, Southwest University, Chongqing 400715, China
b.
Yibin Academy of Southwest University, Yibin 644000, China
c.
State Key Laboratory of Oral & Maxillofacial Reconstruction and Regeneration, Key Laboratory of Oral Biomedicine Ministry of Education, Hubei Key Laboratory of Stomatology, School & Hospital of Stomatology, Frontier Science Center for Immunology and Metabolism, Wuhan University, Wuhan 430079, China
zgxu@swu.edu.cn (Z. Xu). 1 These authors contributed equally to this work.
Received Date:
16 September 2025 Accepted Date:
02 December 2025 Revised Date:
01 December 2025 Available Online:
15 November 2026
Abstract:
Oncolytic virus therapy represents a promising avenue in the battle against cancer, however, its efficacy is frequently constrained by the hostile tumor microenvironment and insufficient therapeutic responses. Herein, we engineered a pH/glutathione dual-responsive supramolecular prodrug nanomedicine (termed PGPP), derived from gossypol, designed to synergize with oncolytic herpes simplex virus (oHSV) therapy for the treatment of triple-negative breast cancer (TNBC). Our findings revealed that PGPP exhibited remarkable tumor-targeting accumulation and retention, significantly enhancing the cytotoxic potency of gossypol within malignant tissues. Crucially, PGPP effectively disrupted vascular endothelial growth factor (VEGF)-driven angiogenesis, fostering a more permissive milieu for oncolytic viral infiltration. The incorporation of oHSV in turn amplified the antitumor activity of PGPP, promoting cancer cell apoptosis and augmenting immunogenic cell death, ultimately resulting in robust tumor growth inhibition. This coordinated combination strategy-based supramolecular prodrug delivers a powerful blow against TNBC, offering a promising paradigm for future cancer treatments.
Globally, breast cancer is one of the most common cancer-related causes of death, accounting for almost one-sixth of all cancer deaths worldwide [1–3]. Among breast cancer subtypes, triple-negative breast cancer (TNBC), defined by the absence of estrogen/ progesterone receptor, and human epidermal growth factor receptor 2 (HER2) expression, accounts for about 12%–17% of breast cancer cases [4–7]. At present, the treatment of TNBC continues to pose significant challenges in the field of global tumor treatment, which brings great pressure to researchers in related fields, and poses a serious threat to life quality of patients [8–10]. Despite a variety of diagnostic techniques and targeted therapeutic strategies have been explored, tested and applied in recent decades [11–13], it is still a challenging task to achieve precision cancer therapy with minimal side effects and optimal efficacy. Fortunately, the emergence of therapeutic viruses and supramolecular nanomedicines offers more possibilities to address these clinical issues [14–18].
Oncolytic virus (OV) therapy is an emerging cancer treatment strategy that is currently on the rise. The first OV talimogene laherparepvec (T-VEC), an intralesional administered drug based on oncolytic herpes simplex virus (oHSV) type 1 (HSV-1), was approved by the US Food and Drug Administration (FDA) for melanoma immunotherapy in 2015 [19,20]. Further, oHSV-based method has exhibited several advantages in the treatment of cancer. First, oHSV is considered to be a potential broad-spectrum anticancer drug and is true to various types of tumors. Second, oHSV is richly modifiable, and can be treated by genetic modification technology to enhance its strengths and avoid its weaknesses. Third, anti-herpes drugs can be used to effectively inactivate viruses infected for non-oncolytic purposes [21–24]. Compared with conventional antitumor therapies, oHSV effectively replicates in tumor cells and induces tumor cell lysis. Despite these advantages, oncolytic virus monotherapy has not achieved satisfactory treatment, the application of oHSV in solid tumors is limited by factors such as the physical barrier of tumors and tumor heterogeneity. The excessively high vascular permeability within tumors and the dense extracellular matrix (ECM) of solid tumors lead to interstitial hypertension, as well as extensive antiviral immune responses, which pose challenges for oHSV to actually reach the tumor site and exert its effects [25]. Therefore, the combined treatment strategy is a better choice for amplifying the tumor treatment of oHSV therapy by enhancing tumor penetration and reducing tumor immunosuppression [26,27].
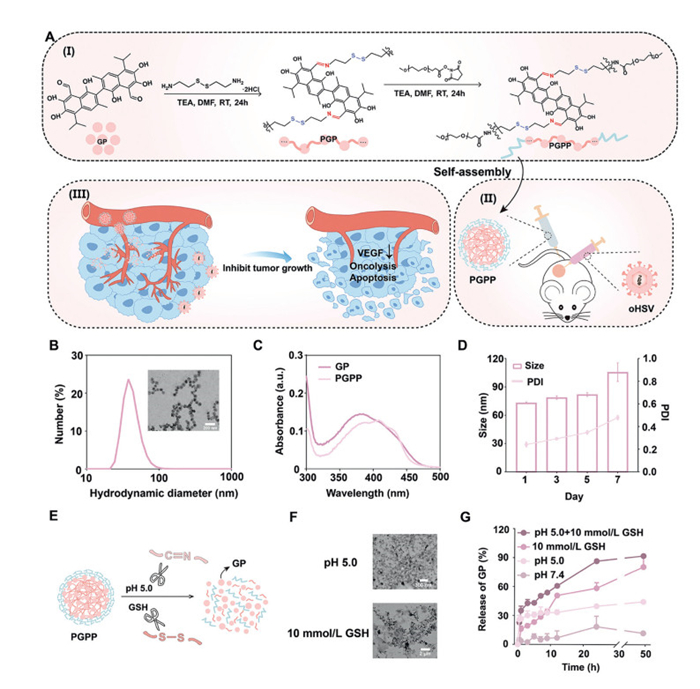
Gossypol, a naturally occurring polyphenol derived from the mallow plant cotton, has shown to be a promising anticancer drug for cancer therapy [28,29]. This is because gossypol has a BH3 domain mimicking structure, which can be served as an effective mediator to make cells apoptosis [30,31]. However, the gossypol's strong toxicity further limits its clinical application, and the reasonable delivery carrier is the optimal method to address this challenge [32,33]. Therefore, based on the characteristics of the acidic tumor microenvironment and high glutathione (GSH) concentration [34], we modified gossypol and incorporated a responsive "dual-lock" system. Through a two-step synthesis, we introduced a pH-sensitive imine bonds (–C═N–) and a GSH-cleavable disulfide bonds (–S–S–) (Fig. 1A, Ⅰ). And then we propose a gossypol-based supramolecular prodrug combined with the created oHSV as a combination therapy for the treatment of TNBC (Fig. 1A, Ⅱ). The design of polyprodrug improves the drug loading and stability of gossypol. The dual-responsive feature of PGPP avoids the false release phenomenon, realizes safe and efficient drug delivery, and offers a potential strategy for addressing the drug resistance of TNBC caused by conventional chemotherapy. After reached to tumor site, the released gossypol from PGPP can inhibit vascular endothelial growth factor (VEGF), and normalizes tumor vasculature, thereby improving the penetration efficiency of oHSV into the tumor. Additionally, the gossypol can play a role in weakening the tumor in advance and destroying the tumor defense mechanism, and create an advantaged term for the function exertion of oHSV. This combination design accelerates tumor cell apoptosis and induces effective immunogenic cell death (ICD) effect, enhancing tumor growth inhibition (Fig. 1A, Ⅲ).
Figure 1
Figure 1.
(A) The synthetic route of PGPP and the mechanism of its combined action with oHSV. (B) DLS data and TEM image for PGPP nanoparticles. Scale bar: 200 nm. (C) UV–vis spectra of gossypol and PGPP. (D) Stability of PGPP in PBS at pH 7.4 evaluated by size and PDI for 7 days. (E) Schematic representation of PGPP decomposition under two-response conditions. (F) Representative image of PGPP through TEM under different conditions. Scale bars: 300 nm and 2 µm. (G) Release curves of PGPP under different responsive conditions. All data are expressed as mean ± SD (n = 3).
During the preparation of PGPP supramolecular prodrug, we first condensed the amino group on cystamine with the aldehyde group on gossypol to form a Schiff base linkage, yielding the intermediate product of PGP. This reaction not only modified gossypol but also introduced a pH-responsive bond. Subsequently, PGP was encapsulated with methoxypolyethylene glycol succinate n-hydroxysuccinimide (MPEG5000NHS) to obtain the final PGPP prodrug, as illustrated in the synthetic route (Fig. 1A, Ⅰ). The successful syntheses of the intermediate and final products were confirmed by nuclear magnetic resonance hydrogen spectroscopy (1H NMR). The characteristic peaks of cystamine's -CH2-protons (2.8–3.0 ppm) and gossypol's -CH3 protons (1.18 ppm) verified the formation of PGP (Fig. S1 in Supporting information). Additionally, the appearance of MPEG-NHS's -CH2- signal (3.50 ppm) confirmed the successful synthesis of PGPP (Fig. S2 in Supporting information). Further characterization by gel permeation chromatography (GPC) revealed that the number-average molecular weight (Mn) and weight-average molecular weight (Mw) of PGPP were 11,338 and 29,889, respectively (Table S1 and Fig. S3 in Supporting information). These results collectively demonstrate that PGPP is a polymeric structure composed of repeating units derived from gossypol (GP) and cystamine.
The amphipathic PGPP polymer could be self-assembled into nanoparticles, the transmission electron microscopy (TEM) image revealed that PGPP formed spherical nanoparticles with an average diameter of 73.58 ± 1.57 nm in phosphate buffered saline (PBS) (Fig. 1B). The ultraviolet–visible (UV–vis) spectroscopy showed a redshift in the absorption peak from 380 nm (free GP) to 407 nm (PGPP), indicating the formation of supramolecular nanoparticles driven by non-covalent interactions (Fig. 1C). And through ultraviolet measurement, the content of GP in PGPP was approximately 19.5%. According to the records of dynamic light scattering (DLS) technology, PGPP exhibited good stability in PBS, maintaining consistent particle size and polydispersity index (PDI) over 7 days without significant drug release (Fig. 1D).
As a dual-stimuli-responsive polymeric prodrug, PGPP incorporates GSH-cleavable disulfide bonds (–S–S–) and pH-sensitive imine bonds (–C═N–) (Fig. 1E). At pH 5.0, the acid-responsive bond cleaves, leading to the partial degradation of PGPP, resulting in rapid GP release, while a small fraction of PGPP remains intact, showing irregularity and agglomeration in the TEM image. In contrast, in 10 mmol/L GSH, disulfide bond cleavage generated residual cystamine fragments that entangled into elongated filamentous structures, increasing the apparent particle size (Fig. 1F and Fig. S4 in Supporting information). These findings confirm PGPP's responsiveness to tumor-acidic pH and elevated GSH levels in cell. The release of GP was further detected by simulating the GSH and pH microenvironment in the tumor (Fig. 1G). At pH 7.4, the release of GP was negligible. At pH 5.0, the release rate was faster in the first hour and then entered a slow-release state. In the presence of 10 mmol/L GSH, the release rate was faster within 48 h, but the amount released at 24 h was not optimal, and the complete release could not be achieved within 48 h. However, PGPP could liberate a large amount of GP within 24 h when being exposed to the pH 5.0 + 10 mmol/L GSH solution, and the release rate was relatively slow from 24 h to 48 h. The final average release reached about 97%, which proved the dual-responsive property of PGPP.
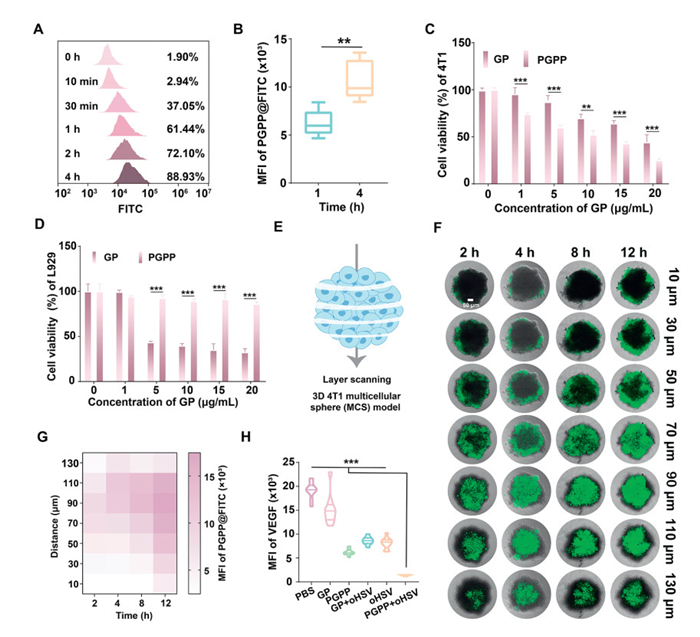
Drug uptake is crucial for both in vitro and in vivo therapy [35]. To enable quantitative tracking of PGPP internalization, we loaded fluorescein isothiocyanate (FITC) molecules into PGPP nanoparticles. Flow cytometry analysis of 4T1 murine breast cancer cells revealed the time-dependent uptake, with 88.93% cellular internalization achieved within 4 h (Fig. 2A), demonstrating rapid endocytic uptake. In addition, the PGPP uptake in 4T1 cells at 1 and 4 h were visualized and quantitatively analyzed by confocal laser scanning microscope (CLSM) images (Fig. 2B and Fig. S5 in Supporting information), indicating that PGPP nanodrugs could be efficiently taken up by 4T1 cells. We further found that incubation of 4T1 cells with PGPP at a concentration of 20 µg/mL with GP resulted in a about 25% cell survival rate and was more toxic than GP alone, indicating that PGPP at a certain concentration had a more potent ability to inhibit 4T1 cells (Fig. 2C). At the same time, we conducted MTT assays to evaluate the cytotoxicity of GP and PGPP on L929 cells (Fig. 2D). The results showed that GP exhibited a gradient toxicity effect, while the toxicity effect of PGPP was not significant, indicating a good biocompatibility.
Figure 2
Figure 2.
(A) Cellular uptake of PGPP at different time points in 4T1 cells, by flow cytometry (FCM). (B) Relative fluorescence intensity analysis of cellular uptake. The MTT results of GP and PGPP in (C) 4T1 and (D) L929 cells. (E) Schematic representation of the 4T1 MCSs on the tomographic scans. (F) Penetration of PGPP in 4T1 MCSs for 2, 4, 8 and 12 h, respectively. Scale bar: 50 µm. (G) Quantification of fluorescence intensity of PGPP@FITC in each layer in 3D MCSs. Results were visualized through a heat map. (H) Relative fluorescence intensity of VEGF. All data are expressed as mean ± SD (n = 3). **P < 0.01, ***P < 0.001.
This is also based on the fact that PGPP show a better cellular uptake, and the 3D multicellular sphere (MCS) model mimicking solid tumor microenvironment (TME) is used to assess the impact of invasive PGPP. When PGPP@FITC being incubated with for 2, 4, 8, or 12 h, all images of 4T1 MCSs and their 3D results were scanned layer-by-layer at preset interval distances (Fig. 2E). With the extension of culture time, the fluorescence intensity of the MCS model increased significantly, and at 12 h, the penetration of PGPP@FITC in 4T1 MCSs showed the strongest fluorescence level. The MCS model also showed deeper fluorescence intensity from the scanning results (Figs. 2F and G). These results fully indicated that PGPP design could promote the drug penetration effect.
Further, previous studies have shown that gossypol can interfere with VEGF-mediated angiogenesis in cancer cells, leading to the reduction of angiogenesis and ultimately promoting apoptosis of cancer cells [36]. Therefore, through VEGF staining images and quantitative analysis, the green fluorescence emitted by PGPP group was significantly weaker, and the expression of VEGF was reduced. The best VEGF inhibition effect was achieved in the PGPP + oHSV treatment group, which also showed the statement that the combination could enhance the effect (Fig. 2H and Fig. S6 in Supporting information).
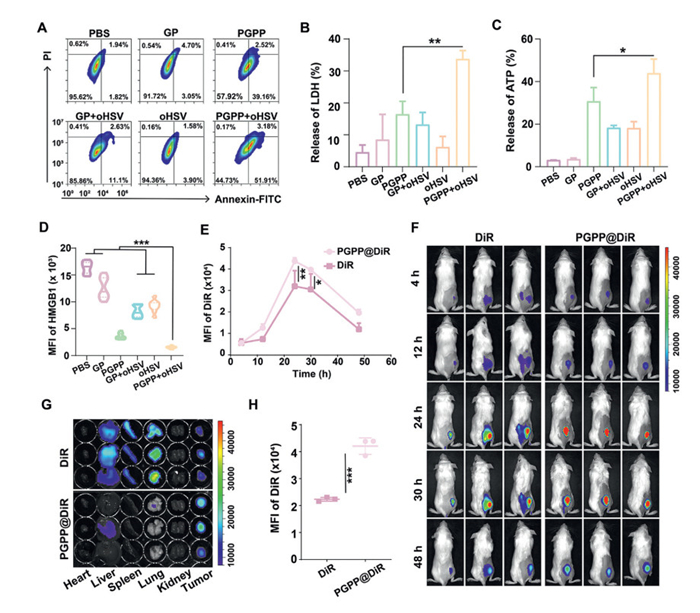
Additionally, we also verified the results of PGPP combined with oHSV on cell apoptosis. Flow cytometry analysis showed that PGPP not only optimized the therapeutic effect of oHSV, but also increased the apoptosis rate over 50% when the two drugs were used in combination (Fig. 3A and Fig. S7 in Supporting information). Apoptotic cells would further amplify the ICD effect and further kill tumor cells [37–39]. At the same time, cancer cells will emit a series of signaling molecules, mainly including the release of high mobility group box 1 (HMGB1), lactate dehydrogenase (LDH) and ATP [40,41]. We found that LDH (Fig. 3B) and ATP (Fig. 3C) released from cells treated with PGPP combined with oHSV were significantly increased, while HMGB1 green fluorescence almost disappeared (Fig. 3D and Fig. S8 in Supporting information), indicating that PGPP combined with oHSV successfully induced apoptosis of 4T1 cells and induced ICD effect to kill cells.
Figure 3
Figure 3.
(A) The apoptosis of 4T1 cells was detected by FCM. (B) LDH and (C) ATP releasing amount with different treatments. (D) Relative fluorescence intensity analysis of HMGB1 in different groups. (E) Fluorescence intensity analysis of PGPP@DiR and free DiR in tumors in 48 h. (F) The representative in vivo NIR imaging of free DiR and PGPP@DiR in 4T1-bearing mice. (G) The fluorescence images of tumor and major organ at 48 h. (H) Quantitative analysis of PGPP@DiR in the slices of 4T1 tumor tissue. All data are expressed as mean ± SD (n = 3). *P < 0.05, **P < 0.01, ***P < 0.001.
After obtaining certain results in cell level verification, we further conducted in vivo experiments in mice model. Specifically, the DiR-labeled PGPP was prepared and used to investigate the drug's bio-distribution and aggregation ability of PGPP nanoparticles in 4T1 tumor-bearing mice by near-infrared (NIR) fluorescence imaging system (IVIS Lumina Series Ⅲ). After PGPP@DiR and free DiR being injected intravenously, the real-time detection of fluorescence were recorded at the specified time point. After PGPP@DiR injection, the drug gradually accumulated in tumor site (Fig. 3E), and the fluorescence intensity reached a peak at 24 h, while free DiR had an obvious weaker signal than that of PGPP@DiR (Fig. 3F). After 48 h, the tumor and main organs were taken to observe the fluorescence distribution. PGPP@DiR fluorescence signal was concentrated in the tumor and significantly stronger than that of free DiR. Meanwhile, weak fluorescence signals were observed in PGPP@DiR of major organs, but strong fluorescence signal could be observed in liver, spleen and lung in the free DiR group (Fig. 3G and Fig. S9 in Supporting information), and the results presented in tumor sections were also consistent with the above results (Fig. 3H and Fig. S10 in Supporting information). These results demonstrated that PGPP had strong in vivo circulation ability and tumor site accumulation and penetration ability.
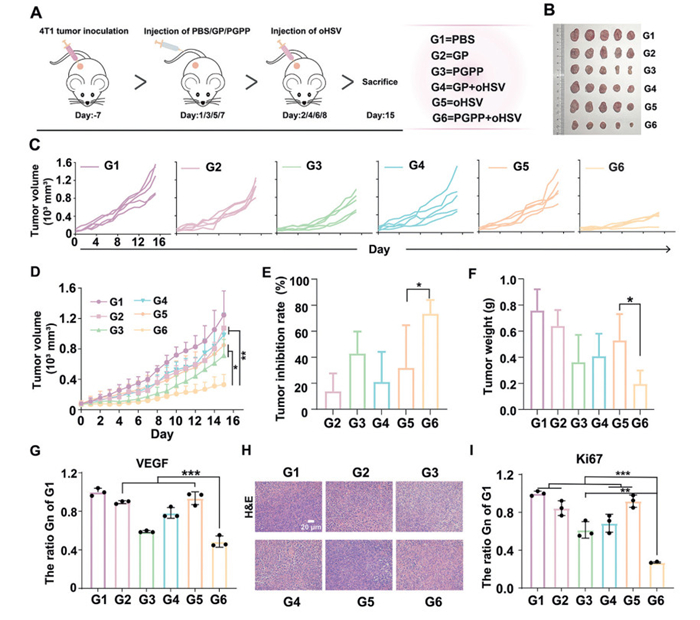
Further, we evaluated the antitumor activity using a 4T1-bearing mouse model. The experimental procedure was shown in Fig. 4A. After a 15-day treatment period, compared with the control group, the tumor volume of the GP, oHSV and GP + oHSV groups were reduced, but the tumor inhibition rates were all < 30%, that showed a weak ability for tumor growth inhibition. Nevertheless, the tumor volume of the PGPP group was reduced by 42.77%, while the group of PGPP + oHSV made the most effective tumor inhibitory effect, the inhibition rate could be reached to about 73.36% (Figs. 4B–E), and the tumor weight was significantly reduced compared with the other groups (Fig. 4F). According to the dissected organs, the spleen mass of PGPP and PGPP + oHSV treated mice decreased, which may be caused by the anti-inflammatory effect of gossypol itself [42]. There were also no significant differences in the weights of the dissected heart, liver, and kidney organs (Fig. S11 in Supporting information), no significant body weight fluctuations among the groups (Fig. S12 in Supporting information), and routine blood tests showed no obvious abnormalities related to blood biochemical parameters (Fig. S13 in Supporting information). Again, there were no histologic abnormalities in major organs (Fig. S14 in Supporting information). The results showed that PGPP + oHSV were biocompatible. All animal experiments were conducted in strict compliance with the laws and institutional guidelines of Southwest University and approved by the Institutional Animal Care and Use Committee (IACUC) of Southwest University (No. IACUC-20250324–03).
Figure 4
Figure 4.In vivo therapy of PGPP. (A) Schematic representation of the treatment process. (B) Images of 4T1 tumors after various treatments on day 15. (C) Individual tumor growth curves of 4T1 tumors in various groups in 15 days. (D) The tumor growth curves of all treatment groups. (E) The tumor inhibition rate of each group compared with G1 group. (F) Tumor weights in different groups of mice on day 15 (n = 5). (G) VEGF expression rate in different groups (Gn) compared to G1 group. (H) H&E staining sections of different therapy groups. Scale bar: 20 µm. (I) Ki67 expression rate in different groups compared to G1 (n = 3). All data are expressed as mean ± SD. *P < 0.05, **P < 0.01, ***P < 0.001.
Immunohistochemical (IHC) analysis of VEGF expression (Fig. 4G and Fig. S15 in Supporting information) further revealed significantly lower VEGF levels in the PGPP and PGPP + oHSV groups compared to other treatment groups, consistent with in vitro findings. Meanwhile, we stained the tumor blood vessels with an anti-CD31 antibody that targets the blood vessel endothelium. We found that the vascular fluorescence signals in the PGPP and PGPP + oHSV groups were the weakest (Fig. S16 in Supporting information). These results confirmed that PGPP had ability to suppress tumor angiogenesis in vivo. We used immunofluorescence staining to detect the release of HMGB1. The PGPP + oHSV group showed the least amount of green fluorescence, which was consistent with the results of the cell experiments. The ICD response was also confirmed in vivo (Fig. S17 in Supporting information). And then tumor proliferation and necrosis were assessed. Hematoxylin and eosin (H&E) staining showed that PGPP + oHSV had the most obvious tumor tissue damage (Fig. 4H). The Ki67 expression level in the tumors of the PGPP + oHSV group was decreased compared with that of the control group (Fig. 4I and Fig. S18 in Supporting information), which proved that the combined effect effectively inhibited tumor proliferation. TdT-mediated dUTP nick end labeling (TUNEL) assay (Fig. S19 in Supporting information) confirmed that the combined treatment had a good anti-tumor effect in vivo. A large number of obvious green fluorescence signals in the tumor could be determined by strong cell apoptosis and DNA fragmentation [43]. These results confirmed that the combination could effectively induce apoptosis and inhibit tumor growth.
In conclusion, we have successfully engineered gossypol, a promising anticancer drug, to form a dual-responsive supramolecular nanodrug PGPP, and proposed a strategy for combining gossypol with oHSV to combat TNBC treatment. The dual reactivity of PGPP provides two tumor-specific safety locks, which enable it to show high stability and safety in the blood circulation, and also good tumor site accumulation. In the weak acidic and high GSH microenvironment, the "safety lock" on PGPP is unlocked and GP drug is rapidly released to all parts into tumor. Then, PGPP can eliminate redundant blood vessels through VEGF inhibition in tumor tissue, and then help oHSV to infect the tumor tissues, thereby improving the therapeutic goal of killing the tumors. This strategy optimizes the utilization of gossypol drugs and pioneers a hopeful approach in combating TNBC by combined therapy.
The authors declare that they have no known competing financial interests or personal relationships that could have appeared to influence the work reported in this paper.
Acknowledgments
This work was financially supported by Sichuan Science and Technology Program (Nos. 2024YFFK0345 and 2025ZNSFSC1036), Chongqing Natural Science Foundation (No. CSTB2023NSCQ-MSX0422), Chongqing Postgraduate Research and Innovation Project (No. CYS23198), the Southwest University Graduate Research Innovation Project (No. SWUS25110), the Open Fund of State Key Laboratory of Advanced Drug Formulations for Overcoming Delivery Barriers (No. 2025-KFB-003) and Chongqing Engineering Research Center for Micro-Nano Biomedical Materials and Devices.
Supplementary materials
Supplementary material associated with this article can be found, in the online version, at doi:10.1016/j.cclet.2025.112206.
[1]
X. Ma, S. Li, Y. Liu, et al., Chem. Soc. Rev. 51 (2022) 5136. doi: 10.1039/d2cs00247g
[2]
L. Chen, C. Dai, L. Wang, et al., Small Struct. 6 (2025) 2500313. doi: 10.1002/sstr.202500313
Figure 1
(A) The synthetic route of PGPP and the mechanism of its combined action with oHSV. (B) DLS data and TEM image for PGPP nanoparticles. Scale bar: 200 nm. (C) UV–vis spectra of gossypol and PGPP. (D) Stability of PGPP in PBS at pH 7.4 evaluated by size and PDI for 7 days. (E) Schematic representation of PGPP decomposition under two-response conditions. (F) Representative image of PGPP through TEM under different conditions. Scale bars: 300 nm and 2 µm. (G) Release curves of PGPP under different responsive conditions. All data are expressed as mean ± SD (n = 3).
Figure 2
(A) Cellular uptake of PGPP at different time points in 4T1 cells, by flow cytometry (FCM). (B) Relative fluorescence intensity analysis of cellular uptake. The MTT results of GP and PGPP in (C) 4T1 and (D) L929 cells. (E) Schematic representation of the 4T1 MCSs on the tomographic scans. (F) Penetration of PGPP in 4T1 MCSs for 2, 4, 8 and 12 h, respectively. Scale bar: 50 µm. (G) Quantification of fluorescence intensity of PGPP@FITC in each layer in 3D MCSs. Results were visualized through a heat map. (H) Relative fluorescence intensity of VEGF. All data are expressed as mean ± SD (n = 3). **P < 0.01, ***P < 0.001.
Figure 3
(A) The apoptosis of 4T1 cells was detected by FCM. (B) LDH and (C) ATP releasing amount with different treatments. (D) Relative fluorescence intensity analysis of HMGB1 in different groups. (E) Fluorescence intensity analysis of PGPP@DiR and free DiR in tumors in 48 h. (F) The representative in vivo NIR imaging of free DiR and PGPP@DiR in 4T1-bearing mice. (G) The fluorescence images of tumor and major organ at 48 h. (H) Quantitative analysis of PGPP@DiR in the slices of 4T1 tumor tissue. All data are expressed as mean ± SD (n = 3). *P < 0.05, **P < 0.01, ***P < 0.001.
Figure 4In vivo therapy of PGPP. (A) Schematic representation of the treatment process. (B) Images of 4T1 tumors after various treatments on day 15. (C) Individual tumor growth curves of 4T1 tumors in various groups in 15 days. (D) The tumor growth curves of all treatment groups. (E) The tumor inhibition rate of each group compared with G1 group. (F) Tumor weights in different groups of mice on day 15 (n = 5). (G) VEGF expression rate in different groups (Gn) compared to G1 group. (H) H&E staining sections of different therapy groups. Scale bar: 20 µm. (I) Ki67 expression rate in different groups compared to G1 (n = 3). All data are expressed as mean ± SD. *P < 0.05, **P < 0.01, ***P < 0.001.


 DownLoad:

 下载:


 下载:

