A novel strategy: In situ real-time monitoring dual-mutant p53 based on sequential activable COX-2 fluorescent probe with high signal-to-background ratio
Citation:
He Yang, Xingkang Wu, Xianghui Lv, Fangjun Huo, Kaiqing Ma, Caixia Yin. A novel strategy: In situ real-time monitoring dual-mutant p53 based on sequential activable COX-2 fluorescent probe with high signal-to-background ratio[J]. Chinese Chemical Letters,
2026, 37(11): 112204.
doi:
10.1016/j.cclet.2025.112204
A novel strategy: In situ real-time monitoring dual-mutant p53 based on sequential activable COX-2 fluorescent probe with high signal-to-background ratio
English
A novel strategy: In situ real-time monitoring dual-mutant p53 based on sequential activable COX-2 fluorescent probe with high signal-to-background ratio
Laboratory of Chemical Biology and Molecular Engineering of Ministry of Education, Key Laboratory of Materials for Energy Conversion and Storage of Shanxi Province, Institute of Molecular Science, Shanxi University, Taiyuan 030006, China
b.
Modern Research Center for Traditional Chinese Medicine, Shanxi University, Taiyuan 030006, China
c.
Research Institute of Applied Chemistry, Shanxi University, Taiyuan 030006, China
Received Date:
03 November 2025 Accepted Date:
28 November 2025 Revised Date:
27 November 2025 Available Online:
15 November 2026
Abstract:
Regarding the biological and clinical significance of in situ real-time detection of p53 dual mutations, this study ingeniously utilized the relationship between the genomic guardian p53 and the tumor promoter cyclooxygenase-2 (COX-2), attempting to develop a COX-2-activated fluorescence probe with cascade response for dual-mutant p53. We developed a novel class of fluorescent probes based on protected dihydroresorufin conjugated with a photo-crosslinking group. This design enables the sequential release of the fluorophore, effectively preventing over-oxidation and allowing for rapid detection of COX-2 activity with enhanced signal-to-background contrast in living cells. Furthermore, these probes can specific recognize dual-mutant p53 based on markedly elevated activity of COX-2 in SW480 cells compared to other colorectal cancer (CRC) cell lines with wild-type or mono-mutant p53 for the first time. This specifically recognition of the dual mutant p53 also enables its implementation in tissues and xenografts. Additionally, metabolomic profiling showed increased acylcarnitine levels in dual-mutant p53 SW480 cells, which could activate COX-2 and enhance prostaglandin E2 (PGE2) production. In situ real-time detection of dual-mutant p53 is of great significance for precise tumor diagnosis and grading, individualized treatment, prognosis judgment and recurrence monitoring, and new drug development.
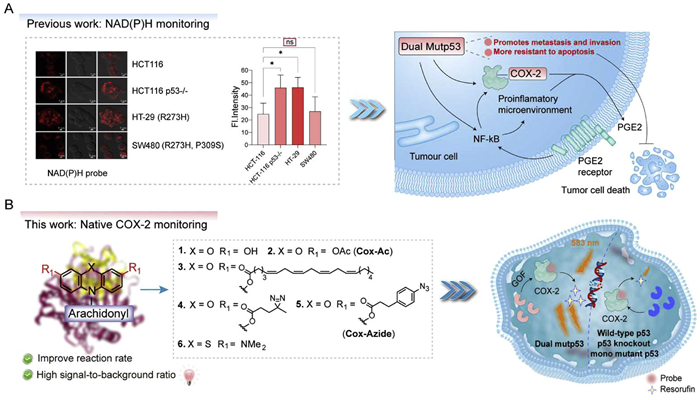
The p53 protein is a well-known tumor suppressor factor, often referred to as the "guardian of the genome". It is activated in response to cellular stress (such as DNA damage, activation of oncogenes, hypoxia) [1,2]. Cyclooxygenase-2 (COX-2) is a key enzyme in the synthesis of prostaglandins (particularly prostaglandin E2 (PGE2)). It is typically highly expressed during inflammation, pain, and fever responses [3]. In various cancers, COX-2 is abnormally highly expressed, promoting the proliferation, survival, angiogenesis, and metastasis of tumor cells [4,5]. In the body, p53 can inhibit COX-2 through transcriptional repression or indirect inhibition [6]. COX-2 leads to a decrease in the stability and loss of function of p53 protein, and even induces p53 mutations [7]. A single mutation of p53 is the first allelic mutation, usually from genetic or somatic mutations, and the individual is healthy. When the second allele is also inactivated (the "second blow"), the tumor suppressive function is completely lost [8,9]. The occurrence of p53 dual mutations marks the complete and irreversible inactivation of the p53 pathway and the acquisition of new oncogenic functions, thereby greatly promoting the malignant progression of tumors [10]. p53 abnormalities have been mainly detected through in vitro methods such as immunohistochemistry (IHC), Sanger sequencing, polymerase chain reaction (PCR), and electrophoresis [11,12]. Developing in situ detection methods for p53 abnormalities facilitates revealing the true behavior of p53 kinetics, analyzing the spatiotemporal relationship between p53 and downstream targets, and studying protein interactions in natural environments. In the absence of in situ real-time detection tools for p53, in our previous research, we achieved real-time monitoring of p53 deletion/single mutation in living cells/living organisms through a fluorescent probe activated by nicotinamide adenine dinucleotide (phosphate)-reduced form (NAD(P)H), but could not specifically identify dual-mutant p53 (Scheme 1A) [13]. In situ real-time detection of dual-mutant p53 is of great significance for precise tumor diagnosis and grading, individualized treatment, prognosis judgment and recurrence monitoring, and new drug development. In response to more difficult challenges, since COX-2 and p53 proteins have a very close interaction, can we use a fluorescence probe for COX-2 to identify dual-mutant p53?
Scheme 1
Scheme 1.
The strategy of probe design and the identification of dual mutant p53 CRC cells based on the activity of COX-2. (A) Monitoring p53 abnormalities through NAD(P)H probe and COX-2 activity (*P < 0.05; ns, not significant). (B) The structure of probes for native COX-2 monitoring and the discrimination of dual-mutant p53 CRC cells from wild-type/mono-mutant p53.
COX-2 is a key enzyme in prostaglandin biosynthesis, exhibiting both cyclooxygenase and peroxidase activities. The cyclooxygenase activity catalyzes the conversion of arachidonic acid to prostaglandin G2 (PGG2), while the peroxidase activity subsequently reduces PGG2 to prostaglandin H2 (PGH2), a precursor for various bioactive prostaglandins, including PGE2 [14–16]. Traditional turn-on probes for COX-2 detection typically integrate COX-2 inhibitors with fluorophores [17–20]. Notably, Peng and colleagues developed probes incorporating indomethacin and acenaphthenequinone fluorophores, enabling differentiation between cancerous, inflamed, and normal tissues in vivo [21,22]. However, these probes inhibit COX-2, potentially disrupting cellular function, and are unable to monitor its catalytic activity, which is critical for its biological role.
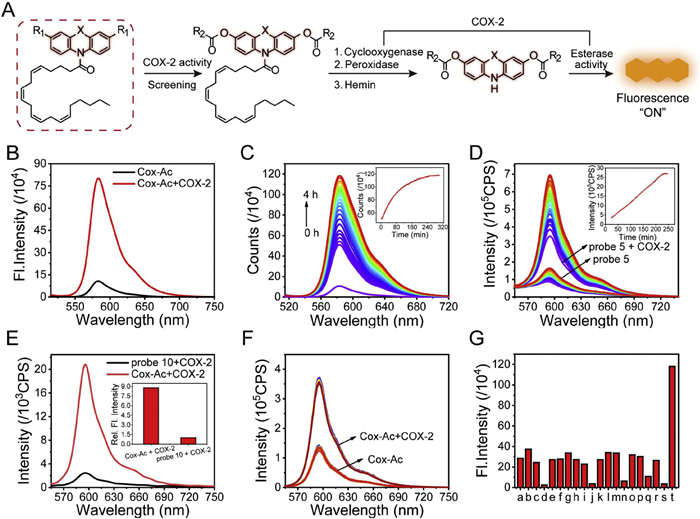
In this study, a novel series of fluorescent probes based on protected dihydroresorufin were developed for the selective detection of COX-2 catalytic activity. This strategy not only reduced the background fluorescence of the probe but also enhanced the signal after the response. Furthermore, aryl azide was assembled to form the covalent bond between the probe and COX-2, which reduced the response time from 4 h to 75 min, enabling rapid imaging of tissue sections. Notably, the probe based on the protected dihydroresorufin was also converted to resorufin by COX-2, which represents the first identification of the esterase activity of COX-2 (Fig. 1A). Additionally, the probe Cox-Ac demonstrated effective cellular uptake and the ability to monitor COX-2 activity in live cells. Remarkably, COX-2 catalytic activity was found to be exceptionally high in SW480, a colorectal cancer (CRC) cell line harbouring dual p53 mutations (R273H and P309S), allowing for the discrimination of SW480 from other CRC cells, as confirmed by cytometric analysis. Moreover, the COX-2 activity-based probe was employed to differentiate SW480 and HT-29 tumor tissues derived from xenograft mouse models. Eventually, complementary metabolomic analysis further revealed elevated levels of various acylcarnitines in SW480 cells, which were shown to activate COX-2 and enhance PGE2 production.
Figure 1
Figure 1.
The chemical structure and the optical test of the probes for COX-2. (A) The strategy to avoid the excessive oxidation for the COX-2-activated-based probe with a high signal-to-background (S/B) ratio. (B) Fluorescence intensity changes of probe 2 in the absence and presence of COX-2. (C) Fluorescence emission spectra changes of probe 2 with COX-2; the inset shows the plots of the kinetic curve. (D) Fluorescence intensity versus illumination time (30 min) changes of probe 5 in the presence and absence of COX-2 after 45 min incubation; the inset shows the plots of the kinetic curve. (E) Comparison of the fluorescence emission spectra of COX-2 response between Cox-Ac and probe 10. (F) Under the illumination of the blue LED, the fluorescence emission spectra of Cox-Ac. (G) Fluorescence intensity at 583 nm for probe 2 in the presence of various enzymes (20 µg/mL) and active oxygen/nitrogen species (1 µmol/L). a. control, b. chymotrypsin, c. lecithin, d. hemoglobin, e. catalase, f. peroxidase from horseradish (HRP), g. lipase, h. pepsin, i. trypsin, j. carboxylesterase, k. NO2−, l. H2O2, m. 1O2, n. ClO−, o. ONOO−, p. OH·, q. TBHP, r. NO, s. COX-1, t. COX-2. All the data were recorded at room temperature with a probe (10 µmol/L), COX-2 at 2 µg/mL, and in a ratio of Tris–HCl: DMSO = 1:1.26 (λex = 500 nm, slit: 5 nm/5 nm).
Probes 1 and 2 were synthesized following routine synthetic procedures (Fig. S1 in Supporting information) [23]. To minimize background fluorescence and enhance reaction efficiency, two additional arachidonic acid moieties were introduced onto the di-phenol core of dihydroresorufin (3), improving its binding affinity toward COX-2 (Scheme 1B). Furthermore, photo-crosslinking groups, such as phenyl azide and diazirine, were incorporated to facilitate covalent bond formation between the probe and COX-2 upon light irradiation, thereby accelerating the reaction rate. Additionally, the ester functionality was designed to undergo hydrolysis, exposing the phenol group, followed by oxidation to fully activate fluorescence. Consequently, probes 4 and 5 were synthesized by coupling probe 1 with different cross-linking groups. To extend the emission wavelength for in vivo applications, probe 6 was developed using methylene blue as the fluorophore. This probe was synthesized through the reduction of 3, 7-bis(dimethylamino) phenoxazin-5-ium, followed by acylation with arachidonyl chloride.
With these probes in hand, we first assessed their response to recombinant human COX-2. Given that the reported concentration of COX-2 in cancer cells is ~2 µg/mL (30 nmol/L), probe 1 was evaluated under these conditions using ultraviolet-visible spectroscopy (UV–vis) absorption and fluorescence spectroscopy. The results revealed no significant signal enhancement at 583 nm, as shown in Fig. S2 (Supporting information), even after a 4-h incubation, likely due to the high background fluorescence and limited photostability of probe 1 (Fig. S2A). Similarly, probe 6, incorporating a methylene blue fluorophore, exhibited a comparable response pattern (Fig. S2B), which may be attributed to its low reaction rate. Initially, COX-2 was believed to possess only cyclooxygenase and peroxidase activities. However, an unexpected discovery was made when probe Cox-Ac (2), featuring diacetate modifications on the phenol, exhibited a significant absorbance enhancement at 568 nm upon incubation with COX-2 (Fig. S2C). Moreover, the corresponding fluorescence intensity at 583 nm increased more than eightfold (Fig. 1B). Compound 8, lacking the arachidonic structure, also induced fluorescence enhancement upon COX-2 treatment (Fig. S2D). These findings demonstrate, for the first time, that COX-2 exhibits esterase activity by catalyzing acetate hydrolysis.
Kinetic analysis of Cox-Ac demonstrated that the reaction reached completion within 4 h, comparable to previously reported probes (Fig. 1C). To enhance the reaction rate toward COX-2, the performance of probes 3, 4, and Cox-Azide (5) was further evaluated. The results indicated that probe 3 did not improve the reaction rate, and probe 4, containing diazirine, also showed no enhancement under blue LED irradiation (405 nm) (Figs. S2E and F). Notably, Cox-Azide with the azide group exhibited a significantly accelerated response to COX-2, reaching a fluorescence intensity plateau within 30 min of blue LED exposure following a 45-min incubation with COX-2 (Fig. 1D), whereas the Cox-Azide alone showed no significant change under the irradiation. Meanwhile, the Km values of Cox-Ac and Cox-Azide were calculated to be 15 and 19 µmol/L, which were similar to the probe reported previously (Fig. S3A in Supporting information). In contrast, COX-2, hemin, or a combination of COX-2 and hemin exhibited no fluorescence intensity under irradiation (Figs. S3A–D in Supporting information). Additionally, to further investigate this activity, the arachidonic moiety was replaced with arachidic acid, yielding probe 10, which remained inactive under identical conditions (Fig. 1E). The Cox-Ac probe alone reached a fluorescence intensity plateau within 4 h in the absence of light and displayed no notable fluorescence increase following 30 min of blue LED irradiation (Fig. 1F). These findings confirm that covalent bond formation between the probe and COX-2 effectively enhances the reaction rate as anticipated. To assess selectivity, Cox-Ac was tested against various enzymes, including COX-1, catalase, lipase, and peroxidase. As shown in Fig. 1G, only COX-2 induced a fluorescence turn-on response. Additionally, Cox-Ac exhibited no undesirable activation when incubated with biologically relevant reactive oxygen species, further demonstrating its high specificity.
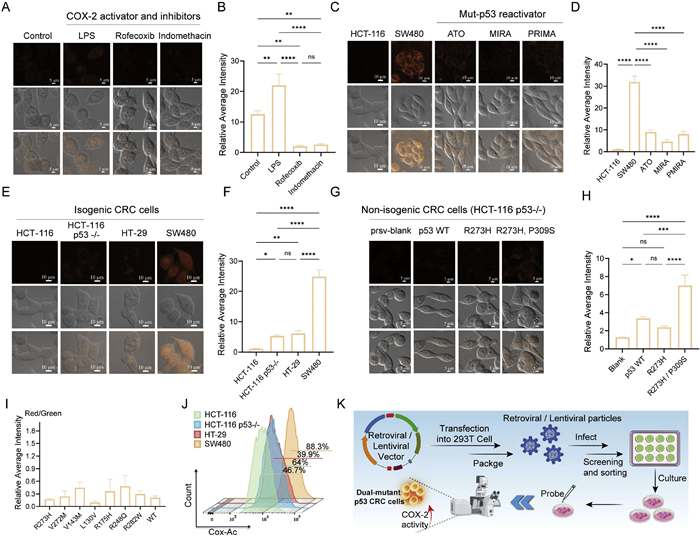
Before performing imaging assays, the cytotoxicity of the probes was evaluated in different CRC cell lines, including HCT-116 p53-/- and SW480, using the sulforhodamine B assay. The results demonstrated that cells treated with varying concentrations of Cox-Ac (0–10 µmol/L) for 12 and 24 h exhibited high viability (Figs. S4A and B in Supporting information), indicating its low cytotoxicity in living cells. The imaging of endogenous COX-2 activity test showed that Cox-Ac successfully penetrated the cell membrane and generated a fluorescence signal upon activation. Pretreatment with buthionine sulfoximine enhanced fluorescence intensity (Fig. S4C in Supporting information). However, BSO treatment may affect normal cellular function, which makes it difficult to monitor the activity of COX-2 in a native cellular context [24,25]. Next, the effect of lipopolysaccharide (LPS) stimulation on COX-2 activity was investigated. Confocal imaging revealed a two-fold increase in fluorescence intensity in LPS stimulated cells compared to untreated controls. Moreover, pretreatment with COX-2 inhibitors such as rofecoxib and indomethacin significantly reduced intracellular fluorescence (Figs. 2A and B). To evaluate the potential of Cox-Ac for tumor-specific imaging based on COX-2 activity [26], in vivo fluorescence imaging was performed (Fig. S5 in Supporting information). The results indicated that the corresponding fluorescence image clearly marked the tumor. All the animal experiments were performed by following the protocols approved by the Radiation Protection Institute of Drug Safety Evaluation Center in China (production license: SYXK (Jin) 2018–0005). BALB/c-nu type mice (6–8 weeks, male) were purchased from SPF (Beijing) Biotechnology Co., Ltd. Experiments were conducted according to the National Institute of Health Guide for the Care and Use of Laboratory Animals.
Figure 2
Figure 2.
Confocal imaging and flow cytometry. (A) HCT-116 p53-/- cells treated with inhibitors and activator of COX-2, then the cells were incubated with the Cox-Ac, followed by imaging. (B) Fluorescence intensity was calculated from the fluorescence imaging (A). (C) Imaging of cells after preincubation with different p53 reactivators at specific concentrations and durations, followed by staining with Cox-Ac. (D) Fluorescence intensity was calculated from the fluorescence imaging (C). (E) The catalytic activity of COX-2 in CRC cells with different types of p53 cells separately incubated with Cox-Ac. (F) Fluorescence intensity was calculated from the fluorescence imaging (E). (G) HCT-116 p53-/- cells with different p53 abnormalities were separately stained with Cox-Ac and imaged. (H) Fluorescence intensity was calculated from the fluorescence imaging (G). (I) Different mono-mutant p53 CRC cells were stained with Cox-Ac. The average fluorescence intensity values (red/green) were calculated from fluorescence imaging. (J) Distinguish SW480 from other CRC cells employing flow cytometry. (K) Cell transfection process and confocal imaging (Cox-Ac: 10 µmol/L, 4 h; excitation wavelength: 561 nm; red channel: 565–625 nm). Data are presented as mean ± standard deviation (SD) (n = 3). *P < 0.05, **P < 0.01, ***P < 0.001, ****P < 0.0001.
Given reports of compounds with the ability to reactivate mutant p53, such as arsenic trioxide (ATO), we sought to determine whether these agents could regulate COX-2 activity in living cells. To this end, we incubated HCT-116 and dual-mutant p53 CRC (SW480) with Cox-Ac. The results indicated that the catalytic activity of COX-2 in SW480 was significantly higher than that in HCT-116 with wild-type p53. Subsequently, SW480 was treated with three mutp53-reactivating compounds, ATO [27], mutp53 reactivation and induction of rapid apoptosis (MIRA) [28], and p53 reactivation and induction of massive apoptosis (PRIMA) [29], followed by treatment with Cox-Ac to assess COX-2 activity. Our findings revealed that all three compounds significantly diminished fluorescence intensity (Figs. 2C and D), indicating that these mutp53-reactivating agents may restore the functionality of dual-mutant p53 protein in SW480 cells.
COX-2 activity was examined in p53-knockout (HCT-116 p53-/-), mono-mutant p53 (HT-29), and dual-mutant p53 (SW480) CRC cells. Surprisingly, the result showed that the fluorescence intensity in SW480 was significantly higher than that in HT-29, HCT-116 p53-/-, and HCT-116 (Figs. 2E and F). Subsequently, a Western blot assay was performed to evaluate the differences in COX-2 protein expression among the CRC cell lines tested above. The results indicated that COX-2 protein levels were not significantly different across these cells (Fig. S6A in Supporting information) [30]. Thus, the results revealed a significant increase in the catalytic activity of COX-2 in SW480 compared with the mono-mutant and knockout p53 cells. These findings suggest a strong association between COX-2 activity and p53 abnormalities, particularly in dual-mutant p53 CRC.
To further investigate the role of dual-mutant p53 in modulating COX-2 activity, we generated novel CRC cell lines derived from HCT116 (p53-/-) cells via lentivirus-mediated overexpression (Fig. 2K) [31]. These included cell lines expressing either p53 WT, p53 R273H or the p53 R273H/P309S mutant, designated HCT116 (p53-/-) p53 WT, HCT116 (p53-/-) p53 R273H, HCT116 (p53-/-) p53 R273H/P309S. The COX-2 activity probe, Cox-Ac, was then applied to these novel CRC cell lines. The results demonstrated that COX-2 activity was significantly upregulated in HCT116 (p53-/-) p53 R273H/P309S cells compared to other cells with p53 abnormality (Figs. 2G and H). To investigate whether COX-2 activity in SW480 cells remains more elevated than in other mono-mutant p53 CRC cell lines, we established stable cell lines expressing clinically relevant mono-mutant p53 variants, including R273H (HT-29), L130V, R175H, R248Q, R282W, etc. [27]. The results demonstrated that none exhibited significantly higher fluorescence compared to HCT-116 p53-/- cells and HT-29 (Fig. 2I and Fig. S6B in Supporting information), suggesting that a single p53 mutation may be insufficient to enhance COX-2 activity. This finding highlights a potential distinguishing characteristic of SW480 cells relative to other mono-mutant p53 CRC models.
To validate Cox-Ac’s ability to detect changes in catalytic activity, we employed flow cytometry, a high-throughput technique capable of analyzing larger cell populations. HCT-116, HCT-116 p53-/-, HT-29, and SW480 cells were treated under the same conditions as previously described. The results revealed a statistically significant increase in the Cox-Ac’s mean fluorescence intensity for SW480 cells compared to HT-29 and HCT-116 p53-/- cells (Fig. 2J and Fig. S6C in Supporting information). These flow cytometry findings corroborate our confocal imaging results, confirming the elevated COX-2 activity in SW480 cells.
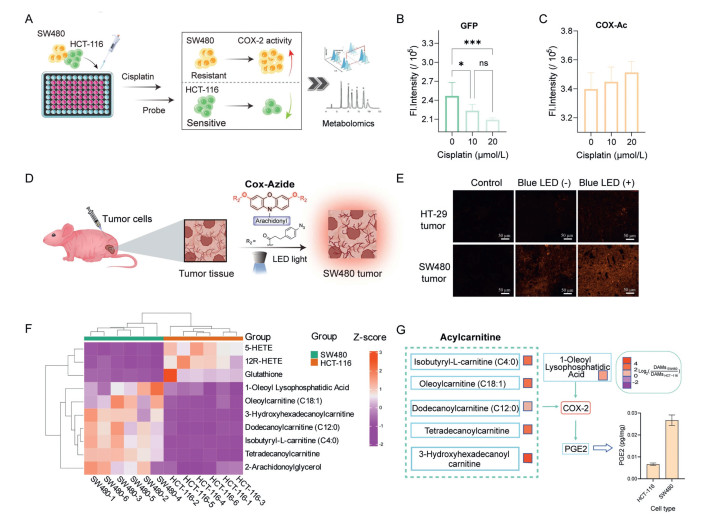
To further explore whether SW480 cells could be selectively identified within a heterogeneous cell population, we examined a mixed culture of SW480 and HCT-116 cells under cisplatin treatment using dual fluorescence channels. HCT-116 cells, which express green fluorescent protein (GFP) and are known to be sensitive to cisplatin, were co-cultured with SW480 cells, which exhibit resistance to the drug (Fig. 3A) [32]. The mixed population was treated with increasing concentrations of cisplatin (0, 10, 20 µmol/L), and fluorescence signals from both the GFP and Cox-Ac channels were recorded (Figs. 3B and C). Upon treatment, a marked decrease in GFP fluorescence was observed, reflecting the reduced viability of HCT-116 cells. In contrast, a slight increase in Cox-Ac fluorescence intensity was detected, indicating an enrichment of SW480 cells relative to HCT-116 cells. These results demonstrate that SW480 cells can be selectively identified within a mixed CRC cell population based on their COX-2 activity, particularly under conditions of chemotherapeutic stress.
Figure 3
Figure 3.
Cell flow cytometry, probes-based imaging of mouse tissues, and metabolic analysis. (A) The HCT-116 and SW480 cell mixtures were treated with different concentrations of cisplatin for 24 h, then Cox-Ac staining was performed for 4 h, and (B) GFP channels (λex = 485 nm, λem = 535 nm) and (C) Cox-Ac channels (λex = 500 nm, λem = 585 nm) were detected by a microplate reader. Mean fluorescence intensity ± SD (n = 6) calculated from fluorescence intensity value. (D) Tumor tissue imaging flowchart. (E) The 10 µm sections of HT-29 and SW480 tumor tissue were incubated with Cox-Azide (10 µmol/L) for 45 min, and fluorescence imaging was performed after 15 min of irradiation with or without blue LED light (405 nm). (F) Heat map and trend of the metabolites in different cell groups (variable importance in projection (VIP) > 1, P < 0.05). (G) The influence of relevant differential metabolites on COX-2 and the concentration of PGE2 in different CRC cells (n = 3) was determined by ELISA. *P < 0.05, ***P < 0.001.
To further evaluate its potential for in vivo differentiation, as shown in Fig. S7 (Supporting information), SW480 and HT-29 cells were transplanted on the left and right flanks of mice, respectively, followed by intravenous administration of Cox-Ac (Fig. S7A). Fluorescence imaging revealed a gradual accumulation of Cox-Ac in the tumor sites. Notably, the fluorescence intensity in the SW480-transplanted tumor was significantly higher than that in the HT-29 tumor (Figs. S7B and C). Tissue and organ imaging further confirmed distinct fluorescence localization, with markedly stronger signals in SW480 tumors (Figs. S7D and E). Other organs showed relatively weak fluorescence, except for the liver, which was likely due to the metabolism of Cox-Ac in the liver. Motivated by these findings, we evaluated the capability of a COX-2 activity-based probe to differentiate SW480 and HT-29 tumor tissues derived from xenograft mouse models. Tumor-bearing nude mice were established via subcutaneous injection of SW480 and HT-29 cells, respectively. Following sacrifice, tumor tissues were excised and treated with Cox-Azide for imaging, with or without blue LED irradiation. As depicted in Figs. 3D and E, SW480 tissue exhibited markedly stronger fluorescence intensity than HT-29 tissue after 45 min. Blue LED irradiation further amplified this fluorescence, enabling clear discrimination between SW480 and HT-29 tumor tissues.
In the present study, the catalytic activity of COX-2 was found to be significantly higher in SW480 cells compared to HCT-116 cells. However, the underlying mechanism driving this increased activity remains unclear. To further explore this phenomenon, a cell metabolomics analysis was conducted (Figs. S8A and B in Supporting information). The OPLS-DA score plot showed a clear separation between the SW480 and HCT-116 groups, indicating significant metabolic differences between the dual-mutant p53 and wild-type p53 CRC. The volcano plot revealed a distinct distribution of metabolites between the SW480 and HCT-116 groups. Using the thresholds of |log2(FC)| > 1 and P < 0.05, a total of 385 differential metabolites were identified, with 230 upregulated and 155 downregulated. The resulting metabolite profiles were used to construct heatmaps, effectively highlighting the metabolic differences between the HCT-116 and SW480 groups (Fig. 3F). Notably, various acylcarnitines, including acylcarnitine (C18:1), were identified among the differential metabolites and exhibited a marked increase in the SW480 group. These metabolites have previously been reported to activate COX-2 activity [33,34]. In addition, lysophosphatidic acid, another known activator of COX-2 [35], was also detected. Moreover, levels of PGE2, a major product of COX-2, were demonstrated to be significantly elevated in SW480 cells compared with other CRC cells employing the enzyme-linked immunosorbent assay (ELISA) method (Fig. 3G and Fig. S8C in Supporting information), further supporting the observation of enhanced COX-2 activity in this cell line.
In summary, we introduce a series of sequentially activatable, activity-based probes designed to monitor COX-2 catalytic activity. The protection of dihydroresorufin enhances the signal-to-background ratio, enabling the novel identification of COX-2′s esterase activity. Notably, the incorporation of the phenylazide group reduced the response time from 4 h to 75 min, providing a novel strategy for rapid monitoring of enzyme activity. Furthermore, the application of these probes revealed exceptionally high COX-2 catalytic activity in SW480 cells, a colorectal cancer line with dual p53 mutations (R273H and P309S), facilitating differentiation from CRC cells with wild-type or mono-mutant p53 via confocal imaging and flow cytometry. Additionally, intravenous administration of Cox-Ac demonstrated its accumulation in tumor regions, effectively distinguishing dual p53 mutant SW480 tumors from wild-type and mono-mutant p53 tumors in vivo. Cox-Azide was also employed to differentiate SW480, and HT-29 tumor tissues derived from xenograft mouse models in 45 min. In a subsequent metabolomics study, various acylcarnitines were found to be significantly higher in SW480, which could activate COX-2 to produce high levels of PGE2. This approach provides a promising framework for precisely detecting p53 abnormalities in vitro and in vivo, offering potential for personalized therapeutic strategies.
The authors declare that they have no known competing financial interests or personal relationships that could have appeared to influence the work reported in this paper.
Acknowledgments
We are grateful to Min Lu from Shanghai Jiao Tong University School of Medicine for providing the p53 mutant plasmid. We thank the National Natural Science Foundation of China (Nos. 22477073, 22074084, 22325703, 22377071, U24A20321), Research Project Supported by Shanxi Scholarship Council of China (Nos. 2022-002, 2023-012), Fundamental Research Program of Shanxi Province (Nos. 202203021221009, 202403021211027), Shanxi Province science and technology activities for overseas people selected funding project (No. 2024001).
Supplementary materials
Supplementary material associated with this article can be found, in the online version, at doi:10.1016/j.cclet.2025.112204.
Scheme 1
The strategy of probe design and the identification of dual mutant p53 CRC cells based on the activity of COX-2. (A) Monitoring p53 abnormalities through NAD(P)H probe and COX-2 activity (*P < 0.05; ns, not significant). (B) The structure of probes for native COX-2 monitoring and the discrimination of dual-mutant p53 CRC cells from wild-type/mono-mutant p53.
Figure 1
The chemical structure and the optical test of the probes for COX-2. (A) The strategy to avoid the excessive oxidation for the COX-2-activated-based probe with a high signal-to-background (S/B) ratio. (B) Fluorescence intensity changes of probe 2 in the absence and presence of COX-2. (C) Fluorescence emission spectra changes of probe 2 with COX-2; the inset shows the plots of the kinetic curve. (D) Fluorescence intensity versus illumination time (30 min) changes of probe 5 in the presence and absence of COX-2 after 45 min incubation; the inset shows the plots of the kinetic curve. (E) Comparison of the fluorescence emission spectra of COX-2 response between Cox-Ac and probe 10. (F) Under the illumination of the blue LED, the fluorescence emission spectra of Cox-Ac. (G) Fluorescence intensity at 583 nm for probe 2 in the presence of various enzymes (20 µg/mL) and active oxygen/nitrogen species (1 µmol/L). a. control, b. chymotrypsin, c. lecithin, d. hemoglobin, e. catalase, f. peroxidase from horseradish (HRP), g. lipase, h. pepsin, i. trypsin, j. carboxylesterase, k. NO2−, l. H2O2, m. 1O2, n. ClO−, o. ONOO−, p. OH·, q. TBHP, r. NO, s. COX-1, t. COX-2. All the data were recorded at room temperature with a probe (10 µmol/L), COX-2 at 2 µg/mL, and in a ratio of Tris–HCl: DMSO = 1:1.26 (λex = 500 nm, slit: 5 nm/5 nm).
Figure 2
Confocal imaging and flow cytometry. (A) HCT-116 p53-/- cells treated with inhibitors and activator of COX-2, then the cells were incubated with the Cox-Ac, followed by imaging. (B) Fluorescence intensity was calculated from the fluorescence imaging (A). (C) Imaging of cells after preincubation with different p53 reactivators at specific concentrations and durations, followed by staining with Cox-Ac. (D) Fluorescence intensity was calculated from the fluorescence imaging (C). (E) The catalytic activity of COX-2 in CRC cells with different types of p53 cells separately incubated with Cox-Ac. (F) Fluorescence intensity was calculated from the fluorescence imaging (E). (G) HCT-116 p53-/- cells with different p53 abnormalities were separately stained with Cox-Ac and imaged. (H) Fluorescence intensity was calculated from the fluorescence imaging (G). (I) Different mono-mutant p53 CRC cells were stained with Cox-Ac. The average fluorescence intensity values (red/green) were calculated from fluorescence imaging. (J) Distinguish SW480 from other CRC cells employing flow cytometry. (K) Cell transfection process and confocal imaging (Cox-Ac: 10 µmol/L, 4 h; excitation wavelength: 561 nm; red channel: 565–625 nm). Data are presented as mean ± standard deviation (SD) (n = 3). *P < 0.05, **P < 0.01, ***P < 0.001, ****P < 0.0001.
Figure 3
Cell flow cytometry, probes-based imaging of mouse tissues, and metabolic analysis. (A) The HCT-116 and SW480 cell mixtures were treated with different concentrations of cisplatin for 24 h, then Cox-Ac staining was performed for 4 h, and (B) GFP channels (λex = 485 nm, λem = 535 nm) and (C) Cox-Ac channels (λex = 500 nm, λem = 585 nm) were detected by a microplate reader. Mean fluorescence intensity ± SD (n = 6) calculated from fluorescence intensity value. (D) Tumor tissue imaging flowchart. (E) The 10 µm sections of HT-29 and SW480 tumor tissue were incubated with Cox-Azide (10 µmol/L) for 45 min, and fluorescence imaging was performed after 15 min of irradiation with or without blue LED light (405 nm). (F) Heat map and trend of the metabolites in different cell groups (variable importance in projection (VIP) > 1, P < 0.05). (G) The influence of relevant differential metabolites on COX-2 and the concentration of PGE2 in different CRC cells (n = 3) was determined by ELISA. *P < 0.05, ***P < 0.001.


 DownLoad:

 下载:


 下载:

