College of Environmental Science and Engineering, State Key Laboratory of Water Pollution Control and Green Resource Recycling, Tongji University, Shanghai 200092, China
b.
Shanghai Institute of Pollution Control and Ecological Security, Shanghai 200092, China
Received Date:
23 May 2025 Accepted Date:
26 November 2025 Revised Date:
03 November 2025 Available Online:
15 July 2026
Abstract:
Micro/nanoplastics (MNPs) have emerged as a global environmental concern, which leads to an urgent need for sensitive and specific MNPs detection technologies. Fluorescence-based methods with high sensitivity and dynamic tracking capabilities have become a significant and promising tool in MNPs analysis. This review systematically summarizes recent developments in fluorescent probes including traditional organic dyes, nanomaterials, aggregation-induced emission (AIE) molecules, binding peptides, and aptamers, for MNPs detection. The fluorescence sensing technology coupled with micro-imaging developed for in situ detection and dynamic tracking is also discussed. The current challenges for MNPs detection including matrix interference and lack of quantification standards are discussed and perspectives including developing multifunctional probes and AI-assisted platforms are proposed. This review provides theoretical reference and innovative ideas for developing new fluorescence probes and methods for MNPs detection and monitoring.
The extensive use of plastics in various fields has led to a large amount of plastic waste entering the environment. > 350 million tons of plastics are produced globally each year, and a significant portion of them are eventually decomposed into microplastics (MPs, particle size of 1 μm to 5 mm) and nanoplastics (NPs, particle size of 1 nm to 1 μm) by aging and crushing of large pieces of plastic [1-7]. These MNPs are widely detected in water, soil and atmosphere, and are even found in remote areas such as deep sea and polar regions [8-14]. MNPs can also be transmitted through the food chain, posing potential threats to ecosystems and human health [15-17]. We summarize typical MNPs and their characteristics in Table S1 (Supporting Information). Therefore, accurate detection of MNPs is essential for assessing their environmental and health risks.
Currently, the main analytical techniques for MNPs include instrumental techniques based on optical microscopy, spectroscopy, and mass spectrometry. Optical microscope observation can directly collect the morphology of MPs, but it is difficult to distinguish NPs due to the resolution limitation. Spectroscopic analysis methods, such as Fourier transform infrared spectroscopy (FTIR) [18-20] and Raman spectroscopy [21-23], can obtain the chemical composition of plastics, but the quantitative detection of MNPs is ineffective especially in low concentrations [24,25]. Mass spectrometry methods, such as pyrolysis gas chromatography-mass spectrometry (Py-GC-MS) [26-30] and matrix-assisted laser desorption ionization time of flight mass spectrometry (MALDI-TOF MS) [31] offer high sensitivity and resolution, but have some drawbacks including complex sample pretreatment, high cost equipment, and difficulty in-situ monitoring due to destructive analysis process. Therefore, the comprehensive MNPs detection with detailed information of their composition, concentration, and morphology is still challenging, and the development of highly sensitive and accurate MNPs tracer methods is highly needed [32].
The fluorescence detection technology with the advantages of high sensitivity, high selectivity, real-time detection and spatio-temporal distribution feature stands out among the detection methods of MNPs [33,34]. The fluorescence detection method not only achieves highly sensitive MNPs detection, but also allows the identification of different types of MNPs by selecting specific fluorescent markers [35-37]. Moreover, based on the visible fluorescence image, it helps to observe the distribution and migration behavior of MNPs in different environmental media and allows for in-situ study of the process of uptake, digestion and excretion of MNPs by organisms, which enables the assessment of the status of MNPs in real environment and the biotoxicity of MNPs in organisms [17,38-42].
Some MNPs, such as those composed of polyethylene terephthalate (PET), polystyrene (PS), and poly(butylene adipate-co-terephthalate) (PBAT), can exhibit measurable fluorescence, primarily originating from the aggregation of conjugated groups, additives, impurities, or photo-oxidation products. This fluorescence property can be leveraged as a detection method for these specific MNPs [43-45]. Liu et al. studied the degradation of PBAT by monitoring the inherent blue-green fluorescence of PBAT. It was found that the fluorescence blue-shifted along the PBAT degradation process, and the fluorescence intensity was exponentially related to the concentration of degradation products [46]. However, the above method is only suitable for the MNPs with auto-fluorescence. Therefore, it is necessary to develop high-performance and specific fluorescent probes that are suitable for common MNPs without auto-fluorescence in various scenarios.
During the MNPs detection, the fluorescent probe is labeled on the MNP surface either by passive adsorption, swelling doping or covalent coupling [47,48]. Surface modification of the probe allows the binding of the receptor on MNPs through specific chemical groups or physical features (e.g., size or curvature of the MNP) [49]. After binding, the conformational change or energy transfer process will trigger the measurable shift of fluorescence signal for MNPs detection [50,51]. Fluorescent probe has the advantages of amplified signal, high sensitivity, non-destructiveness, and no need for extensive pretreatment [52,53]. Different types of MNPs can be in-situ identified and determined with specific probes, while preserving the integrity of the sample. Besides, by coupling with micro-imaging system, e.g., confocal scanning (confocal fluorescence microscopy (CFM) and confocal laser scanning microscopy (CLSM)), and stimulated emission depletion (STED) ultra-high resolution laser confocal microscopy, fluorescence imaging technique shows promising performance with relatively high spatial resolution in MNPs analysis [54,55].
In this review, we summarize recent advances of fluorescent probes for MNPs detection and discuss their applications in environmental sample analysis. The main challenges and research directions for MNPs detection are proposed. This review will provide new insights into the development of advanced analytical techniques for MNPs detection and monitoring.
2.
Fluorescent probes for MNPs detection
2.1
Fluorescent staining dyes
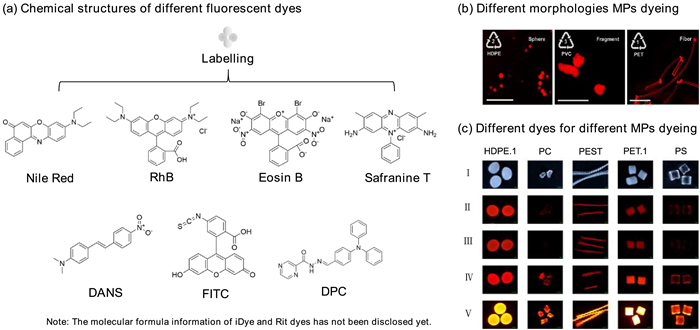
Fluorescent detection of MNPs requires the acquisition of distinct fluorescence signals. Due to the inherent weak intrinsic fluorescence and the limited sensitivity and anti-interference capability of MNPs, it is essential to select suitable fluorescent dyes that can specifically stain the MNPs. As shown in Fig. 1a, the common fluorescent dye probes and their corresponding chemical structures are presented [56]. Various fluorescent dyes exhibit distinct properties, for instance, hydrophobic dyes like Nile red and 4-dimethylamino-4′-nitrostilbene (DANS), are commonly used to stain MNPs. Additionally, other dyes such as Rhodamine B (RhB), Eosin B, Safranine T, Fluorescein Isothiocyanate (FITC), iDye, Rit, and (E)-N’-(4-(diphenylamino)benzylidene)pyrazine-2-carbohydrazide (DPC) dyes are also widely applied in MNPs detection. Below, we will discuss several commonly used fluorescent dyes and their applications in MNPs detection.
Figure 1
Figure 1.
Common fluorescent dyes for MNPs detection. (a) Chemical structures of different fluorescent dyes [56]. (b) Different morphologies MPs dyeing: Spheres (10−90 μm), fragments (50−300 μm), and fibers (30−60 μm/150−5000 μm) dyed with iDye pink. Copied with permission [54]. Copyright 2019, American Chemical Society. (c) Different dyes for different MPs dyeing: (Ⅰ) original color of polymers, (Ⅱ) polymers stained by 55 mg/mL Rit pink dye, (Ⅲ) polymers stained by 5 mg/mL iDye pink dye, (Ⅳ) polymers stained by 2 µg/mL methanol-based Nile Red, and (Ⅴ) polymers stained by 2 µg/mL water-based Nile Red at 70 ℃ for 3 h. Scale bar denotes 1 m. HDPE: high-density polyethylene, PC: polycarbonate, PEST: Polyester. Copied with permission [55]. Copyright 2022, MDPI.
Nile red, a hydrophobic, color-changing, and photo-chemically stable organic dye, has been extensively employed in MNPs detection due to its surface hydrophobic interactions and pronounced solvatochromic behavior [36]. Nile red is highly effective for staining a wide range of plastics polymers such as polyethylene (PE), polypropylene (PP), poly(vinyl chloride) (PVC), poly(vinyl alcohol) (PVA), PET, PS, polyamide (PA), polyurethane (PU). It is non-toxic to human cells at concentrations that produce detectable fluorescent signals, and the staining procedure is relatively simple and suitable for large-scale sample analysis [57]. In the detection of MPs in marine sediments, Nile Red staining allows MPs to be visualized using fluorescence microscopy, enabling effective differentiation from numerous interfering particles, such as sand grains [58]. Besides, the fluorescence intensity varies with the degree of surface oxidation, which can be used to differentiate MPs with different levels of oxidation [57].
However, Nile red still has some limitations in staining hydrophilic MNPs. It is ineffective for staining certain hydrophilic polymers, such as polycarbonate [58,59], as well as specific biological materials like chitin and lignin [20]. There are also difficulties in staining plastic fibers, may interfere with staining results and lead to misinterpretation [60]. Some MNPs are prone to agglomeration in water due to hydrophobicity, forming large particles, which leads to Nile red only marking the outer layer of the agglomeration and underestimation of the true concentration. In addition, the fluorescence intensity of Nile red is significantly diminished, or even completely quenched on NaCl matrix or organic matter-rich water samples [61,62]. and it is easy to be leached out in aquatic environments, which will affect the accuracy of the detection results.
Like Nile red, DANS is a hydrophobic dye. However, it has the advantage of distinguishing MNPs based on the type of MNPs that show a distinct fluorescence color change. Sancataldo et al. selected PP, PE, PS and PET as model MNPs. After incubating these particles in an aqueous solution at 60 ℃ for 1 h, DANS was efficiently adsorbed onto the surfaces of the MPs. Compared to Nile Red, the intramolecular charge transfer (ICT) characteristics of DANS result in a significant red shift in its fluorescence emission spectrum with changes in environmental polarity, along with an extended Stokes shift range [63].
RhB is a dye with high fluorescence emission and good fluorescence stability, which maintains stable fluorescence properties in different environments including water, acidic, and alkaline solutions. In MNPs detection, RhB exhibits high sensitivity toward polymers such as PE, PP, PU, PVC, but it is not satisfactory for PS [64]. However, RhB has its drawbacks with high toxicity, which makes it unsuitable for dyeing in long term exposure environments, and toxicity to aquatic organisms at low concentrations [65], due to non-specific staining and impaired cellular integrity at high concentrations [66]. In addition, dyed MNPs fade in ethanol, limiting the choice of solvent [64]. Skjolding et al. evaluated the toxicity of RhB and Rhodamine WT in algae, daphnia and zebrafish embryos through standardized tests, and found that RhB was significantly more toxic than Rhodamine WT [65]. Ye et al. proposed a supramolecular labeling strategy that employs luminescent metal-phenolic networks composed of zirconium ions, tannic acid, and RhB, to efficiently label MNPs of various sizes on an analytical platform that integrates the benefits of quantitative imaging, customized data processing, decision tree modelling, and low-cost analyses ($0.015 per assay) [67].
Eosin B, commonly used for tissue staining, has also found applications in MNPs detection. Chouchene et al. used Eosin B to detect sediment contamination, demonstrating its superior detection efficacy for PE and PP particles (< 0.1 mm) in sediment matrices [68]. Safranine T, an aromatic cationic dye, also exhibits strong fluorescence signals when bound to PE, PS, PET, and PVC. Nevertheless, both dyes exhibit toxicity to biological systems and have not yet been validated in environmental field studies [37,48,69].
FITC, a widely used fluorescent dye in biological and medical applications such as immunofluorescence staining and flow cytometry, was employed by Wang et al. to label polylactic acid (PLA) MPs [70]. Their study investigated the degradation and nanoparticle formation of FITC-labelled PLA MPs in the gastrointestinal tract. These MPs exhibited high signal intensities under fluorescence microscopy, indicating that they could effectively enter cells and distribute in vivo.
Textile dyes such as iDye dyes [55,71] and Rit dyes are commonly used in MNPs detection. Villacorta et al [66] found that iDye PolyPink performs optimally in a variety of assays, offering good stability and compatibility with other fluorescent compounds, making it suitable for a range of cell and tissue assays. As shown in Fig. 1b, different morphologies MPs dyeing with iDye pink [54]. Rit dyes usually include Rit dye pink and Rit dye blue, which are inexpensive and suitable for large-scale sample screening. It can be done in a conventional laboratory without complex equipment. Fig. 1c compares the staining efficacy of Rit pink, iDye pink, and Nile Red dyes [54,55].
Synthetic dyes also play a significant role in the fluorescence detection of MNPs. Nam et al. found that DPC effectively detected eight different types of MNPs (including PE, PET, PU, PVC, PS, PP) through blue fluorescence, with PU being specifically identified by green fluorescence [72]. The ethanol treatment reduced the false positive detection of non-plastic substances and improved the accuracy of the assay. Additionally, the low synthesis cost of DPC, which is 1/22 the price of Nile red, makes it a more cost-effective alternative.
The conventional fluorescent dyes described above exhibit several critical limitations in the detection of MNPs: (1) Low sensitivity hinder the detection of nanoscale particles (< 100 nm) and low-concentration samples; (2) poor specificity leads to false positives from non-target hydrophobic substances and material-dependent adsorption efficiency, some natural particles such as lignin and chitin may be mis-stained and need to be combined with morphological analysis to rule out false positives; (3) non-linear relationships between fluorescence intensity and particle size, coupled with limited dynamic range, compromise quantitative accuracy; (4) operational complexity arises from multi-step staining, filtration, and pre-concentration; (5) photobleaching under prolonged illumination causes signal degradation; (6) solvent dependency may alter sample integrity; (7) dye residues pose an environmental and health threat. While these dyes are cost-effective and convenient, they often require supplementary techniques to ensure reliability, otherwise they may lead to false-positive results. Future advancements should focus on developing stable, high-specificity probes and automated systems to support environmental monitoring [73].
2.2
Nanoprobes
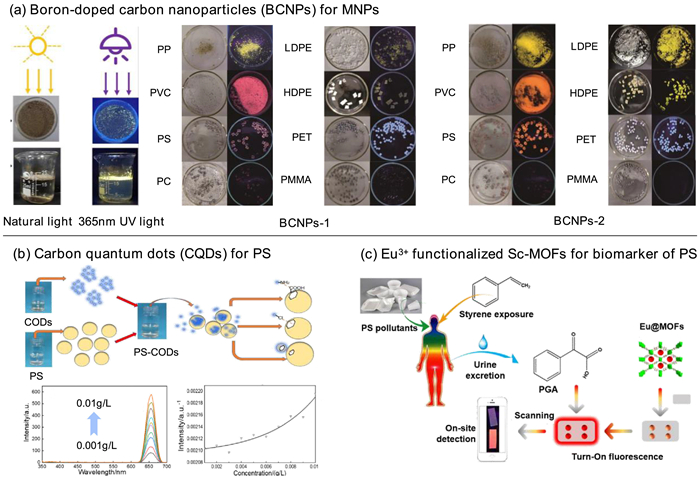
To overcome the problems including photo-bleaching and instability, novel probe based on nanomaterials particularly quantum dots have been developed, these probes exhibit enhanced optical stability, tunable surface functionality, and improved detection sensitivity, making them promising tools for MNPs analysis [74,75]. Carbon-based nanoprobes, such as carbon nanoparticles and carbon quantum dots (CQDs), have demonstrated excellent photostability and fluorescence properties suitable for long-term detection. Zhang et al. synthesized boron-doped carbon nanoparticles (BCNPs) via a solvothermal reaction between nitrated pyrene and boric acid (Fig. 2a). The hydrophobic BCNPs are able to adsorb on the surface of MNPs, imparting fluorescent properties [76]. Different plastics exhibit different colors and intensities from the fluorescence emission of BCNPs to distinguish different types of MNPs (e.g., PP, PE, PVC, PS). The practical applicability of BCNPs was verified in soil and water samples and semi-quantitatively analyzed by Image J software. The method realized the rapid detection and tracking of MNPs.
Figure 2
Figure 2.
Nano-fluorescent material. (a) Boron-doped carbon nanoparticles (BCNPs) for MNPs. Copied with permission [76]. Copyright 2022, Elsevier. (b) Carbon quantum dots (CQDs) for PS. Copied with permission [77].Copyright 2023, MDPI. (c) Eu3+ functionalized Sc-MOFs for biomarker of PS. Copied with permission [78]. Copyright 2017, Elsevier.
Similarly, Zhao et al. reported nitrogen and chlorine co-doped carbon quantum dots (N, Cl-CQDs), where a synergistic heteroatomic doping strategy promoted stable blue luminescence and enhanced MPs adsorption efficiency through optimized surface charge distribution and intermolecular interactions (Fig. 2b). By coupling fluorescence quenching with Rayleigh scattering signal amplification, the N, Cl-CQDs enabled size-selective detection of PS MPs at 50 nm, 1 μm, and 5 μm. These quantum dots exhibited exceptional photostability, retaining 95% of their initial fluorescence intensity after 120 min of continuous irradiation [77]. This dual-mode detection platform effectively addressed the critical challenge of differentiating sub-micron plastic particles in complex aqueous environments, and the robust optical performance demonstrate its potential for long-term monitoring applications.
Beyond direct particle detection, nanoprobes have also been employed to detect chemical biomarkers released from plastics. For example, phenylglyoxylic acid (PGA), a specific metabolite of PS, has been used as an indirect indicator of PS exposure. Eu3+-functionalized Sc-based metal organic frameworks (MOFs) was developed as turn-on fluorescent switch for PGA through a ligand-to-metal charge transfer (LMCT) process (Fig. 2c). The fluorescence intensity of the Eu@MOFs was significantly enhanced when bound to PGA, with no interference from other biomarkers. This probe for PGA exhibits high sensitivity (LOD = 4.16 ppb), rapid response time (< 5 s) and a broad linear range (0.02 mg/mL to 0.5 mg/mL). In addition, the study developed an on-site assay based on a paper-based probe and a smartphone for quantitative analysis via a color scanning App [78].
The high specific surface area and active components of nanoprobes enable them to recognize target MNPs through hydrophobic forces, π-π interactions and electrostatic interactions [76]. However, the long-term chemical and photostability, adsorption durability, and matrix-tolerance of nanoprobes under realistic environmental conditions require further validation.
2.3
Aggregation-induced emission (AIE) probes
AIE molecules with aggregation-induced emission properties show weak fluorescence in the dispersed state and significantly enhanced fluorescence in the aggregated state [79-82]. This unique property provides a distinct advantage for MPs detection, effectively minimizing background fluorescence interference and enhancing detection sensitivity. The design of fluorescent probes based on AIE molecules typically involves the integration of AIE molecules with specific recognition units, enabling selective adsorption onto the surface of MPs.
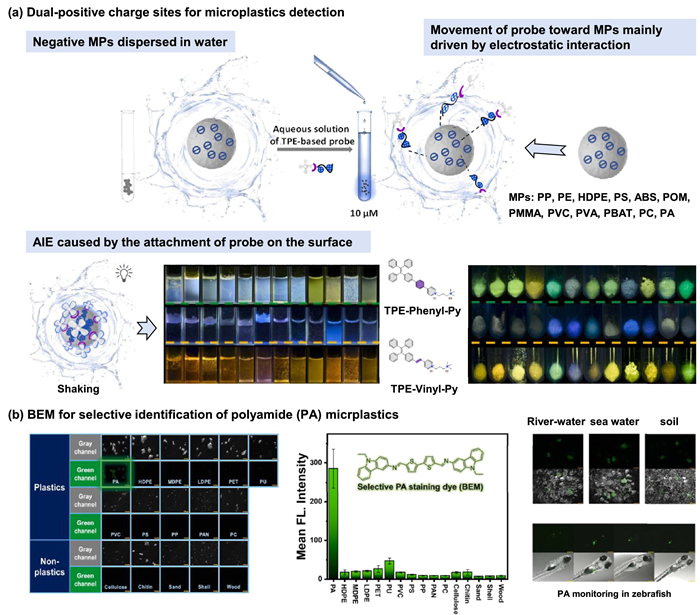
Wang et al. developed novel tetraphenylethene (TPE) derivatives with excellent water solubility by introducing dual-positive charge sites into the TPE backbones [83]. In these derivatives, TPE moieties are linked to pyridinium and quaternary ammonium cations through phenyl and vinyl groups, respectively (Fig. 3a). Two probes, TPE-Phenyl-Py linked via phenyl and TPE-Vinyl-Py linked via vinyl to positively charged groups, were synthesized. Due to the immobilization-induced emission of TPE derivatives and the inherent fluorescence of MPs, the color particles can be distinguished according to their unique emission color. The hydrophobicity of the TPE backbone, in conjunction with the hydrophobic regions on the MP surfaces, enhances adsorption stability. The probe is effective for 12 common plastics (PP, PE, HDPE (high-density polyethylene plastics), PS, ABS (acrylonitrile-butadiene-styrene), POM (polyoxymethylene), PMMA (poly(methyl methacrylate)), PVC, PVA, PBAT, PC (polycarbonate), PA) and demonstrates excellent selectivity in complex environments such as freshwater and simulated seawater. The probe exhibits good stability under long-term storage (30 days) and continuous light exposure (30 min). Due to its favorable hydrophilicity and weak background fluorescence, TPE-vinyl-Py demonstrated exceptional sensitivity in detecting MPs leached from tea bags immersed in water at 95 ℃.
Figure 3
Figure 3.
AIE fluorescent probe materials are used for identifying MNPs. (a) Dual-positive charge sites for MPs detection. Copied with permission [83]. Copyright 2025, Elsevier. (b) BEM for selective identification of PA MPs. Copied with permission [84]. Copyright 2025, Elsevier.
Song et al. synthesized (1E,1′E)-1,1′-([2,2′-bithiophene]−5,5′-diyl)bis(N-(9-ethyl-9H-carbazol-3-yl)methanimine) (BEM) for selective identification of PA MPs [84]. This probe demonstrated outstanding selectivity for PA among 11 types of MPs and 5 types of non-plastic materials. The probe incorporates a π-conjugated system of carbazole and dithiophene, which enhances hydrogen bonding interactions with PA through the introduction of an imine group (Fig. 3b). Moreover, BEM was successfully applied for the selective identification of PA in environmental samples such as river water, seawater, and soil without the need for pretreatment, as well as for in vivo monitoring in zebrafish. Besides, compared with Nile red, the cost has been significantly reduced by about 12 times. This huge cost difference highlights the economic feasibility of BEM in practical applications.
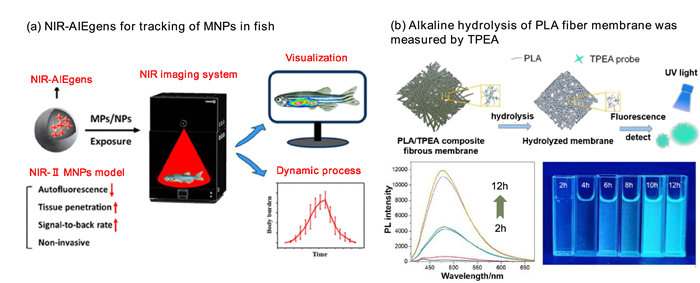
In addition to specifically recognition for target MNPs [85], AIE probes can be used to dynamically monitor the accumulation and transport processes of MNPs in individuals. Yang et al. developed near-infrared (NIR)-AIE fluorophore-labelled MPs (2 μm) and NPs (100 nm) as models for MNPs [86]. Based on the strong emission in the second near-infrared window of the NIR-AIE technique, which effectively avoid the intrinsic fluorescence interference (Fig. 4a). Due to the deep tissue penetration and noninvasiveness of the probe, they can visualize and quantify the process of uptake and deposition of MNPs in zebrafish. The probes provide a reliable tracking technique for visualizing, tracing and quantifying MNPs in vivo.
Figure 4
Figure 4.
AIE fluorescent probe materials are used for process detection. (a) NIR-AIEgens for tracking of MNPs in fish. Copied with permission [86]. Copyright 2023, American Chemical Society. (b) Alkaline hydrolysis of PLA fiber membrane was measured by TPEA. Copied with permission [87]. Copyright 2023, Elsevier.
Besides, As shown in Fig. 4b, AIE probe were incorporated into polylactic acid (PLA)-base fibrous membrane via electrospinning [87] or embedding methods [88] to investigate the hydrolysis process of PLA. The release and aggregation of AIE molecules generate a strong fluorescence signal, enabling real-time monitoring of PLA hydrolysis with high sensitivity and rapid response, using a non-invasive approach. Fluorescence intensity changes, resulting from the release of TPEA from the fibrous membrane [87] and the synthesized amphiphilic AIE probe embedded in the PLA matrix, were examined to track the hydrolysis process.
In general, AIE probes have the following advantages: (1) AIE molecules exhibit significantly enhanced fluorescence in the aggregated state, providing high sensitivity; (2) some AIE probes are non-fluorescent in solution, and only emit light when bound to the target plastic, thereby reducing false positive signals from environmental matrices (e.g., natural organics); (3) no need for complex instrumentation and pretreatment; (4) high optical stability of the AIE probes in the solid or adsorbed state. However, the complexity of probe synthesis and the need to balance the solubility of the probe with the detection sensitivity in complex samples still need to be further improved.
2.4
Bioprobes
2.4.1
Peptide-based fluorescent probes
To achieve selective fluorescence detection of different types of MNPs, it is important to screen specific recognition probes. Ulrich Schwaneberg group used an Escherichia coli cell-surface screening system to screen binding peptides with high specificity and affinity for the common plastics PS and PP [89,90]. Suzuki et al. reported synthetic peptides that specifically recognized poly(N-isopropylacrylamide) (PNIPAM) [91]. Based on the abundant intermolecular forces between the peptide and MNPs, including electrostatic, hydrogen bonding, coordination, π-π, and hydrophobic interactions, the binding peptide selectively adsorbs on the surfaces of polymers, such as PS, PP, or PNIPAM, and achieves specific recognition of plastic polymers. Woo et al. used the binding peptide as a recognition group and fluorescent molecule FITC to provide fluorescence signals, the results verified that the binding peptide has a high selectivity and affinity for plastic polymers under different conditions such as ionic strength of the medium and surface oxidation [92]. The peptide showed strong binding affinity for both unoxidized and plasma-oxidized MPs in deionized water and 3.5% saline solution (simulated seawater), and the binding efficiency of PP was higher than that of PS. However, the method still suffers from complexity, a single pattern of fluorescence signals and responses, insufficient accuracy, and poor immunity to interference.
2.4.2
Aptamer-based fluorescent probes
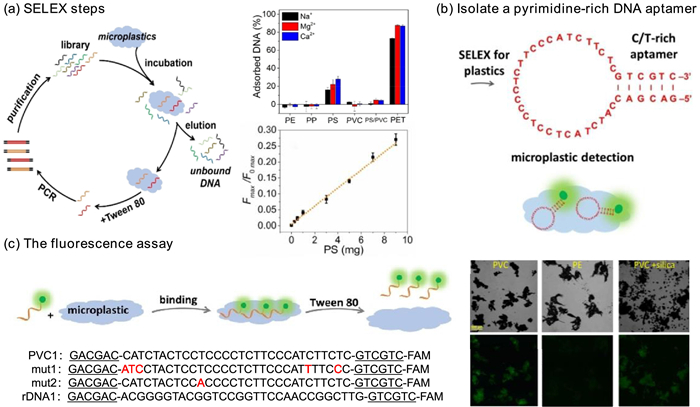
Nucleic acid aptamers are single-stranded DNA or RNA molecules obtained through the systematic evolution of ligands by exponential enrichment (SELEX) technology, capable of specifically recognizing target substances. Aptamer are labelled with fluorescent groups for the detection of targets. Zandieh et al. used the SELEX technique to screen DNA aptamers based on the surface properties of PVC and PS MPs (PVC is a weak DNA adsorbent while PS is a moderate DNA adsorbent) (Fig. 5). DNA adsorption and elution conditions were optimized by adjusting the metal ions (e.g., Na+, Mg2+, Ca2+) and surfactants (Tween 80) in the buffer to ensure aptamer enrichment. The aptamer is rich in pyrimidines, making easier to interact with hydrophobic plastic surfaces (e.g., PVC, PS) through van der Waals forces. After labeling with fluorescein, selectively detection of PVC and PS MPs was achieved with the detection limit as low as the milligram level [93]. Microscopy combined with fluorescent labelling enables morphological identification of MPs, distinguishing PVC from PE or silica.
Figure 5
Figure 5.
Nucleic acid aptamer fluorescent probes. (a) SELEX steps, (b) isolate a pyrimidine-rich DNA aptamer, (c) the fluorescence assay. Copied with permission [93]. Copyright 2024, Wiley-VCH Verlag.
Nucleic acid aptamer fluorescent probes possess the advantages of high selectivity and sensitivity, enabling accurate identification of target MPs in complex samples. Nevertheless, the stability of aptamers is relatively poor, and they are prone to structural changes under different environmental conditions, thereby influencing their recognition ability towards MPs. In complex samples, there may exist other substances that non-specifically bind to aptamers, interfering with the detection results.
3.
Fluorescence imaging techniques for MNPs detection
3.1
Integration of fluorescence sensing with micro-imaging
Fluorescence imaging techniques coupled with advanced micro-imaging systems, can achieve high spatial resolution. Using confocal scanning (CFM, CLSM) or STED ultra-high resolution laser confocal microscopy, fluorescent particles < 100 nm can be analyzed [8,18,47]. Based on high-resolution fluorescence image analysis, gel permeation chromatography [94], microfluidic detection [95] or flow cytometry, it is possible to obtain information on the size, shape, and particle concentration of MNPs, especially smaller-sized NPs. Consequently, micro-imaging fluorescence spectroscopy holds significant potential for MNP detection, offering valuable applications in environmental monitoring. Numerous studies have demonstrated the successful application of fluorescence micro-imaging integration for MNPs detection [96]. For instance, Z-stack CLSM with Nile Red staining has enabled the volumetric quantification of MPs in environmental samples, providing accurate 3D data on the distribution and size of MNPs [19]. Similarly, Raman spectroscopy has been utilized to identify and visualize NPs using enhanced Raman signals through SERS [97].
Although these technologies offer powerful tools for in situ detection, several challenges remain including fluorescence quenching and probe stability especially in complex environmental samples with high levels of organic matter. Moreover, signal interference from non-target materials can lead to false positives. This has been addressed in some studies by combining differential staining methods to selectively stain plastics and avoid interference from non-plastic materials.
3.2
AI integration for advanced MNPs detection
To improve detection capabilities, AI-assisted platforms combined with fluorescence and microimaging technologies are a promising approach. Machine learning algorithms can assist in automating the image analysis process, reducing manual bias, and supporting large-scale data processing, facilitating high-throughput environmental monitoring.
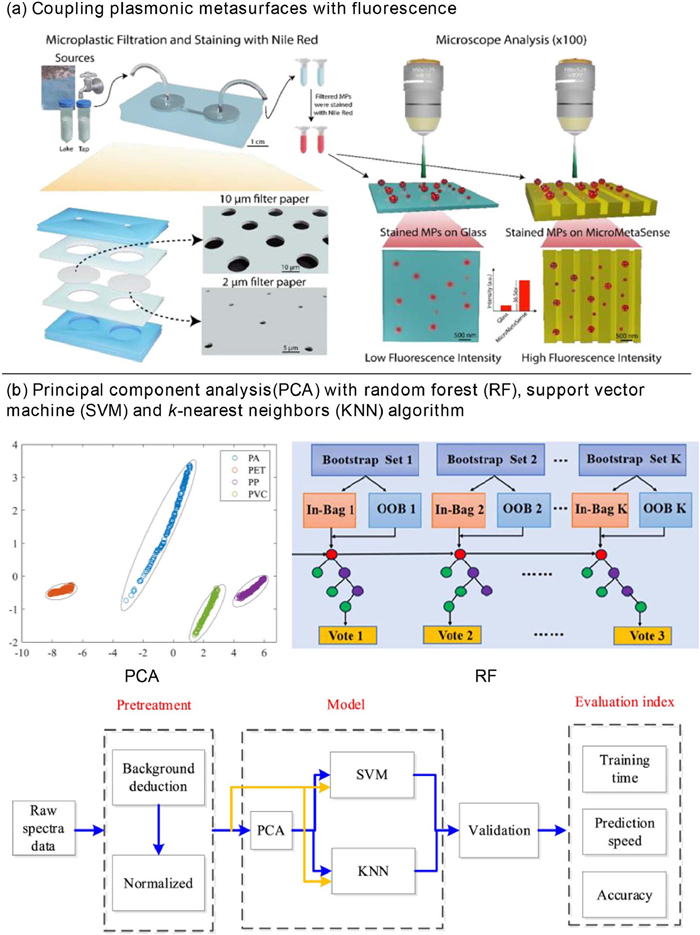
As shown in Fig. 6a, the MicroMetaSense’s platform leverages the metal-enhanced fluorescence phenomenon to detect a wide range of MPs sizes and types. It demonstrates an enhancement rate of 36.56-fold in detecting MPs compared to the standardized protocols. Besides, it presents many advantages for MNPs detection including simplify the testing process (within 30 min with 4 simple steps), cost-effectiveness ($2), and improved sensitivity (183−205 femtogram of MPs). MicroMetaSense enables the detection of sub-micron MPs over a wide size range (250 nm to 100 µm) with minimal instrumentation (just a standard fluorescence microscope). This approach holds great promise for achieving precise particle size distribution and significantly enhancing the detection of both laboratory and real environmental samples [98].
Figure 6
Figure 6.
Combined fluorescence with other analytical techniques. (a) Isolated exciton hypersurfaces coupled with fluorescence. Copied with permission [98]. Copyright 2024, American Chemical Society. (b) Principal component analysis (PCA) with random forest (RF), support vector machine (SVM) and k-nearest neighbors (KNN) algorithm. Copied with permission [99,100]. Copyright 2025, Elsevier.
Laser-induced fluorescence (LIF) technology, using a laser as the excitation source, enhances sensitivity (detection of trace substances), high selectivity (specificity through matching of excitation and fluorescence wavelengths), and fast response (real-time detection capability). Furthermore, the combination of LIF and STED microscopy has improved the resolution of nanoscale plastics detection and shown great potential in detecting MNPs.
Overlapping fluorescence signals pose a significant challenge in accurately identifying the types and proportions of MNPs. To address this, several studies have incorporated machine learning techniques to analyze the data, utilizing algorithms to automatically identify fluorescence spectral signatures and enhance detection efficiency [99-104]. Recent advances in fluorescence spectroscopy combined with machine learning (Fig. 6b) have significantly improved the detection and quantification of marine MPs, particularly in overcoming challenges associated with spectral overlap [99,100].
In the study from Lanjun et al [100], LIF spectra of four MP types were pretreatment via baseline correction, low-pass filtering, and Savitzky-Golay smoothing, followed by normalization to mitigate noise and intensity variations. Principal component analysis (PCA) combined with support vector machine (SVM) and k-nearest neighbors (KNN) algorithm achieved a classification accuracy of 100%, which was significantly higher than SVM alone or KNN. This approach offers distinct advantages over conventional spectroscopic methods, such as Raman spectroscopy, which is prone to fluorescence interference, and FTIR, which requires complex sample preparation. Notably, the method maintains 100% classification accuracy for both aged and seawater samples, is non-destructive, supports automated classification and concentration inversion, and minimizes manual errors.
In contrast, Meng et al. addressed the challenge of severe spectral overlap in mixed MPs by employing a PCA-random forest (RF) hybrid approach [99]. Their workflow involved smoothing and mean-centering of 2250 LIF spectra, followed by PCA to extract the first three principal components which accounted for 98.4% of the cumulative variance. The RF model, optimized through hyperparameter tuning (100 trees, max depth = 15), utilized bootstrapping and out-of-bag error analysis to assess feature importance. The method achieved a classification accuracy of 99.7% for seven types of MPs (both pure plastics and mixtures), outperforming other algorithms such as linear discriminant analysis (74.4%) and SVM (78.4%). Additionally, the approach demonstrated > 80% accuracy in recognizing real marine samples, facilitating the detection of complex environmental samples, including aged plastics.
Machine learning techniques like SVM, KNN, and RF significantly improve classification accuracy and support the identification of complex mixed samples, while enabling real-time monitoring and reducing detection time from hours to seconds in traditional methods. These advancements offer critical technical support for environmental policy-making, pollution source tracking, and ecological risk assessment. However, real-sample validation has limitations at high concentrations due to environmental aging, highlighting the need for data augmentation or transfer learning to mitigate spectral discrepancies between laboratory and field samples. Both studies emphasize the critical role of PCA in extracting discriminative spectral features and the usefulness of machine learning in resolving overlapping features. While SVM and KNN excel in rapid classification, RF provides superior interpretability and accuracy, especially for complex mixtures. Future research should focus on integrating multimodal data fusion and adaptive learning frameworks to cope with environmental variability and improve field applicability.
4.
Summary and outlook
Fluorescence-based techniques have emerged as a pivotal tool for detecting MNPs due to their superior sensitivity and real-time analysis capacity. However, its practical deployment in environmental analysis remains constrained by a range of challenges, including matrix interference, lack of quantification standards, fluorescence quenching, and probe-induced particle alteration.
We have compared their performance characteristics of different fluorescent probes for the detection of MNPs in Table 1. Fluorescent staining dyes provide simple and rapid visualization based on physical interactions, while nanoprobes leverage nanoscale surface effects to boost sensitivity. AIE probes uniquely activate fluorescence upon aggregation, enabling high signal-to-noise detection in challenging environments. Bioprobes offer molecular-level recognition via aptamers or antibodies, granting unmatched selectivity for specific MNP types.
Table 1
Table 1.
Characteristics of different fluorescent probes for the detection of MNPs.
Hydrophobic or electrostatic interactions with MNPs surfaces
Low
Low
Low
Low
Low
Nanoprobes
Signal amplification via nanoparticle-enhanced fluorescence
High
Low
High
High
Low
AIE probes
Restricted intramolecular motion
High
Medium
Medium
High
High
Bioprobes
Specific molecular recognition such as aptamer-target
High
High
High
Low
High
Traditional organic dyes are widely used due to their low cost and simplicity, making them suitable for rapid preliminary screening. However, they often suffer from aggregation-caused quenching and poor photostability in complex matrices. In contrast, AIE-based dyes exhibit fluorescence upon aggregation, offering enhanced signal-to-noise ratios and better performance in turbid or particle-rich samples. Nanoparticle-based probes, including quantum dots and carbon dots, provide high brightness and tunable surface functionality, enabling sensitive and multiplexed detection. However, their synthesis complexity and potential toxicity remain concerns. Bioprobes, such as aptamers and peptide-functionalized sensors, offer high molecular specificity and adaptability to different MNP types, particularly for recognizing polymer-specific surface features, but often require more sophisticated design and validation.
Overall, the trade-offs between sensitivity, specificity, photostability, cost, and ease of synthesis should be carefully considered when designing detection platforms for real-world applications. Future research should focus on the development of next-generation multifunctional fluorescent probes, which exhibit excellent optical properties, surface tunability, and environmental stability. These materials need to be verified through experiments to improve detection sensitivity, reduce background interference, and achieve accurate imaging and quantitative analysis in actual sample matrices.
At the data analysis level, the integration of AI-assisted platforms represents a critical advancement. Deep learning algorithms can be trained on large image datasets to enable automated fluorescence image segmentation, particle morphology classification, and spectral deconvolution. When embedded into portable fluorescence imaging systems, these platforms can allow on-site detection, reduce manual bias, and significantly improve throughput and reproducibility.
In parallel, the establishment of standardized reference materials is urgently needed. These materials should replicate environmentally relevant MNPs in size, morphology, polymer composition, and surface chemistry, and remain stable across analytical conditions. Such standards would not only support inter-laboratory comparisons but also underpin future regulatory frameworks.
In-situ and portable detection techniques, including microfluidic fluorescence assays, and smartphone-based imaging modules, are gaining traction as practical tools for environmental monitoring. They offer rapid, user-friendly, and decentralized screening possibilities, crucial for early-warning systems and longitudinal environmental assessments.
These technical innovations are expected to deepen our understanding of the environmental fate, transport, and bioavailability of MNPs. More importantly, they will enable the development of evidence-based risk assessment models and policy tools for addressing plastic pollution. Interdisciplinary collaboration bridging materials science, environmental engineering, analytical chemistry, and data science will be essential for translating laboratory innovations into field-ready solutions that support a sustainable and resilient future.
Declaration of competing interest
The authors declare that they have no known competing financial interests or personal relationships that could have appeared to influence the work reported in this paper.
CRediT authorship contribution statement
Xingyu Wu: Writing – original draft, Formal analysis, Data curation, Conceptualization. Qiuju Li: Writing – review & editing, Supervision, Formal analysis, Data curation, Conceptualization. Yuxin Li: Formal analysis, Data curation. Boyang Zong: Formal analysis, Data curation. Yujing Gong: Formal analysis, Data curation. Shun Mao: Writing – review & editing, Supervision, Resources, Conceptualization.
Acknowledgment
This work was supported by the National Natural Science Foundation of China (No. 22376160).
Supplementary materials
Supplementary material associated with this article can be found, in the online version, at doi:10.1016/j.cclet.2025.112194.
[1]
R.C. Thompson, Y. Olsen, R.P. Mitchell, et al., Science 304 (2004) 838 -838. doi: 10.1126/science.1094559
[2]
M. MacLeod, H.P.H. Arp, M.B. Tekman, et al., Science 373 (2021) 61–65. doi: 10.1126/science.abg5433
[3]
J.R. Jambeck, R. Geyer, C. Wilcox, et al., Science 347 (2015) 768–771. doi: 10.1126/science.1260352
L. Xie, M. Ma, Q. Ge, et al., Environ. Sci. Technol. 59 (2025) 8885–8899. doi: 10.1021/acs.est.4c11888
[103]
Y. Li, X. Wang, H. Zhang, et al., Environ. Sci. Technol. 58 (2024) 18335–18344. doi: 10.1021/acs.est.4c05022
[104]
Z. Wang, D. Pal, A. Pilechi, et al., Environ. Sci. Technol. 58 (2024) 8919–8931. doi: 10.1021/acs.est.3c10408
Figure 1
Common fluorescent dyes for MNPs detection. (a) Chemical structures of different fluorescent dyes [56]. (b) Different morphologies MPs dyeing: Spheres (10−90 μm), fragments (50−300 μm), and fibers (30−60 μm/150−5000 μm) dyed with iDye pink. Copied with permission [54]. Copyright 2019, American Chemical Society. (c) Different dyes for different MPs dyeing: (Ⅰ) original color of polymers, (Ⅱ) polymers stained by 55 mg/mL Rit pink dye, (Ⅲ) polymers stained by 5 mg/mL iDye pink dye, (Ⅳ) polymers stained by 2 µg/mL methanol-based Nile Red, and (Ⅴ) polymers stained by 2 µg/mL water-based Nile Red at 70 ℃ for 3 h. Scale bar denotes 1 m. HDPE: high-density polyethylene, PC: polycarbonate, PEST: Polyester. Copied with permission [55]. Copyright 2022, MDPI.
Figure 3
AIE fluorescent probe materials are used for identifying MNPs. (a) Dual-positive charge sites for MPs detection. Copied with permission [83]. Copyright 2025, Elsevier. (b) BEM for selective identification of PA MPs. Copied with permission [84]. Copyright 2025, Elsevier.
Figure 4
AIE fluorescent probe materials are used for process detection. (a) NIR-AIEgens for tracking of MNPs in fish. Copied with permission [86]. Copyright 2023, American Chemical Society. (b) Alkaline hydrolysis of PLA fiber membrane was measured by TPEA. Copied with permission [87]. Copyright 2023, Elsevier.
Figure 6
Combined fluorescence with other analytical techniques. (a) Isolated exciton hypersurfaces coupled with fluorescence. Copied with permission [98]. Copyright 2024, American Chemical Society. (b) Principal component analysis (PCA) with random forest (RF), support vector machine (SVM) and k-nearest neighbors (KNN) algorithm. Copied with permission [99,100]. Copyright 2025, Elsevier.

 DownLoad:

 下载:
下载:


 下载:
下载:
