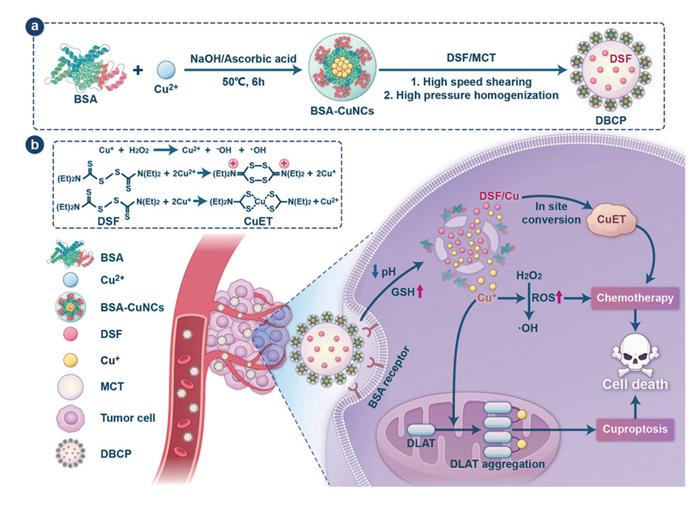
Figure 1.
Schematic illustration of BSA-CuNCs-stabilized spatial-isolated oil-water biphasic Pickering emulsion (DBCP) for inhibiting premature DSF/Cu interaction and enhancing chemo-cuproptosis synergy.

Spatial-isolated oil-water biphasic Pickering emulsions inhibit premature disulfiram-copper interaction for enhanced chemo-cuproptosis synergy
Ying Chen , Jun Zhang , Haoran Ye , Shengli Shen , Junyu Wang , Juan Wang , Xintong Li , Xinghong Luo , Ling Tao , Wenchuang (Walter) Hu , Xiangchun Shen , Yongchao Yao


Drug repurposing has emerged as a transformative strategy in oncology therapeutics, offering distinct advantages in terms of reduced development risks, accelerated timelines, and lower costs compared to conventional drug discovery approaches [1–3]. Among promising candidates, disulfiram (DSF), a Food and Drug Administration (FDA)-approved anti-alcoholism medication with seven decades of clinical application, has recently garnered significant attention due to its unexpected antitumor properties [4]. This renewed interest stems from a landmark 2017 Nature publication that not only demonstrated DSF's intrinsic tumor-targeting capability and associated 34% reduction in cancer mortality among long-term users, but also mechanistically elucidated its anticancer activity through the formation of cytotoxic copper-diethyldithiocarbamate complexes (CuET) in tumor tissues [5–8]. However, the clinical translation of DSF for oncology applications faces two fundamental pharmacological challenges: Rapid hepatic first-pass metabolism that severely limits systemic bioavailability, and insufficient endogenous copper concentrations in tumor microenvironments to support optimal CuET generation [9–11].
To overcome these limitations, nanoscale co-delivery systems combining DSF with copper have been actively explored as a strategy to simultaneously enhance tumor accumulation while ensuring controlled, on-demand CuET formation [12–14]. While these systems have shown promise in preclinical studies, their development has been hampered by an inherent physicochemical challenge, the extreme reactivity between DSF and copper ions leading to premature CuET formation and degradation during nanoparticle fabrication and systemic circulation [9,15]. This critical stability issue not only reduces the effective payload reaching tumors but also causes off-target cytotoxicity, highlighting the urgent need for alternative delivery platforms capable of maintaining strict physical separation between these reactive components while enabling their synchronized release in target tissues [16,17].
Pickering emulsions represent an innovative solution to this formulation challenge, owing to their unique oil-water biphasic compartmentalized architecture that enables independent loading of lipophilic and hydrophilic therapeutic agents in distinct phases [18–20]. In these systems, solid nanoparticles adsorbed at the oil-water interface not only stabilize the emulsion but also create a physical barrier that can block premature interaction between phase-separated compounds, exactly addressing the DSF/Cu co-delivery instability issue. For our system, we selected bovine serum albumin (BSA) as the foundational emulsifier material and further engineered it into BSA-copper nanoclusters (BSA-CuNCs) for dual functions: on one hand, BSA itself possesses exceptional biocompatibility, biodegradability with minimal immunogenicity [21–23], natural tumor-targeting capability via scavenger receptors and low-density lipoprotein receptor [24], and pH- and glutathione (GSH)-responsive behavior for triggered drug release [25–27]; on the other hand, its histidine and cysteine residues enable stable chelation of Cu2+ to form BSA-CuNCs [28], which act as particulate emulsifiers to stabilize the Pickering emulsion while serving as the copper reservoir.
With these considerations in mind, we herein develop a spatial-isolated oil-water biphasic Pickering emulsion (DSF@BSA−CuNCs/PE, abbreviated as DBCP, Fig. 1a) that achieves precise phase-separated co-delivery of DSF and copper: Lipophilic DSF is encapsulated in the medium-chain triglyceride (MCT) oil core, while hydrophilic Cu2+ is chelated within the BSA-CuNCs-based emulsifier layer at the oil-water interface. This engineered system demonstrates multiple favorable pharmacological behaviors (Fig. 1b): Efficient tumor accumulation via both passive (enhanced permeability and retention (EPR) effect) and active (BSA-mediated) targeting mechanisms, followed by synchronous release of DSF and Cu triggered by the tumor microenvironment's acidic pH and elevated GSH. The in-situ generated CuET subsequently mediates conventional chemotherapy in conjunction with Fenton-like reactions, while excess copper accumulates in mitochondria, binds to dihydrolipoamide S-acetyltransferase (DLAT), and induces cuproptosis, thereby achieving enhanced chemo-cuproptosis synergy. This Pickering emulsion co-delivers DSF/Cu via its oil-water biphasic structure, effectively overcoming their instability, optimizing delivery efficiency, and enhancing safety and accessibility, thus holding greater clinical value.
Bovine serum albumin-stabilized copper nanoclusters (BSA-CuNCs or BC) were synthesized via a slightly modified one-pot method [29]. Dynamic light scattering (DLS) showed BC had a hydrodynamic diameter of 12.16 ± 0.65 nm and a polydispersity index (PDI) of 0.229 ± 0.037, with a distinct Tyndall effect confirming good monodispersity (Fig. 2a). Transmission electron microscopy (TEM) revealed spherical BC with a monodisperse size distribution and an average particle size of 7.34 ± 2.10 nm (Fig. 2b and Fig. S1 in Supporting information). The ~4.82 nm difference from DLS data is attributed to hydration layer effects [30]. Literature indicates that standard BSA-CuNCs typically exhibit a zeta potential ranging from −21 mV to −40 mV [31–33], a range that ensures colloidal stability through electrostatic repulsion and enhances interfacial adsorption. Ultraviolet-visible (UV-vis) spectroscopy showed reduced absorbance of BSA's 280 nm characteristic peak in BC (Fig. S2 in Supporting information), due to nanocluster-induced enhanced light scattering [34]; no surface plasmon resonance (SPR) bands at 400–600 nm confirmed the absence of large copper nanoparticles. Photoluminescence (PL) spectroscopy indicated BC emitted blue light at 445 nm under 355 nm excitation (Fig. S3 in Supporting information), a 97 nm red shift relative to BSA (348 nm, Fig. S4 in Supporting information) likely caused by ligand-to-metal charge transfer (LMCT) from Cu-S bonding [35]. Fourier-transform infrared (FTIR) spectra (Fig. 2c) showed BSA and BC had similar amide Ⅰ (1650 cm−1) and Ⅱ (1540 cm−1) bands, confirming BSA structural integrity; the disappearance of BC's 2350 cm−1 -SH peak verified cysteine thiols participated in Cu-S bond formation [36]. X-ray photoelectron spectroscopy (XPS) confirmed BC contained Cu, O, N, C, and S (Fig. S5 in Supporting information). High-resolution Cu 2p spectra (Fig. 2d) showed peaks at 932.3 eV (Cu 2p3/2) and 952.0 eV (Cu 2p1/2) without Cu2+ satellite peaks at 940–945 nm; Cu LMM Auger spectra (Fig. S6 in Supporting information) had a 916.8 eV peak (typical of Cu2O), confirming Cu+ presence [37]. S 2p spectrum deconvolution (Fig. S7 in Supporting information) showed a dominant 164.2 eV peak (cysteine thiolate in Cu-S bonds), further supporting sulfur's coordination role in stabilization.
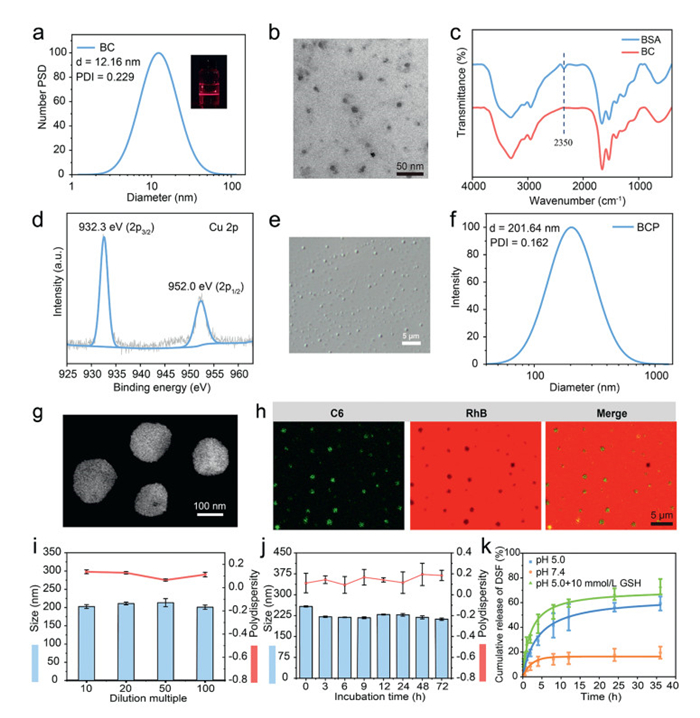
BC was employed as a particulate emulsifier in combination with MCT as the oil phase to fabricate BC-stabilized Pickering emulsions (BCP) under varying emulsifier concentrations and oil-to-water ratios via high-speed shear homogenization followed by high-pressure homogenization, demonstrating excellent reproducibility and scalability. The resulting BCP exhibited a milky white and opaque appearance (Fig. S8 in Supporting information, where w(BC) = 1.2% served as a representative example). Optical microscopy revealed that BCP achieved optimal emulsification, with a mean droplet diameter of 222.65 ± 80.79 nm, at a BC concentration of 1.2% (w/w, [Cu] = 77.5 ppm) and an oil-to-water volume ratio of 1:20 (v/v) (Fig. 2e, Figs. S9 and S10 in Supporting information). Under the optimal formulation, DLS showed that BCP exhibited a hydrated particle size of 201.64 ± 1.42 nm with a PDI of 0.162 ± 0.054 (Fig. 2f), confirming good dispersion uniformity. TEM further verified its spherical morphology and average particle size of 160.05 ± 15.58 nm (Fig. 2g). Drop tests showed BCP aggregated rapidly in MCT but dispersed uniformly in water (Fig. S11 in Supporting information), preliminarily confirming an oil-in-water (O/W) Pickering emulsion [38]. Fluorescence microscopy, employing a hydrophobic coumarin-6 (C6)-labeled oil phase and a hydrophilic rhodamine B (RhB)-labeled aqueous phase [39], revealed that the green fluorescence of C6 was completely encapsulated within the red fluorescence of RhB, with no observable diffusion of green signal into the aqueous phase (Fig. 2h), thereby providing direct confirmation that the BCP system is an oil-in-water (O/W) emulsion. In addition, BCP showed excellent dilution stability (Fig. 2i), serum stability (Fig. 2j) and storage stability (Fig. S12 and Table S1 in Supporting information).
Building on the optimized formulation, a series of BSA-CuNCs-stabilized Pickering emulsions (DBCP) with varied drug loadings were prepared by dissolving DSF at different concentrations in MCT. Inductively coupled plasma mass spectrometry (ICP-MS) analysis showed a Cu loading capacity of 34.1% [40], while UV-vis spectroscopy revealed a maximum DSF drug loading (DL) of 1.84% ± 0.10% and encapsulation efficiency (EE) of 83.00% ± 4.38% (Fig. S13 and Table S2 in Supporting information), which may be ascribed to the limited solubility of DSF in MCT. Literature suggests that BSA-based nanoparticles demonstrate dual responsiveness to pH and GSH: at pH values near the isoelectric point of BSA (the isoelectric point (pI) = 4.7), charge neutralization induced by acidic conditions leads to hydrophobic aggregation through conformational changes in protein structure [33,41]. Additionally, Cu–S bonds within BSA-CuNCs are susceptible to GSH-mediated cleavage, resulting in nanoparticle disintegration under elevated intracellular GSH concentrations typical of tumor microenvironments [42]. To evaluate the dual-responsive characteristics of DBCP, DLS was employed to monitor changes in particle size and PDI under simulated physiological (pH 7.4), lysosomal acidic (pH 5.0), and tumor-relevant reductive conditions (10 mmol/L GSH) [43–46]. As shown in Fig. S14 (Supporting information), DBCP exhibited good colloidal stability at pH 7.4, with a hydrodynamic diameter below 250 nm and a PDI < 0.3. Upon exposure to pH 5.0, an increase in both particle size and PDI was observed, indicating initial aggregation. This effect was further exacerbated when pH 5.0 was combined with 10 mmol/L GSH, leading to a PDI exceeding 0.3, thereby confirming a synergistic structural transformation triggered by acidic and reductive stimuli. Release kinetics of DBCP were further evaluated (Fig. 2k). Only 19.52% ± 4.89% DSF was released at pH 7.4 within 36 h, avoiding premature leakage. At pH 5.0, DSF release increased to 59.27% ± 5.65% due to the partial disruption of the BSA-CuNCs interface induced by acidic conformational changes, and further reached 72.88%± 6.20% with 10 mmol/L GSH, where cleavage of Cu-S bonds completely destroyed the interfacial layer, thereby facilitating DSF release. UV-vis scans of release media (0.25, 4, 12, 36 h; Fig. S15 in Supporting information) correlated with release behavior. No CuET was detected at pH 7.4, while prominent CuET signals appeared at pH 5.0 and were enhanced by 10 mmol/L GSH, demonstrating dual stimuli-promoted in situ CuET generation. Given FDA approval of all DBCP components except Cu2+, blood compatibility was assessed via hemolysis assay [47]. As depicted in Fig. S16 (Supporting information), hemolysis rate remained < 5% at Cu2+ concentrations ≤2.4 µmol/L, indicating excellent blood compatibility.
Effective cellular uptake is critical for accumulating Cu2+ and DSF to drive in situ CuET production and cuproptosis in tumor cells. The internalization of DBCP by 4T1 cells was evaluated via fluorescence microscopy and flow cytometry using fluorescent labeling [39,48]. 1,1′-Dioctadecyl-3,3,3′,3′-tetramethylindocarbocyanine perchlorate (DiI)-labeled DBCP was efficiently taken up by 4T1 cells in a time-dependent manner. As shown in Fig. 3a, DiI fluorescence was uniformly distributed in the cytoplasm, with intensity increasing gradually with prolonged incubation, indicating sustained DBCP internalization. Flow cytometry quantification (Fig. 3b) revealed that after 3 h of incubation, intracellular DiI fluorescence intensity was 13.7-fold higher than that in the untreated control, further confirming efficient DBCP cellular uptake.
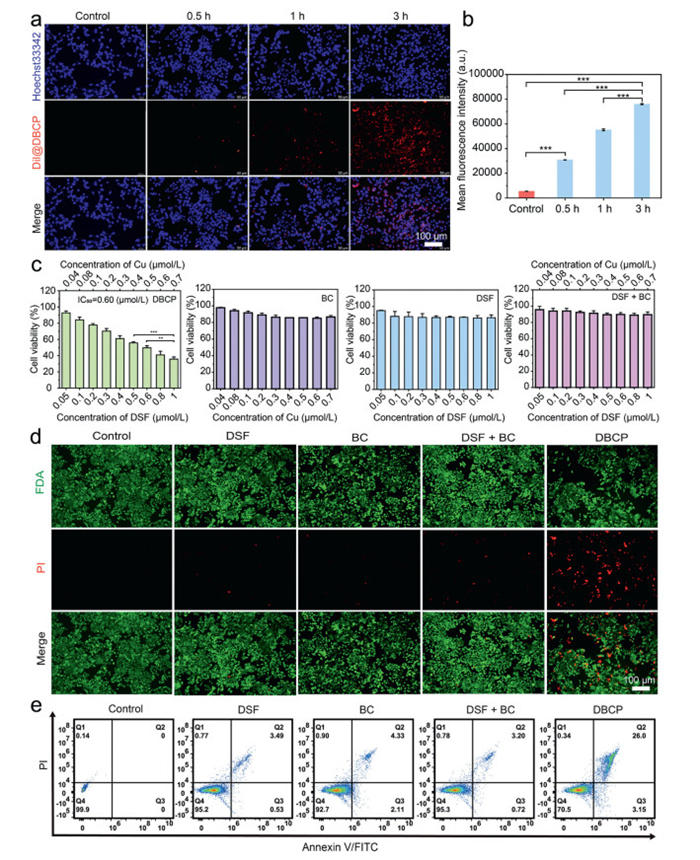
Thereafter, a systematic investigation of DBCP's in vitro anticancer efficacy was performed. First, MTT assay evaluated its cytotoxicity against human umbilical vein endothelial cells (HUVECs) normal cells, RAW 264.7 immune cells, and 4T1 tumor cells. As depicted in Fig. 3c and Fig. S17 (Supporting information), 4T1 viability decreased concentration-dependently, while HUVEC and RAW 264.7 survival remained > 85% under the same concentrations, demonstrating DBCP's selective tumor cytotoxicity. We further compared cytotoxicity of different formulations (DSF, BC, DSF + BC) against 4T1cells. Neither DSF nor BC alone inhibited 4T1 proliferation; DSF + BC showed significantly lower cytotoxicity, likely attributable to premature interaction in the culture medium, resulting in the formation of extracellular complexes with limited cellular internalization. In contrast, DBCP exhibited the strongest cytotoxicity among all formulations, reducing 4T1 viability to 35.7% ± 2.6% at 1.0 µmol/L DSF. The superior cytotoxicity of DBCP was confirmed by live/dead cell staining (Fig. 3d), in which the DBCP group exhibited the highest number of dead cells, as indicated by intense red fluorescence. This finding was further validated by flow cytometric apoptosis analysis (Fig. 3e), where an increase in double-positive cells corresponded to enhanced cytotoxic effects of DBCP.
To explore DBCP-induced tumor cell death mechanisms, cellular-level validation was performed by assessing 4T1 viability after pretreatment with cell death pathway inhibitors. As indicated in Fig. 4a, tetrathiomolybdate (TTM, Cu2+ chelator), UK-5099 (mitochondrial pyruvate transporter inhibitor), and Z-VAD-FMK (apoptosis inhibitor) all protected 4T1 cells from DBCP-induced cytotoxicity, supporting a synergistic cuproptosis-apoptosis mechanism. Additionally, pretreatment with N-acetyl-L-cysteine (NAC, oxidative stress inhibitor) significantly restored cell viability, indicating DBCP also induces cell death via enhanced oxidative damage [49]. HPLC analysis of 4T1 cell lysates following a 24-h incubation with DBCP confirmed the in situ formation of CuET. A characteristic CuET peak (elution time approximately 20 min) was observed exclusively in the DBCP-treated group, whereas no detectable signals were present in the DSF or DSF + BC groups (Fig. 4b), providing direct evidence of DBCP-specific chelation of DSF with copper ions for CuET synthesis. Western blot analysis further confirmed the involvement of apoptosis, which represents the primary anticancer mechanism of CuET. DBCP-treated cells exhibited increased expression of caspase-3 and decreased expression of Bcl-2. Compared with the PBS-, DSF-, BC-, and DSF + BC-treated groups, DBCP upregulated caspase-3 by 1.75-, 1.50-, 1.30-, and 1.21-fold, respectively, and downregulated Bcl-2 by 1.67-, 1.63-, 1.66-, and 1.66-fold (Figs. 4c–e).

We further investigated if DBCP induces cuproptosis via increased mitochondrial copper levels and enhanced copper-lipoylated DLAT interactions. ICP-MS quantification of mitochondrial copper in 4T1 cells (Fig. 4f) showed the DBCP group had 3.94-, 2.61-, 1.87-, and 1.83-fold higher accumulation than control, BC, DSF, and DSF + BC groups, respectively, indicating spatial-specific copper enrichment. Notably, the DSF + BC group showed no significant intracellular copper accumulation, as the two free components failed to achieve synchronous cellular internalization. In contrast, the Pickering emulsion structure of DBCP enabled efficient co-enrichment of DSF and Cu in cells by preventing premature extracellular inactivation and minimizing asynchronous intracellular diffusion of the components. Since cuproptosis is initiated by the binding of copper ions to lipoylated DLAT, which induces DLAT aggregation, immunofluorescence imaging assessed DLAT oligomerization (Fig. 4g). Minimal DLAT foci were observed in DSF-, BC-, and DSF + BC-treated cells, while DBCP-treated cells exhibited prominent foci indicative of abnormal oligomerization. Notably, TTM co-treatment abolished these foci, confirming copper-dependent DLAT aggregation. Western blot further revealed DBCP-treated cells had 1.49-, 1.42-, 1.43-, and 1.39-fold higher cuproptosis-related DLAT expression than control, DSF, BC, and DSF + BC groups (Figs. 4c and h). Notably, this DLAT upregulation and subsequent aggregation are tightly linked to the FDX1-dependent cuproptosis pathway, as supported by previous studies. FDX1 not only regulates DLAT lipoylation but also facilitates Cu+ transfer to lipoylated DLAT to induce aggregation, and FDX1 knockdown completely abrogates such copper-driven DLAT aggregation [50,51]. We will further confirm DBCP's effect on FDX1 expression in 4T1 cells via Western blot in follow-up studies. Subsequently, reactive oxygen species (ROS) levels were assessed using the fluorescent probe 2′, 7′-dichlorodihydrofluorescein diacetate (H2DCFDA) [52–54]. No detectable fluorescence was observed in the control, DSF, BC, or DSF + BC groups, whereas the DBCP group exhibited intense fluorescence signals (Fig. S18 in Supporting information). Mitochondrial membrane potential was evaluated using the JC-1 probe, which emits red fluorescence in polarized mitochondria and green fluorescence in depolarized mitochondria. DBCP-treated 4T1 cells displayed markedly reduced red fluorescence and pronounced green fluorescence (Fig. 4i), indicative of significant mitochondrial dysfunction, further confirmed by flow cytometric analysis (Fig. 4j). Collectively, these results confirm DBCP induces tumor cell death via the synergy of tumor-specific chemotherapy and cuproptosis.
Given DBCP's in vitro antitumor activity, its serum pharmacokinetics were evaluated via tail vein injection of DSF (free form) and DBCP in female Sprague-Dawley rats (DSF dose: 10 mg/kg). All the experiments were conducted in accordance with the guidelines of the principles of Experimental Animal Care (NIH) and approved by the Animal Care and Welfare Committee of Guizhou Medical University (approval No. 2400556). As depicted in Fig. 5a, both groups exhibited similar maximum DSF concentrations (Cmax: free DSF 8.80 µg/mL; DBCP 8.77 µg/mL; calculated according to the standard curve in Fig. S19 in Supporting information.). While drug concentrations declined gradually in both groups, DBCP showed a slower decrease, attributed to the Pickering emulsion's protective effect. Plasma concentration-time profiles, analyzed using PK Solver, indicated that DBCP followed a one-compartment model with monoexponential elimination. As illustrated in Table S3 (Supporting information), DBCP exhibited a 4.30-fold higher area under the curve (AUC) and 6.86-fold prolonged blood circulation half-life (t1/2) compared to free DSF. The extended systemic circulation is likely attributable to the presence of BSA in BSA-CuNCs, which may reduce reticuloendothelial system (RES)-mediated clearance by interfering with cell surface receptor recognition [55]. Additionally, the lipid barrier formed by the MCT core delayed drug burst release, thereby collectively enhancing the in vivo stability of DBCP [56].
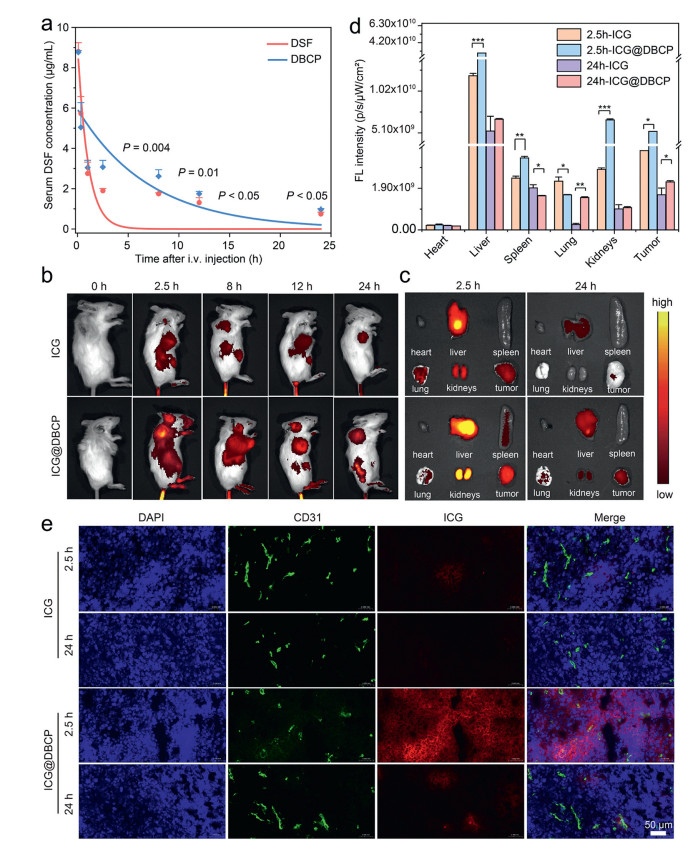
To examine DBCP's biodistribution, indocyanine green (ICG) was used as a fluorescent tracer [57,58]. BALB/c mice bearing 4T1 tumors were intravenously injected with ICG-loaded DBCP (ICG@DBCP) or free ICG (control), followed by in vivo fluorescence imaging via IVIS Spectrum at preset time points. As shown in Fig. 5b, ICG@DBCP exhibited significantly stronger tumor-site fluorescence than free ICG at all time points, with maximum signal intensity at 2.5 h post-injection. Ex vivo imaging and quantitative analysis of excised tumors and major organs (2.5 and 24 h post-administration) further confirmed ICG@DBCP's robust tumor-targeted accumulation (Figs. 5c and d) [59]. Notably, residual fluorescence in liver and kidney tissues at 24 h was markedly reduced, indicating effective metabolic clearance via hepatic and renal pathways. Fluorescence staining of tumor sections (Fig. 5e) provided corroborating evidence. free ICG showed weak red fluorescence in tumors, while ICG@DBCP exhibited intense red fluorescence and extensive extravascular distribution in tumor parenchyma, collectively demonstrating DBCP's superior tumor-targeting capability.
Inspired by the in vitro chemo-cuproptosis synergistic antitumor effects of DBCP, we evaluated its in vivo therapeutic efficacy. 4T1 tumor-bearing mice were randomly divided into six groups and administered intravenous injections of normal saline, DSF, BCP, BCP + DSF, 5-fluorouracil (5-Fu), or DBCP every two days (Fig. 6a) [39,60,61]. After 14 days of treatment, rapid tumor volume progression was observed in the saline, DSF, BCP, and BCP + DSF groups. In contrast, 5-Fu suppressed tumor growth, while DBCP exhibited more pronounced suppression (Figs. 6b and c and Fig. S20 in Supporting information). Notably, DBCP group had significantly smaller tumor weights: average tumor weight was only 14.6%, 15.8%, 21.2%, and 47.6% of that in DSF, BCP, BCP + DSF, and 5-Fu groups, respectively (Fig. 6d). Correspondingly, DBCP's tumor inhibition rate significantly increased to 74.41% (Fig. 6e), markedly higher than DSF (17.33%), BCP (18.70%), BCP + DSF (23.33%), and 5-Fu (52.67%) groups. To further explore each group's therapeutic efficacy, tumor tissues were collected for hematoxylin and eosin (H&E) and terminal deoxynucleotidyl transferase (TdT) dUTP nick-end labeling (TUNEL) staining (Fig. 6f). H&E staining showed no significant necrosis in saline, DSF, BCP, or BCP + DSF groups; in contrast, 5-Fu and DBCP groups exhibited distinct necrotic regions, with DBCP showing more prominent nuclear dissolution, fragmentation, and tissue lysis than other groups. TUNEL staining further confirmed that DBCP group had the highest degree of chromatin condensation and nuclear fragmentation in tumor cells.
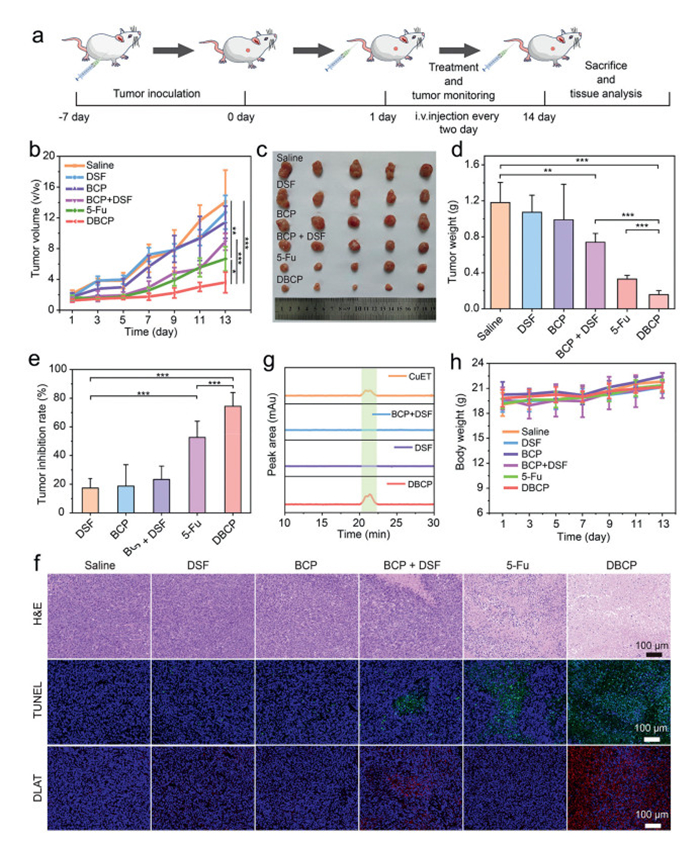
To validate DBCP's in vivo antitumor mechanism, immunofluorescence analysis was performed to assess DLAT expression levels in tumor tissues. Consistent with in vitro results, tumor sections from DBCP-treated mice showed the highest DLAT protein aggregation among all groups, thereby confirming the copper-dependent cell death mechanism observed in vitro. This in vivo DLAT aggregation further supports its association with FDX1-mediated cuproptosis. In follow-up studies, we will supplement tumor tissue immunofluorescence staining for FDX1 to visualize its expression and spatial distribution in DBCP-treated tumors, which will help verify the interplay between FDX1 and DLAT aggregation in the in vivo context. ICP-MS analysis revealed significant copper accumulation in the DBCP group (20.8 µg/g), which was 10.3-, 10.1-, and 7.1-fold higher than that in the saline group (2.01 µg/g), BCP group (2.05 µg/g), and BCP + DSF group (2.95 µg/g), respectively (Fig. S21 in Supporting information). This was attributed to DBCP's ability to release DSF/Cu+ in response to the tumor microenvironment, enabling the in situ production of highly cytotoxic CuET (Fig. 6g).
DBCP's biosafety was evaluated via body weight monitoring and H&E staining of major organs (heart, liver, spleen, lung, kidney) to assess tissue damage. During treatment, body weights remained stable across all groups (Fig. 6h), and no pathological abnormalities were detected in DBCP-treated mice's major organs (Fig. S22 in Supporting information). Serum biochemical analysis revealed that liver function markers, including alanine transaminase (ALT) and aspartate aminotransferase (AST), as well as the renal function indicator creatinine (CREA), remained within normal reference ranges in DBCP-treated mice (Fig. S23 in Supporting information), further supporting the favorable biosafety profile of the treatment. Although uric acid (UA) levels were slightly elevated above the normal range, this deviation was similarly observed in the control group, suggesting that it may be attributable to dietary influences or environmental factors such as low temperature rather than DBCP exposure [62]. Collectively, these results demonstrated that DBCP adopts a translation-oriented design strategy, integrating FDA-approved components and scalable preparation processes, and innovatively combining chemotherapy with cuproptosis induction mechanisms. It achieves DSF-copper spatial separation via Pickering emulsion technology. This enables in situ CuET formation in tumor cells and efficient mitochondrial copper accumulation, while the mechanism balances therapeutic efficacy and biosafety through dual synergy.
In summary, we develop a BSA-CuNCs-stabilized spatial-isolated oil-water biphasic Pickering emulsion (DBCP) that overcomes DSF/Cu instability through phase-separated co-delivery, enabling enhanced chemo-cuproptosis synergistic therapy. This innovative formulation achieves strict spatial segregation by encapsulating lipophilic DSF in the oil phase and chelating hydrophilic Cu2+ in the BSA-based emulsifier layer at the oil-water interface, effectively blocking their premature interaction. Endowed with EPR effect and BSA-mediated active targeting, DBCP accumulates specifically in tumor tissues. Upon cellular uptake, pH/GSH dual stimulation triggers synchronous release of DSF and Cu, which induce tumor-specific in situ generation of cytotoxic CuET, catalyze Cu+-initiated Fenton-like reaction for chemotherapy, and induce cuproptosis via mitochondrial copper accumulation and DLAT binding, ultimately synergistically enhancing antitumor efficacy. In vitro, DBCP showed significantly stronger 4T1 cell-killing efficacy: at 1.0 µmol/L DSF, cell survival dropped to 35.7 ± 2.6%, much lower than the > 85% survival in DSF, BC, and DSF + BC groups. In vivo, DBCP had a longer half-life (4.73 ± 0.54 h) than free DSF (0.69 ± 0.01 h); at 10 mg/kg (equivalent dose), it inhibited 4T1 tumor growth more effectively than positive control 5-Fu (TIR = 52.67%), achieving a TIR of 74.41% with no obvious toxicity. Overall, this spatial-isolated DSF/Cu co-delivery Pickering emulsion provides a novel, promising strategy for DSF repurposing and clinical translation, and may drive breakthroughs in DSF/Cu co-delivery nanosystems for cancer therapy.
Ying Chen: Writing – review & editing, Writing – original draft, Software, Project administration, Methodology, Investigation, Funding acquisition, Formal analysis, Conceptualization. Jun Zhang: Writing – review & editing, Writing – original draft, Validation, Methodology, Investigation, Formal analysis, Data curation. Haoran Ye: Software, Resources. Shengli Shen: Resources. Junyu Wang: Methodology, Formal analysis. Juan Wang: Software, Methodology. Xintong Li: Methodology. Xinghong Luo: Resources, Methodology. Ling Tao: Methodology. Wenchuang (Walter) Hu: Resources, Methodology. Xiangchun Shen: Visualization, Validation, Supervision, Project administration, Funding acquisition. Yongchao Yao: Methodology, Writing – review & editing.
We declare that all authors have no known competing financial interests or personal relationships that could have appeared to influence the work reported in this paper.
This work was supported by the National Natural Science Foundation of China (Nos. 82304404 and 32560230), the Guizhou Provincial Basic Research Program (Natural Science, Nos. ZK[2023]303 and MS[2025]564), the Cultivation Project of National Natural Science Foundation of Guizhou Medical University (No. 24NSFCP05), the College Students Innovation and Entrepreneurship Training Program (262520310), the High Level Innovation Talents (No. GCC[2023]048), and the Guizhou Provincial Department of Education (No. QJJ[2025]017). We are grateful for the platform support furnished by the Laboratory Animal Engineering Technology Center of Guizhou Province. The texts in this paper are polished and significantly improved by Stork's Writing Assistant (
Supplementary material associated with this article can be found, in the online version, at doi:
M. Zhang, X. Chen, N. Radacsi, J. Control. Release 329 (2021) 96–120. doi: 10.1016/j.jconrel.2020.11.047
Y. Xia, M. Sun, H. Huang, W. Jin, Signal Transduct. Target. Ther. 9 (2024) 92. doi: 10.3846/tede.2024.22088
S. Pushpakom, F. Iorio, P.A. Eyers, et al., Nat. Rev. Drug. Dis. 18 (2019) 41–58. doi: 10.1038/nrd.2018.168
P. Zhao, X. Tang, Y. Huang, View 2 (2021) 20200127. doi: 10.1002/VIW.20200127
Z. Skrott, M. Mistrik, K.K. Andersen, et al., Nature 552 (2017) 194–199. doi: 10.1038/nature25016
B. Zhao, F. Ban, Y. Li, et al., Cell Death Dis. 16 (2025) 482. doi: 10.1038/s41419-025-07766-y
Z. Huang, Y. Luo, T. Zhang, et al., Angew. Chem. 61 (2022) e202203500. doi: 10.1002/anie.202203500
W. Zhao, H. Li, S. Sun, Y. Xu, J. Mater. Chem. B 11 (2023) 11044–11051. doi: 10.1039/d3tb01564e
Y. Lu, Q. Pan, W. Gao, et al., Biomaterials 281 (2022) 121335. doi: 10.1016/j.biomaterials.2021.121335
J. Zhou, Q. Yu, J. Song, et al., Angew. Chem. 135 (2023) e202213922. doi: 10.1002/ange.202213922
L. Yang, C. Yao, Z. Su, et al., Bioact. Mater. 36 (2024) 96–111. doi: 10.3390/fermentation10020096
Z. Guo, X. Gao, J. Lu, et al., ACS Nano 18 (2024) 6975–6989. doi: 10.1021/acsnano.3c10173
H. Hu, W. Zhang, L. Lei, et al., Chin. Chem. Lett. 35 (2024) 108765. doi: 10.1016/j.cclet.2023.108765
Y. Zhang, S. Ding, J. Li, et al., Chin. Chem. Lett. 31 (2020) 3168–3172. doi: 10.1016/j.cclet.2020.04.051
J.B. Mandell, N. Douglas, V. Ukani, et al., Cancer Res. 80 (2020) 345. doi: 10.1158/1538-7445.am2020-345
Z. Zhou, C. Zhou, J. Liu, et al., J. Nanobiotechnol. 22 (2024) 612. doi: 10.1186/s12951-024-02825-6
W. Wu, L. Yu, Q. Jiang, et al., J. Am. Chem. Soc. 141 (2019) 11531–11539. doi: 10.1021/jacs.9b03503
Y. Du, T. Song, J. Wu, et al., Biomaterials 280 (2022) 121313. doi: 10.1016/j.biomaterials.2021.121313
C. Ye, J. Zhang, J. Shen, et al., Chin. Chem. Lett. 36 (2025) 110519. doi: 10.1016/j.cclet.2024.110519
T. Liu, Y. Chen, Y. Wang, X. Wang, J. Zheng, Food Hydrocoll. 166 (2025) 111294. doi: 10.1016/j.foodhyd.2025.111294
W. Han, F. Liu, Y. Li, et al., Small 19 (2023) 2301670. doi: 10.1002/smll.202301670
S. Lamichhane, S. Lee, Arc. Pharm. Res. 43 (2020) 118–133. doi: 10.1007/s12272-020-01204-7
S. Fu, H. Chen, W. Yang, et al., Nano Lett. 22 (2022) 4519–4527. doi: 10.1021/acs.nanolett.2c01334
W. Ceelen, L. Sandra, L.V. d. Sande, et al., EBioMedicine 82 (2022) 104151. doi: 10.1016/j.ebiom.2022.104151
S.H. Ali, G.M. Sulaiman, M.M.F. Al-Halbosiy, M.S. Jabir, A.H. Hameed, Artif. Cells Nanomed. Biotechnol. 47 (2019) 378–394. doi: 10.1080/21691401.2018.1559175
S. Jahan, M.E. Karim, E.H. Chowdhury, Biomedicines 9 (2021) 114. doi: 10.3390/biomedicines9020114
M.P. Nikolova, E.M. Kumar, M.S. Chavali, Pharmaceutics 14 (2022) 2195. doi: 10.3390/pharmaceutics14102195
Y. Zhong, J. Zhu, Q. Wang, et al., Microchim. Acta 182 (2015) 909–915. doi: 10.1007/s00604-014-1407-2
A. Akhuli, D. Chakraborty, A.K. Agrawal, M. Sarkar, Langmuir 37 (2021) 1823–1837. doi: 10.1021/acs.langmuir.0c03176
X. Liu, Q. Min, Y. Li, S. Chen, Biomater. Res. 28 (2024) 0096. doi: 10.34133/bmr.0096
R.S. Aparna, J.S.A. Devi, R.R. Anjana, J. Nebu, S. George, Analyst 144 (2019) 1799–1808. doi: 10.1039/c8an01703d
B. Kong, Y. Cao, Y. Yu, S. Zhao, Microchem. J. 159 (2020) 105388. doi: 10.1016/j.microc.2020.105388
X. Wang, Q. Chen, Y. Zhu, et al., Signal Transduct. Target. Ther. 8 (2023) 277. doi: 10.1038/s41392-023-01491-8
B. Zhang, Z. Liu, R. Zhang, Q. Yao, J. Xie, ACS Nano 19 (2025) 3997–4010. doi: 10.1021/acsnano.4c15366
R. Sarangi, S.I. Gorelsky, L. Basumallick, et al., J. Am. Chem. Soc. 130 (2008) 3866–3877. doi: 10.1021/ja076495a
T. Zhou, W. Xu, Q. Yao, T. Zhao, X. Chen, Methods Appl. Fluoresc. 3 (2015) 044002. doi: 10.1088/2050-6120/3/4/044002
C. Wu, M. Yin, S. O'Brien, J.T. Koberstein, Chem. Mater. 18 (2006) 6054–6058. doi: 10.1021/cm061596d
S. Wang, J. Wang, J. Zhang, et al., Int. J. Biol. Macromol. 258 (2024) 128093. doi: 10.1016/j.ijbiomac.2023.128093
Y. Chen, S. Wang, Q. Ma, et al., J. Control. Release 354 (2023) 523–537. doi: 10.1016/j.jconrel.2023.01.035
X. Liu, Y. Fei, B. Cui, et al., Collagen Leather 7 (2025) 28. doi: 10.1186/s42825-025-00210-z
C. Wang, C. Wang, L. Xu, et al., Nanoscale 6 (2014) 1775–1781. doi: 10.1039/C3NR04835G
R. He, Q. Wang, B. Li, et al., Chin. J. Anal. Chem. 48 (2020) 197–205. doi: 10.1016/S1872-2040(19)61216-8
S. Huang, Z. Xu, W. Zhi, et al., J. Nanobiotechnol. 22 (2024) 324. doi: 10.3390/batteries10090324
S. Li, Q. Wang, C. Su, et al., Mater. Today Bio 33 (2025) 102030. doi: 10.1016/j.mtbio.2025.102030
J. Wang, Q. Zhang, Y. Li, et al., Chin. Chem. Lett. 35 (2024) 108746. doi: 10.1016/j.cclet.2023.108746
X. Xi, X. Wang, Z. Xi, et al., Chin. Chem. Lett. 36 (2025) 110773. doi: 10.1016/j.cclet.2024.110773
F. Mo, C. Wang, S. Li, et al., Adv. Mater. 36 (2024) 2405761. doi: 10.1002/adma.202405761
J. Yang, Y. He, M. Zhang, et al., Exploration 3 (2023) 20230061. doi: 10.1002/EXP.20230061
W. Xu, Y. Wang, G. Hou, et al., Adv. Healthc. Mater. 12 (2023) 2202949. doi: 10.1002/adhm.202202949
Y. Liao, D. Wang, C. Gu, et al., Nat. Nanotechnol. 19 (2024) 1892–1902. doi: 10.1038/s41565-024-01784-1
T. Peter, C. Shannon, P. Boryana, et al., Science 375 (2022) 1254–1261. doi: 10.1126/science.abf0529
C. Yang, X. Liao, K. Zhou, et al., Bioact. Mater. 48 (2025) 1–17.
L. Zhang, X. Qian, Y. Yang, et al., Nano Biomed. Eng. 17 (2025) 277–286. doi: 10.26599/NBE.2024.9290105
C. Huang, Z. Liu, L. Zhao, et al., Chin. Chem. Lett. 35 (2024) 109696. doi: 10.1016/j.cclet.2024.109696
K. Wang, J. Shang, C. Tao, et al., Int. J. Nanomed. 19 (2024) 14075–14103. doi: 10.2147/ijn.s493489
D. Chu, J. Gao, Z. Wang, ACS Nano 9 (2015) 11800–11811. doi: 10.1021/acsnano.5b05583
J. Wang, J. Wang, J. Zhang, et al., Int. J. Biol. Macromol. 308 (2025) 142535. doi: 10.1016/j.ijbiomac.2025.142535
L. Zhao, C. Huang, R. Zheng, et al., MedComm Biomater. Appl. 4 (2025) e70024.
J. Huang, R. Kong, Y. Li, et al., Chin. Chem. Lett. 35 (2024) 109254. doi: 10.1016/j.cclet.2023.109254
Y. Chen, J. Wang, Y. Zheng, et al., Small 21 (2025) e01259. doi: 10.1002/smll.202501259
Y. Chen, Z. Yang, S. Wang, et al., Adv. Healthc. Mater. 12 (2023) 2202150. doi: 10.1002/adhm.202202150
J. Lu, N. Dalbeth, H. Yin, et al., Nat. Rev. Rheumatol. 15 (2019) 413–426. doi: 10.1038/s41584-019-0222-x

Figure 1 Schematic illustration of BSA-CuNCs-stabilized spatial-isolated oil-water biphasic Pickering emulsion (DBCP) for inhibiting premature DSF/Cu interaction and enhancing chemo-cuproptosis synergy.

Figure 2 Preparation and characterization of BC, BCP and DBCP. (a) Distribution of the hydrodynamic diameter of BC in water determined by DLS. The inset showed the photograph of BC solution irradiated with a continuous laser. (b) TEM image of the BC. Scale bar: 50 nm. (c) FTIR spectra of the BSA and BC. (d) XPS spectrum of Cu 2p in BC. (e) Representative imaging results of BCP morphology captured by optical microscopy. Scale bar: 5 µm. (f) Distribution of the hydrodynamic diameter of BCP in water determined by DLS. (g) TEM image of the BCP. Scale bar: 100 nm. (h) Representative fluorescence micrograph of C6- and RhB-tagged BCP. Scale bar: 5 µm. (i) Variations in size and PDI of BCP when diluted to different concentrations. (j) Variations in size and PDI of BCP after incubation with 10% fetal bovine serum (FBS) at 37 ℃ over a 72 h period. (k) The pH/GSH dual-responsive release profiles of DSF from DBCP under various conditions. Data are shown as mean ± SD (n = 3).

Figure 3 Cellular uptake and cytotoxicity evaluation. (a) Fluorescent images of 4T1 cells cultured with DiI@DBCP for 0.5, 1, and 3 h. Scale bar: 100 µm. (b) Quantitative analysis of the cellular uptake of DiI@DBCP at 0.5, 1, and 3 h by flow cytometry. (c) Viabilities of 4T1 cells after treatment with different concentrations of DBCP, BC, DSF, and DSF + BC for 24 h, respectively. (d) Live/dead cell staining micrographs of 4T1 cells after different treatments. Green fluorescence indicates viable cells, while red fluorescence indicates dead cells. Scale bar: 100 µm. (e) Flow cytometry analysis of Annexin Ⅴ-fluorescein isothiocyanate/propidium iodide (FITC/PI)-stained 4T1 cells after 24 h of different treatments. Data are shown as mean ± SD (n = 3). *P < 0.05, **P < 0.01, ***P < 0.001.

Figure 4 Mechanism underlying DBCP-induced cell death in vitro. (a) Viabilities of 4T1 cells pre-treated with TTM, UK5099, Fer-1, Z-VAD-FMK, Nec-1, and NAC, subsequently exposed to DBCP. (b) HPLC chromatograms showing CuET generation situation in 4T1 cells treated with DSF, DSF + BC, or DBCP, compared with the standard CuET control. (c) Western blot assay was performed to detect the expression levels of caspase-3, Bcl2, and DLAT in 4T1 cells following various treatments. (d, e) Quantitative analysis of the protein ratios of caspase-3 (d) and Bcl2 (e) relative to β-actin in Fig. 4c, conducted with Image J software. (f) Quantitative analysis of the mitochondrial copper ion levels in 4T1 cells treated with PBS, BC, DSF, DSF + BC or DBCP using ICP-MS method. (g) Immunofluorescence images of DLAT in 4T1 cells after incubation with PBS, DSF, BC, DSF + BC, DBCP or DBCP + TTM for 24 h. Scale bar: 20 µm. (h) Quantitation analysis of the protein ratios of DLAT to β-actin in Fig. 4c using Image J software. (i) Fluorescent images and (j) flow cytometry analysis of JC-1-stained 4T1 cells after different treatments. Scale bar: 50 µm. Data are shown as mean ± SD (n = 3). *P < 0.05, **P < 0.01, ***P < 0.001.

Figure 5 Pharmacokinetic investigation and biodistribution analysis of DBCP. (a) Pharmacokinetic profiles following a single intravenous injection of free DSF and DBCP in female Sprague-Dawley rats ([DSF] = 10 mg/kg, n = 3). (b) In vivo fluorescence imaging of ICG and ICG & DBCP at different time points ([ICG] = 1.0 mg/kg, n = 3). (c) Ex vivo fluorescence imaging of different organs and tumor tissue at 2.5 and 24 h post-administration. (d) Quantitative assessment of the fluorescent signal intensity in tumors and various organs. (e) Fluorescence micrographs of subcutaneous 4T1 tumor sections captured at 2.5 and 24 h after administration of ICG and ICG@DBCP (red fluorescence). The green fluorescence represents tumor vasculature, which was labeled with a CD31 antibody and then visualized via an Alexa Fluor 488-conjugated secondary antibody. Nuclei were counterstained with 4′, 6-diamidino-2-phenylindole dihydrochloride (DAPI), exhibiting blue fluorescence. Scale bar: 50 µm. Data are shown as mean ± SD (n = 3). *P < 0.05, **P < 0.01, ***P < 0.001.

Figure 6 In vivo antitumor assessment of DBCP. (a) Schematic representation of the treatment protocol for 4T1 tumor-bearing mice. (b) Changes in tumor volume over the 14-day treatment period. (c) Representative images of excised tumors. (d) Tumor weights on day 14 of the treatment. (e) Tumor inhibition rate (TIR) calculated after 14 days of treatment. (f) Histological analysis of tumor sections using H&E, TUNEL, and DLAT staining. Scale bars: 100 µm. (g) HPLC chromatograms demonstrating CuET formation in tumors from 4T1 tumor-bearing mice following treatment with DSF, BCP + DSF, or DBCP, in comparison to the CuET standard. (h) Body weight variations observed in mice during the 14-day treatment period. Data are shown as mean ± SD (n = 5). *P < 0.05, **P < 0.01, ***P < 0.001.

 扫一扫看文章


扫一扫关注我们
 DownLoad:
 下载:
 下载: