School of School of Energy and Chemical Engineering, Luoyang Institute of Science and Technology, Luoyang 471023, China
b.
Key Laboratory of Dielectric and Electrolyte Functional Material Hebei Province, School of Resources and Materials, Northeastern University at Qinhuangdao, Qinhuangdao 066004, China
c.
Henan Province International Joint Laboratory of Materials for Solar Energy Conversion and Lithium Sodium based Battery, Luoyang 471023, China
Received Date:
06 October 2025 Accepted Date:
26 November 2025 Revised Date:
21 November 2025 Available Online:
15 October 2026
Abstract:
Aqueous zinc batteries tend to be safe, low-cost, and environmentally friendly. An aqueous cell coupling zinc metal anode and polyanion cathode provides high voltage. However, water-induced side reactions on zinc electrodes, as well as the decomposition of polyanionic cathode, limit the stability of the system. The application of water-in-salt (WiS) electrolytes offers a viable alternative. However, the solubility of conventional zinc salts with weak acidity is low. Herein, we increased the concentration of Zn(OTf)2 to 10 m (mol/kgwater) by introducing saturated betaine (BT) as a cosolvent. In the 10 m Zn(OTf)2/13 m BT electrolyte, the high salt concentration and the interactions between betaine and water effectively lower water activity. Moreover, betaine participates in the solvation structure of zinc ions, facilitating the formation of protective interphases on both the zinc anode and the Li3V2(PO4)3 cathode, thereby suppressing side reactions and cathode decomposition. As a result, the electrolyte enables reversible Zn plating/stripping over 2900 h. The Li3V2(PO4)3 cathode also maintains two pairs of redox reactions at high voltage of 1.8 V/1.7 V and 1.4 V/1.3 V, demonstrating excellent rate capability and stable cycling performance.
Rechargeable aqueous batteries provide the advantages of good safety, environmentally benign and low cost [1,2]. Zinc metal is a desirable anode for aqueous systems with low redox potential, high theoretical capacity and good stripping/plating kinetics. However, side reactions such as hydrogen evolution reaction (HER) would take place on the zinc anode [3,4]. Reducing water activity in electrolytes is required to improve stability [5]. On the other hand, the decreasing of water activity is also conducive to expanding the electrochemical stability window. Nevertheless, the application of water-in-salt (WiS) electrolytes provides a feasible solution. Electrolytes such as 21 m (mol/kgwater) LiTFSI, 17 m NaClO4, and 30 m CH3COOK have been demonstrated for Li-ion, Na-ion and K-ion aqueous cells, respectively [6–8]. For the zinc system, Ji and colleagues show that the 30 m ZnCl2 WiS electrolyte significantly improves the coulombic efficiency of Zn2+/Zn redox reactions [9]. Wang et al. proposed a 20 m LiTFSI + 1 m ZnTFSI2 mixed aqueous electrolyte, which delivers reversible and dendrite-free Zn plating/stripping [10].
Manganese oxide [11–13], vanadium oxide [13–15], polyanion compounds [15–21], and organic compounds [22–25] have been investigated as cathode materials for zinc batteries. Among them, polyanion materials can provide high voltage owing to the inductive effectof polyanion XO4 (X = P, S, W, etc.), where the strong polarization of electrons on O towards X decreases the covalent character of metal-oxygen bonds and increases the redox potential of transition metals [26]. However, polyanion compounds are prone to losing polyanion when cycling in aqueous zinc batteries, which causes the decay of redox voltage [27–31]. Notably, the use of WiS has a remarkable effect on inhibiting the decomposition of polyanionic cathode materials. For example, Chen et al. studied VOPO4 material in 21 m LiTFSI + 1 m Zn(OTF)2 electrolyte zinc battery to achieve a stable 1.56 V discharge voltage [32]. Ji and co-workers reported Na3V2(PO4)2O2F in a neutral WIS of 25 m ZnCl2 and 5 m NH4Cl performed well electrochemically [33]. Nevertheless, the water-in-salt electrolytes present a viable approach to enhancing the electrochemical performance of both the cathode and zinc anode in Aqueous zinc batteries. Unfortunately, It is clear that ZnCl2 is the only high-concentration zinc salt without the addition of other ions. The high concentration of ZnCl2 dissolved in water to form acid H[ZnCl2(OH)] greatly increased corrosion, while chloride ions also limited the high operating potential [34]. These findings hinder the further exploration of aqueous zinc batteries. Therefore, it is urgent to develop a widely used ultra-concentrated zinc electrolyte without introducing other cations.
An alternative strategy to increase zinc salt concentration is to introduce organic molecules into water as a cosolvent. For example, Nazar and his colleagues designed a PEG-based hybrid electrolyte to regulate Zn2+ solvation structure, achieving a highly reversible zinc anode and maximizing the Zn2+ intercalation into the Li3V2(PO4)3 cathode [29]. Additionally, in our previous work, we introduced the organic solvent acetamide into water as a co-solvent for the Zn(OTf)2, resulting in a hybrid electrolyte that effectively prevented the development of side reactions on the zinc anode and the degradation of the Li3V2(PO4)3 cathode [30].
Inspired by the above results, what brings us to mind is adding organic solvent or increasing salt concentration can further reduce the activity of water and regulate the solvation structure of Zn2+. Herein, we developed a novel electrolyte system that enhances the solubility of Zn(OTf)2 to 10 m through the incorporation of 13 m of betaine into 1 kg of water. The addition of betaine and the increase of salt concentration greatly reduced the activity of water and changed the solvation structure of zinc. This electrolyte has demonstrated a great ability to form protective films on both the surface of the Zn anode and high voltage cathode through anion decomposition during the cycle. The Zn electrode achieves stable plating/stripping for over 2900 h in the 10 m Zn(OTf)2/13 m BT. The coulombic efficiency enhances from 85% to 99%. In addition, Benefiting from the stable protective layer formed on the cathode, the decomposition of Li3V2(PO4)3 is effectively inhibited, and the cathode realizes excellent stabilities of both voltage and capacity upon cycling.
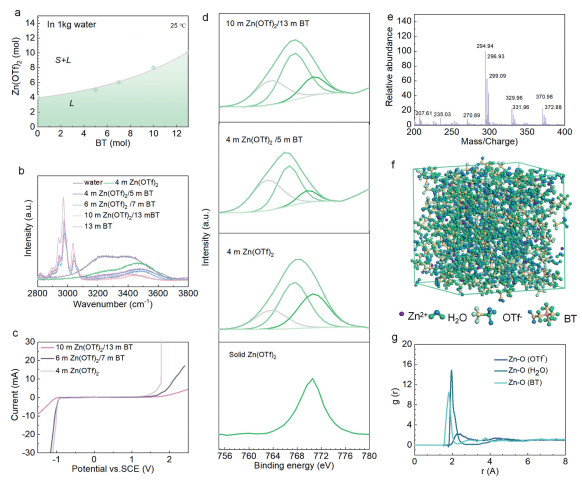
Fig. 1a shows the variations in solubility of zinc salt with the addition of various amounts of betaine to 1 kg of water. The solubility of Zn(OTf)2 is increased from 4, 5 m to 10 m as the concentration of betaine increased from 0, 4, 7 m, and until saturation, respectively. These electrolytes are labeled as 4 m Zn(OTf)2, 4 m Zn(OTf)2/5 m BT, 6 m Zn(OTf)2/7 m BT and 10 m Zn(OTf)2/13 m BT based on the concentration of betaine and Zn(OTf)2 in water, respectively. Fig. 1b shows the Raman spectra of zinc salts at various concentrations coupled with betaine and saturated betaine in aqueous solutions. In the solution containing betaine, the C—H vibration occurs between 2800 cm-1 and 3000 cm-1, while the O—H vibration occurs above 3000 cm-1. The strength of the O—H signal diminishes with increasing salt concentration, indicating decreasing water activity. In addition, the O—H signal peak further decreased after betaine was added to the 4 m Zn(OTf)2 solution, suggesting that the carboxyl group on betaine was a part of the water’s H-bonding network [35]. With the 10 m Zn(OTf)2/13 m BT solution, water activity would therefore be minimized, in response to the high salt concentration and the formation of hydrogen bonds between betaine and water. Additionally, the electrochemical stability window (ESW) exhibits a strong dependence on water activity within the electrolyte system. To systematically investigate this relationship, we employed three distinct electrolyte formulations for linear sweep voltammetry (LSV) measurements: A baseline 4 m Zn(OTf)2 solution, a moderately concentrated electrolyte comprising 6 m Zn(OTf)2 with 7 m BT additive, and a highly concentrated system containing 10 m Zn(OTf)2 paired with 13 m BT (Fig. 1c). With the 4 m Zn(OTf)2 electrolyte, the ESW was only 2.2 V. As the electrolyte concentration increased, the ESW expanded to 2.5 V in the 6 m Zn(OTf)2/7 m BT electrolyte. Importantly, with the 10 m Zn(OTf)2/13 m BT electrolyte, the ESW further increased to 2.9 V. The wider ESW provides the possibility for the use of high-voltage cathode materials.
Figure 1
Figure 1.
(a) Phase diagram of the solubility changes of Zn(OTf)2 in 1 kg of water with increasing BT content. (b) Raman spectra of water 4 m Zn(OTf)2, 4 m Zn(OTf)2/5 m BT, 6 m Zn(OTf)2/7 m BT, 10 m Zn(OTf)2/13 m BT and 13 m BT solutions. (c) LSV curves of three solutions. (d) Fitted Raman spectra of solid Zn(OTf)2 and three solutions. (e) Ionic high resolution mass spectra (HRMS) of 10 m Zn(OTf)2/13 m BT solution. (f) The MD simulation snapshot of the 10 m Zn(OTf)2/13 m BT electrolyte. (g) RDFs for Zn2+-O(H2O), Zn2+-O(OTf−), and Zn2+-O(BT) pairs in the 10 m Zn(OTf)2/13 m BT electrolyte.
Fig. 1d shows the non-negligible variation of the Raman band at 750 to 780 cm-1 in the three electrolytes. Further fitting of the band according to previous reports reveals the degree of anion dispersion, in which three sub-peaks of 763.6, 767.6, and 770.5 cm-1 correspond to free anions (FAs)-(#Zn2+ = 0), loose ion pairs (LIPs)-(#Zn2+ = 1), and intimate ion pairs (IIPs)-(#Zn2+ = 2), respectively [36]. With the 4 m Zn(OTf)2 solution, the anions are mainly in the form of IIPs and LIPs. With the addition of 5 m BT molecules, Zn(OTf)2 is diluted and OTf- primarily exists in the form of FAs and LIPS, indicating that the addition of betaine can further disperse the solute and participate in the solvation structure of zinc ions, resulting in an increase in the solubility of zinc salts in aqueous solution. Thus, adding saturated betaine (13 m BT) increases the solubility of Zn(OTf)2 up to 10 m. With the 10 m Zn(OTf)2/13 m BT, the percentage of LIPS rises according to the rise in salt concentration, suggesting that betaine replaces water to improve the solvation structure of Zn2+. Fig. 1e shows the high-resolution mass spectrometric (HRMS) of the 10 m Zn(OTf)2/13 m BT electrolyte, where a prominent peak centered at around m/z = 295 is assigned to the [Zn(BT)2]2+ complexes. The results further confirmed the betaine-induced solvation restructuring through competitive ligand displacement, where BT molecules progressively replace water molecules in primary coordination of Zn2+.
Molecular dynamics (MD) simulations further revealed the solvation structure of Zn2+ in the 10 m Zn(OTf)2/13 m BT electrolyte (Figs. 1f and g). Radial distribution functions (RDFs), which characterize the distribution of nearest-neighbor molecules, are used to interpret the solvation environment in the electrolyte. In the 10 m Zn(OTf)2/13 m BT electrolyte, the peaks located at 2.32, 1.95, and 1.79 Å, corresponding to Zn-O(OTf-), Zn-O(H2O), and Zn-O(BT), respectively, further demonstrating the layered solvation structure around Zn2+. These results confirm that BT can replace water molecules to enter the solvation layer of Zn2+.
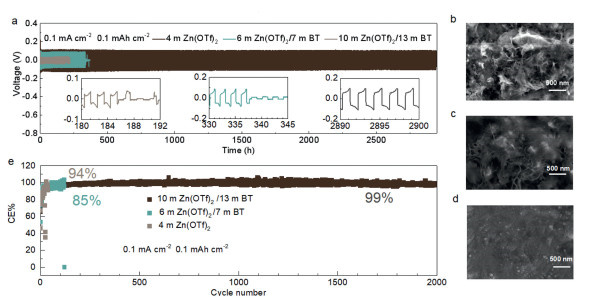
The Zn plating/stripping manners in the aqueous electrolyte of 4 m Zn(OTf)2, 6 m Zn(OTf)2/7 m BT and 10 m Zn(OTf)2/13 m BT is investigated. Fig. 2a shows the Zn plating-stripping behavior in symmetrical Zn||Zn cells with a current density of 0.1 mA/cm2 and capacity of 0.1 mAh/cm2. The cell shorts out in the 4 m Zn(OTf)2 electrolyte after around 54 h. The cycle life is increased to 400 h in the 6 m Zn(OTf)2/7 m BT electrolyte. In contrast, the 10 m Zn(OTf)2/13 m BT electrolyte enables stable cycling for over 2900 h. Figs. 2b–d show scanning electron microscope (SEM) images of the Zn electrode after 20 cycles with current density of 0.1 mA/cm2 and 0.1 mAh/cm2 in symmetric cells. The surface of Zn electrode displays platelet morphology in both the 4 m Zn(OTf)2 and 6 m Zn(OTf)2/7 m BT electrolytes. Meanwhile, the Zn surface becomes flat with the 10 m Zn(OTf)2/13 m BT electrolyte, which suggests that the side reaction is effectively inhibited. The coulombic efficiencies (CE) are measured in Zn-Cu cells at 0.1 mA/cm2 and 0.1 mAh/cm2 for the three electrolytes (Fig. 2e). The one with 4 m Zn(OTf)2 electrolyte only runs for 52 cycles, with a stabilized CE of 85%. The stabilized CE and cycle life rise to 94% and 121 cycles, respectively, in 6 m Zn(OTf)2/7 m BT. Finally, the cell operates steadily for 1000 cycles with an enhanced CE of 99% in 10 m Zn(OTf)2/13 m BT electrolyte (Fig. S4 in Supporting information). The highest stripping-plating reversibility in the 10 m Zn(OTf)2/13 m BT electrolyte can be attributed to the suppressed side reactions of zinc electrode. In addition, the change of Zn2+solvation is conducive to the formation of a protective layer on the surface of the zinc electrode. To investigate the Zn/electrolyte interface, the surface environment of the zinc electrode in 10 m Zn(OTf)2/13 m BT electrolytes is examined after cycling by using XPS. The signals of ZnCO3, ZnS, and organic components are observed, which indicates the formation of a protective layer on the zinc surface (Fig. S1 in Supporting information). The formation of a protective layer can further isolate water and reduce the reaction between zinc anode and water, which increases the utilization rate of zinc anode.
Figure 2
Figure 2.
(a) Long-term Zn plating/stripping behaviors of symmetrical Zn cells with three electrolytes at 0.1 mA/cm2 and 0.1 mAh/cm2. SEM images of Zn electrodes after 50 cycles in (b) 4 m Zn(OTf)2, (c) 6 m Zn(OTf)2/7 m BT and (d) 10 m Zn(OTf)2/13 m BT electrolytes. (e) Coulombic efficiencies of Zn plating/stripping on the Cu substrate at 0.1 mA/cm2 and 0.1 mAh/cm2 in the three electrolytes.
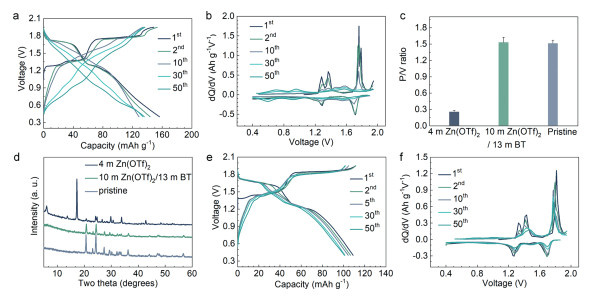
The electrolytes were then applied to zinc cells with a polyanion cathode of Li3V2(PO4)3. XRD demonstrates the high purity of the material, and SEM image shows the small particle size of around 100 nm (Figs. S2a and b in Supporting information). Thermogravimetric analysis (TGA) confirms that the material contains 3% carbon. (Fig. S3 in Supporting information). Figs. 3a and b show the voltage profiles and differential capacity curves of the Li3V2(PO4)3 cathode in the aqueous electrolyte of 4 m Zn(OTf)2. During the first two cycles, Li3V2(PO4)3 cathode shows major redox processes above 1.2 V. However, the voltage continuously decreases upon cycling. The evolution of differential capacity curves suggests the voltage change is associated with the decay of initial redox peaks at high voltage and the appearance of new peaks at around 1 and 0.6 V. The new redox peaks are characteristic of vanadium oxide. In accordance, the XRD pattern of the electrode after 50 cycles shows the disappearance Li3V2(PO4)3 diffractions, and energy dispersive X-ray spectroscopy (EDS) demonstrates the decreased P/V elemental ratio from 1.5 to 0.25 (Figs. 3c and d). Therefore, the Li3V2(PO4)3 material loses the polyanion when cycling in regular zinc aqueous electrolyte. The voltage decrease is caused by the loss of the inductive effect from polyanion.
Figure 3
Figure 3.
(a) Charge/discharge profiles (b) and associated differential capacity curves of the Li3V2(PO4)3 cathode cycled at 0.1 A/g cells with 4 m Zn(OTf)2 electrolytes. (c) EDS P/V ratios of the pristine Li3V2(PO4)3 and after cycling in the two electrolytes for 50 cycles. (d) XRD pattern of the Li3V2(PO4)3 cathode after 50 cycles in the two electrolytes. (e) Charge/discharge profiles and (f) associated differential capacity curves of the Li3V2(PO4)3 cathode cycled at 0.1 A/g cells with 10 m Zn(OTf)2/13 m BT electrolytes.
With the medium concentration of 6 m Zn(OTf)2/7 m BT electrolyte, The Li3V2(PO4)3 cathode exhibits slower voltage decay, but the capacity decay is still exist (Fig. S5 in Supporting information). Notably, with the 10 m Zn(OTf)2/13 m BT electrolyte, a good preservation of Li3V2(PO4)3 redox voltage and capacity is obtained over cycling (Figs. 3e and f). The high redox peak is consistently maintained at 1.8/1.7 V and 1.4/1.3 V, while the low voltage redox peaks are not observed. The XRD patterns of Li3V2(PO4)3 are well preserved, and the ratio of EDS P/V is maintained at 1.5 after 50 cycles (Figs. 3c and d). These results demonstrate the excellent stability of the polyanion cathode in the 10 m Zn(OTf)2/13 m BT electrolyte.
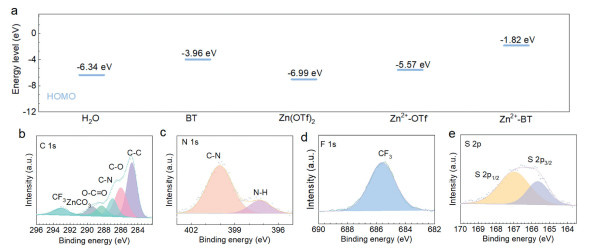
The HOMO levels of H2O, BT, Zn(OTf)2, Zn2+-OTf-, and Zn2+-BT are shown in Fig. 4a. The low HOMO levels for Zn(OTf)2 and H2O are −6.34 and −6.99 eV, suggesting high oxide stability [37]. Meanwhile, the HOMO levels of BT, Zn2+-OTf-, and Zn2+-BT are −3.96, −5.57, and −1.82 eV, respectively. It implies that the protective layers will be formed by the products from the decomposed of the BT, Zn2+-OTf- and Zn2+-BT at the cathode during charging to voltage [30,38,39]. XPS is used to study the surface environment of cycled Li3V2(PO4)3 cathode. CF3, ZnCO3, C═O, C—O, and C—C are used to fit the C 1s spectra (Fig. 4b). The C—O, C═O, and ZnCO3 components are ascribed contributes to the C—C peak. C—N and C—H are used to fit the N 1s spectrum, further confirming BT degradation pathways (Fig. 4c). In addition, the CF3 signal in the C 1s spectrum could be attributed to the PVDF binder and triflate salt. Similarly, the SO3 and CF3 peaks are fitted in the S 2p and F 1s spectra, respectively (Figs. 4d and e). This result suggests that the protective layer on the Li3V2(PO4)3 electrode originates from the decomposition products of Zn2+ solvation structures. Correspondingly, Fig. S6 (Supporting information) shows the SEM image of Li3V2(PO4)3 electrode at the fully charged state after 50 cycles. The active material has aggregated due to the coverage by a protective layer. The formation of this interfacial layer effectively enhances the stability of electrochemical performance.
Figure 4
Figure 4.
(a) Calculated frontier molecular orbital energy levels of H2O, BT, Zn(OTf)2, Zn2+-OTf- and Zn2+-BT. XPS spectral regions for (b) C 1s, (c) N 1s, (d) F 1s and (e) S 2p of the surface of Li3V2(PO4)3 after cycled 50 cycles, respectively.
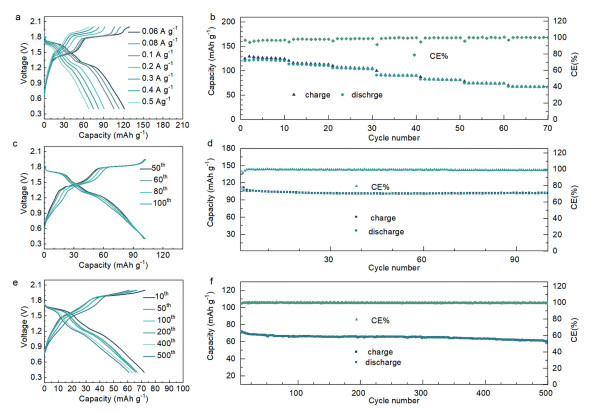
The electrochemical performance of Li3V2(PO4)3 in the 10 m Zn(OTf)2/13 m BT aqueous electrolyte is evaluated in further detail. Figs. 5a and b show the charge/discharge profiles and capacity evolution at various current densities. The electrode of Li3V2(PO4)3 delivers 122, 114, 106, 91, 83, 75 and 68 mAh/g capacities at 0.06, 0.08, 0.1, 0.2, 0.3, 0.4 and 0.5 A/g, respectively, with well stabilities under each condition. Significantly, the charge/discharge profiles clearly demonstrates that the voltage plateaus of Li3V2(PO4)3 are well-retained. Figs. 5c and d show the cycling stability at low rates and high rates respectively. The electrode exhibits a capacity retention of 102 mAh/g with well-preserved charge-discharge profiles (Figs. 5c and d). At a high current density of 0.5 A/g, the capacity of 72 mAh/g is achieved during the first cycle, which reduces slightly to 61 mAh/g after 500 cycles (Figs. 5e and f). The voltage profiles and differential capacity curves of Li3V2(PO4)3 at different cycles show the good preservation of redox plateaus at both high and low current densities, without any appearance of vanadium oxide redox processes. These results confirm the excellent cycling stability and rate performance of the polyanion cathode in the 10 m Zn(OTf)2/13 m BT electrolyte.
Figure 5
Figure 5.
The electrochemical performance of the Li3V2(PO4)3 cathode in the 10 m Zn(OTf)2/13 m BT electrolyte: (a) Charge-discharge curves and (b) capacities at different rates. (c) Xharge-discharge curves cycling stability at 0.1 A/g. (d) Charge-discharge curves and cycling stability at 0.1 A/g.
In conclusion, we successfully increased the solubility of Zn(OTf)2 by introducing saturated betaine into water. The high concentration of zinc salt, together with the hydrogen bond between the betaine carboxyl group and water, effectively suppressed the activity of water and expands the electrochemical stability window. Meanwhile, the addition of betaine altered the solvation structure of Zn2+, which can assist in the formation of the protective layer on the Zn metal anode and Li3V2(PO4)3 cathode, realizing the reversible Zn plating/stripping behavior and the high voltage stable cycle of Li3V2(PO4)3. Our work proposes an effective electrolyte engineering strategy to achieve synergistic stabilization of polyanionic cathodes and long-term cycling stability of Zn anodes in aqueous zinc-ion batteries, which can be applied to other related systems for promoting electrode stabilitie.
The authors declare that they have no known competing financial interests or personal relationships that could have appeared to influence the work reported in this paper.
Acknowledgments
This work was financially supported by Program for Innovative Research Team (in Science and Technology) in University of Henan Province (No. 23IRTSTHN009), the Project of Science and Technology Department of Henan Province (No. 252102240092), the Natural Science Foundation of Henan Province (Nos. 252300423720, 252300421725 and 242300420562), the Education Key Projects of Henan Provincial Department (Nos. 25A150040 and 25A530008), and the Luoyang Science and Technology Development Plan Project (No. 2302038A). The authors extend their gratitude to Mr. Gao Jilong (from Scientific Compass http://www.shiyanjia.com) for providing invaluable assistance with the XPS analysis.
Supplementary materials
Supplementary material associated with this article can be found, in the online version, at doi:10.1016/j.cclet.2025.112178.
K. Zhou, Gao. Liu, X. Yu, et al., J. Am. Chem. Soc. 146 (2024) 9455–9464. doi: 10.1021/jacs.4c02150
[39]
T. Qin, K. Li, Y. Liu, et al., Adv. Energy Mater. 13 (2023) 2300733. doi: 10.1002/aenm.202300733
Figure 1
(a) Phase diagram of the solubility changes of Zn(OTf)2 in 1 kg of water with increasing BT content. (b) Raman spectra of water 4 m Zn(OTf)2, 4 m Zn(OTf)2/5 m BT, 6 m Zn(OTf)2/7 m BT, 10 m Zn(OTf)2/13 m BT and 13 m BT solutions. (c) LSV curves of three solutions. (d) Fitted Raman spectra of solid Zn(OTf)2 and three solutions. (e) Ionic high resolution mass spectra (HRMS) of 10 m Zn(OTf)2/13 m BT solution. (f) The MD simulation snapshot of the 10 m Zn(OTf)2/13 m BT electrolyte. (g) RDFs for Zn2+-O(H2O), Zn2+-O(OTf−), and Zn2+-O(BT) pairs in the 10 m Zn(OTf)2/13 m BT electrolyte.
Figure 2
(a) Long-term Zn plating/stripping behaviors of symmetrical Zn cells with three electrolytes at 0.1 mA/cm2 and 0.1 mAh/cm2. SEM images of Zn electrodes after 50 cycles in (b) 4 m Zn(OTf)2, (c) 6 m Zn(OTf)2/7 m BT and (d) 10 m Zn(OTf)2/13 m BT electrolytes. (e) Coulombic efficiencies of Zn plating/stripping on the Cu substrate at 0.1 mA/cm2 and 0.1 mAh/cm2 in the three electrolytes.
Figure 3
(a) Charge/discharge profiles (b) and associated differential capacity curves of the Li3V2(PO4)3 cathode cycled at 0.1 A/g cells with 4 m Zn(OTf)2 electrolytes. (c) EDS P/V ratios of the pristine Li3V2(PO4)3 and after cycling in the two electrolytes for 50 cycles. (d) XRD pattern of the Li3V2(PO4)3 cathode after 50 cycles in the two electrolytes. (e) Charge/discharge profiles and (f) associated differential capacity curves of the Li3V2(PO4)3 cathode cycled at 0.1 A/g cells with 10 m Zn(OTf)2/13 m BT electrolytes.
Figure 4
(a) Calculated frontier molecular orbital energy levels of H2O, BT, Zn(OTf)2, Zn2+-OTf- and Zn2+-BT. XPS spectral regions for (b) C 1s, (c) N 1s, (d) F 1s and (e) S 2p of the surface of Li3V2(PO4)3 after cycled 50 cycles, respectively.
Figure 5
The electrochemical performance of the Li3V2(PO4)3 cathode in the 10 m Zn(OTf)2/13 m BT electrolyte: (a) Charge-discharge curves and (b) capacities at different rates. (c) Xharge-discharge curves cycling stability at 0.1 A/g. (d) Charge-discharge curves and cycling stability at 0.1 A/g.


 DownLoad:

 下载:
下载:


 下载:
下载:

