Citation:
Weikang Xiao, An Ning, Yang Liu, Xiaohua Yang, Ling Liu, Xiuhui Zhang. Interfacial chemistry of trifluoroacetic acid and SO3: Unanticipated pathways contributing to aerosols in polluted marine atmospheres[J]. Chinese Chemical Letters,
2026, 37(7): 112175.
doi:
10.1016/j.cclet.2025.112175
Interfacial chemistry of trifluoroacetic acid and SO3: Unanticipated pathways contributing to aerosols in polluted marine atmospheres
English
Interfacial chemistry of trifluoroacetic acid and SO3: Unanticipated pathways contributing to aerosols in polluted marine atmospheres
State Key Laboratory of Environment Characteristics and Effects for Near-space, Key Laboratory of Cluster Science, Ministry of Education of China, School of Chemistry and Chemical Engineering, Beijing Institute of Technology, Beijing 100081, China
Received Date:
18 May 2025 Accepted Date:
25 November 2025 Revised Date:
24 October 2025 Available Online:
15 July 2026
Abstract:
Marine atmospheric aerosols are pivotal components of the global aerosol system, which can significantly influence global climate and human health. Perfluoroalkyl carboxylic acids (PFCAs), persistent emerging contaminants, exhibit pronounced enrichment in sea spray aerosols (SSAs). However, current gas-particle partitioning models underestimate their particulate-phase ratios in polluted atmospheres. Here, we elucidate the interfacial chemistry driving the enrichment of PFCAs in SSAs under anthropogenic impacts. Through Born-Oppenheimer molecular dynamics simulations, we demonstrated that TFA, a representative of PFCAs, exhibited activity at gas-liquid interfaces. The carbonyl oxygen of TFA protrudes beyond hydration layers, which facilitates collisions with gaseous SO3. Interfacial water molecules can promote simultaneous TFA deprotonation and SO3 collision and then the formation of trifluoroacetic acid sulfuric anhydride ions (TFASA-) and hydronium ions (H3O+). TFASA- displays superior hygroscopicity over precursors, enhancing the growth potential of SSAs to form cloud condensation nuclei (CCN). Given the continuous accumulation of PFCAs in marine environment, the interfacial chemical reactions between PFCAs and reactive pollutants (e.g., SO3) in marine atmospheres need urgent focus to understand the influence of PFCAs on marine particulate matter pollution and global climate.
The vast expanse of Earth's oceans renders marine atmospheric aerosols pivotal components of the global aerosol system. These aerosols can not only influence human health [1,2], but also modulate cloud radiative properties, exerting profound impacts on global climate [3-6]. Especially, sea spray aerosols (SSAs) constitute a significant fraction of global atmospheric aerosols and have a profound impact on the formation of marine haze and global cloud condensation nuclei (CCN) [7]. Consequently, elucidating the composition and behavior of SSAs is essential for mitigating atmospheric particulate pollution [8,9] and addressing climate challenges [10].
Perfluoroalkyl carboxylic acids (PFCAs), the persistent degradation products of various perfluoroalkyl precursors, are important emerging atmospheric contaminants [11-13] and have been widely detected in different environments. Their chemical stability facilitates long-range transport via atmospheric circulation and terrestrial runoff, leading to ubiquitous accumulation in marine systems [14,15]. Notably, their carbon-fluorine bonds and carboxyl groups confer surface activity, driving enrichment in SSAs [16]. PFCAs exhibit significant enrichment in marine aerosols, with their concentrations in SSAs exceeding those in seawater by several orders of magnitude [11]. However, discrepancies persist between field observations and gas-particle partitioning models in polluted regions, with current models underestimating particulate-phase PFCA ratios [17-23]. This disparity implies unexplored mechanisms beyond physical condensation facilitate PFCA incorporation into aerosols [17]. Among PFCAs, trifluoroacetic acid (TFA)—the smallest and simplest member—displays exceptional environmental prevalence, with the concentration reaching 1 × 10⁷ molecule/cm3 in the gas-phase [24-26]. Meanwhile, it is also abundant in aquatic environments, with high concentrations reaching 200 ng/L in Mid-Atlantic and Southern Ocean waters [27], suggesting pronounced enrichment potential at SSA interfaces.
Emerging evidence highlights air-water interfaces as critical microreactors for chemical transformations [28-34]. SSAs provide abundant gas-liquid interfaces where unique microenvironments promote the enrichment and chemical transformation of contaminants with surface activity. For TFA, interfacial processes at SSA surfaces may drive particle-phase accumulation through mechanisms distinct from conventional partitioning models. This is particularly relevant given the presence of reactive atmospheric pollutants that could modify interfacial chemistry. Sulfur oxides are major anthropogenic pollutants in the marine atmosphere, and the growth of the shipping industry has led to a continuous increase in sulfur oxides emissions [35]. SO3 as the key oxidation product of SO2, with concentration in coastal regions reaching 107 molecules/cm3, has attracted attention due to its high reactivity [31,36,37]. Studies have shown that SO3 can readily react with inorganic acids (e.g., HCl, HI) [37,38], organic acids (e.g., benzoic acid, acetic acid) [30,39-42], and other organics (e.g., phenol, glycolic acid) [31,43], contributing to secondary aerosol formation. Acetic sulfuric anhydride was detected in the field measurements [37]. Similarly, supersonic expansion experiments have shown that SO3 can react with TFA to form trifluoroacetic acid sulfuric anhydride (TFASA) [42]. Nevertheless, there are three key issues that remain to be explored to understand the interfacial behavior of TFA: (1) Whether TFA exhibits preference for the surface, (2) the molecular level mechanism governing TFA-SO3 interactions at marine aerosol interfaces, and (3) the potential impact of TFA-SO3 interfacial chemistry on the formation of CCN in marine environments. Addressing these fundamental issues will help us understand the influence of TFA in marine atmospheric environments and expand understanding on other PFCAs.
This study systematically investigates surface preference of TFA and the chemical reaction mechanisms between TFA and SO3 at the air-water interface, with particular focus on elucidating the pollutant-mediated pathways through which TFA contributes to aerosol formation. Our findings can provide critical mechanistic insights into the enrichment of the persistent emerging contaminant PFCAs in marine aerosol under the influence of anthropogenic pollutants. The chemical behavior of persistent emerging contaminants with reactive pollutants (e.g., SO3) in marine atmospheres needs urgent focus to refine the CCN concentration prediction and pollution mitigation.
The geometries of all molecules were optimized using the Gaussian 09 [44] software with tight convergence criteria (see details in Section S1 in Supporting information). To identify the lowest-energy molecular clusters, a multi-step conformational search [45] strategy was employed (Section S2 in Supporting information). In addition, the hydration distributions [33] of the studied species were calculated to assess their hygroscopicity (Section S3 in Supporting information). The corresponding Cartesian coordinates are provided in Table S1 (Supporting information). The free energy profile of TFA migrating from vacuum to the aqueous phase was investigated using umbrella sampling implemented in GROMACS (version 2022) [30] to evaluate the interfacial propensity of TFA (Section S4 in Supporting information). The interfacial reaction mechanism between TFA and SO3 was explored through Born-Oppenheimer molecular dynamics (BOMD) simulations performed by the density-functional theory (DFT) method implemented in the CP2K [46,47] package (Section S5 in Supporting information). Finally, the analysis and visualization of the resulting trajectories were implemented by VMD 1.9.3 [48] and Multiwfn 3.7 [49] softwares.
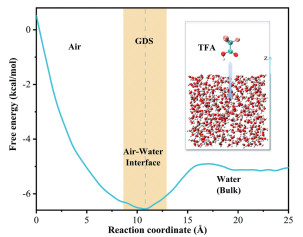
The spatial distribution of reactants at the air-water interface is essential for the occurrence of interfacial reactions. To study the surface preference of TFA, we conducted umbrella sampling simulations (see details in Section S4) to obtain the free energy profile against the distance between the mass center of the TFA and the water slab along with the Z direction. TFA molecule begins approximately 5 Å above the slab of 500 water molecules and gradually moves along the Z-axis to penetrate the aqueous phase (Fig. 1). As TFA moves from the vacuum to the internal region of water, the free energy profile exhibits a distinct minimum (−6.6 kcal/mol) at the air-water interface before converging to a plateau in the bulk aqueous phase. These energy characteristics provide thermodynamic evidence for TFA's preferential accumulation at the interfacial region, suggesting that TFA tends to stay at the interface and is readily available for the collision with SO3 from the atmosphere. Considering the large specific surface area of the SSAs, abundant TFA molecules are anticipated to accumulate on the surface of SSAs.
Figure 1
Figure 1.
Solvation free-energy (kcal/mol) profile of TFA with its movement from the vacuum to the bulk water. Reaction coordinate indicates the distance between the center of mass of the water box and TFA along the Z direction (unit: Å).
The reaction between TFA and SO3 at the air-water interface was further investigated using BOMD simulations (see details in Section S5). Usually, two models (Fig. S1 in Supporting information) should be mainly considered for the reaction involving two molecules at the air-water interface: (ⅰ) The Eley–Rideal mechanism [50], wherein a gas-phase molecule A directly collides with an adsorbed molecule B at the interface, and (ⅱ) the Langmuir–Hinshelwood mechanism [51], wherein A·B complex reacts at the interface. A critical requirement for the Eley–Rideal pathway is the stable adsorption of molecule B at the air-water interface, where it must persist long enough to encounter the incoming gas-phase molecule A. For the SO3-TFA system, either species could theoretically serve as the surface-adsorbed B molecule. However, previous studies using BOMD simulations have found that SO3 exhibits an extremely short residence time (~2.4 ps) at the air–water interface, precluding its role as a stably adsorbed species [30,31]. Consequently, TFA is the only reasonable candidate to serve as the B molecule in model (ⅰ). Regarding the alternative Langmuir–Hinshelwood mechanism, our quantum calculation results show that the formation of TFA-SO3 complex in the gas phase is thermodynamically unfavorable (Fig. S2 in Supporting information), indicating this pathway is unlikely to occur under ambient conditions. Hence, we only considered the reaction between gas-phase SO3 and TFA adsorbed at the interface.
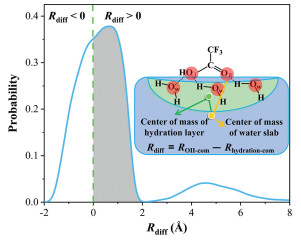
The carboxyl group of TFA is a hydrophilic functional group, which can easily interact with water at the air-water interface. To explore the favorable reaction configuration of TFA at the air-water interface (Fig. 2), the relative positions of the carbonyl oxygen atom (OⅡ) and the hydration layer of TFA were analyzed by the probability density distribution function (Rdiff = ROⅡ-com - Rhydration-com). ROⅡ-com is the distance between the center of mass of the TFA carbonyl oxygen atom (OⅡ) and that of the water slab, and Rhydration-com is the distance between the center of mass of the TFA hydration layer and that of the water slab (Fig. 2). When Rdiff < 0, the carbonyl oxygen atom (OⅡ) is completely solvated and surrounded by the hydration layer. While when Rdiff > 0, the carbonyl oxygen atom (OⅡ) is partially solvated and exposed to the hydration layer. The gray-shaded area in Fig. 2 shows a high probability of the carbonyl oxygen atom being exposed outside the hydrated layer, making it easy for the S atom of SO3 to attack.
Figure 2
Figure 2.
Probability density distribution of Rdiff (Rdiff = ROⅡ-com - Rhydration-com). The yellow line (ROⅡ-com) is the distance between the center of mass of the TFA carbonyl oxygen atom (OⅡ) and that of the water slab, and the green line (Rhydration-com) is the distance between the center of mass of the TFA hydration layer and that of the water slab.
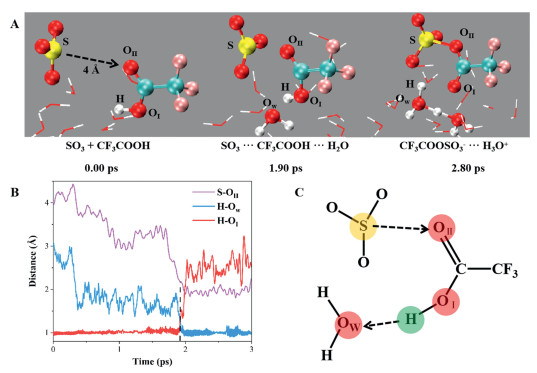
Based on the preference of TFA at the air-water interface and the extension of carbonyl oxygen atom beyond the hydration layer of TFA, it is easy for TFA to react with the approaching gaseous SO3 molecules. As shown in Fig. 3A, the initial distance between TFA and SO3 is 4.0 Å, avoiding the impact of notable intermolecular interactions on the reaction. Upon approaching the exposed carbonyl group, SO3 forms an initial complex with TFA through direct interaction between the S atom of SO3 and the carbonyl oxygen atom (OⅡ) of TFA (S···OⅡ-C). In the pre-reactive complex, the distance between S atom and OⅡ atom is approximately 3.0 Å. Meanwhile, TFA forms hydrogen bonds with oxygen atom (OⅠ) of surrounding water molecules via H atoms (OⅠ-H···Ow), with an atomic distance of approximately 1.65 Å. When interfacial water molecules facilitate the deprotonation of TFA, the OⅡ atom of TFA simultaneously undergoes an addition reaction with the sulfur (S) atom, resulting in the formation of trifluoroacetic acid sulfuric anhydride (TFASA-) ion and hydronium (H3O+) ion at the air-water interface. Fig. 3B shows the key bond length changes during the reaction between TFA and SO3 at the air-water interface. The corresponding interfacial reaction mechanism is shown in Fig. 3C, which involves both deprotonation and addition reactions. Due to the protons can be transferred via interfacial water molecules, facilitating the formation of ionic products rather than neutral molecular products formed through gas-phase reactions, resulting in a more rapid reaction on the air–water interface than in the gas phase (Section S6 in Supporting information). In addition, considering that TFA is a strong acid molecule, it can potentially be easy to dissociate in aqueous environments to form TFA- ion [24]. Taking TFA− ion as the initial reactant, we found that TFA- ion can also quickly react with SO3 to form TFASA- ion at the air-water interface (Fig. S3 in Supporting information).
Figure 3
Figure 3.(A) BOMD simulation snapshots of the reaction between TFA and SO3 on the water slab, illustrating the reaction pathway of the formation of the ion pairs TFASA- and H3O+ ions. (B) Time evolution of the key distances S-OⅡ, H-OⅠ and H-Ow involved in the reaction. (C) Schematic diagram of the reaction mechanism between TFA and SO3 at the air-water interface.
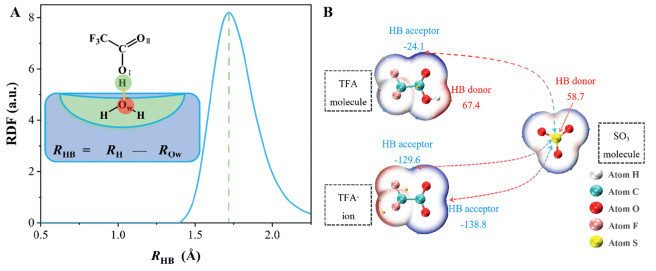
To further elucidate the essence of the interfacial reaction between TFA and SO3, we analyzed the adsorption structure of TFA at the air-water interface using radial distribution functions. Fig. 4A shows the radial distribution function (RDF) profile between the hydrogen atom of TFA and the oxygen atoms (Ow) of interfacial water molecules. An obvious peak located at 1.65 Å is observed, indicating the formation of strong hydrogen bonds between the H atom of TFA and interfacial water molecules. At the same time, the O-H bond of TFA increases from 0.95 Å to 1.05 Å. These structural changes indicate that hydrogen bond formation between TFA and interfacial water molecules facilitates proton (H+) dissociation from TFA. Further, Fig. 4B shows electrostatic potential (ESP) of the van der Waals surfaces of both TFA and SO3. The reaction preferentially occurs between high and low ESP sites. There are electrostatic potential maximum value of 67.39 kcal/mol near H atoms and minimum value of −24.14 kcal/mol near carbonyl oxygen atoms in TFA molecule. When TFA deprotonates to form the TFA- ion, the maximum point disappears, and new minimum point (−138.82 kcal/mol) emerges, and the existing minimum point become more pronounced. Meanwhile, the S atom in SO3 possesses a relatively high positive electrostatic potential of 58.75 kcal/mol. These changes indicate that deprotonation of TFA molecules to form TFA- ion significantly enhances the electrostatic attraction to SO3, favoring the interfacial reaction.
Figure 4
Figure 4.
(A) Radial-distribution-function profiles between the proton (H atom) of TFA with the Ow atoms of interfacial water molecules. (B) ESP on molecular vdW surface of TFA molecule, TFA- ion and SO3 molecule. The unit is kcal/mol.
To understand the hygroscopicity of reactants and products, the hydration distribution of reactants and products at different relative humidities (25%, 50%, 75%, and 100%) were analyzed (see details in Section S3 and Fig. S4 in Supporting information). As shown in Fig. S4, the reactants of TFA and SO3 have weak hygroscopicity, with hydrated clusters < 5% even at the RH of 100%. However, the distributions of hydrated cluster involving TFASA- ion are obviously higher than those of TFA or SO3, which indicates the hygroscopicity of TFASA- is stronger than that of reactants. Thus, high concentration of TFA enriched on the surface of SSA can enhance the hygroscopicity of SSA by forming TFASA- ion under the influence of high concentration of SO3 [33], potentially accelerating their growth to CCN in polluted marine environments.
In summary, this study elucidates the critical interfacial mechanisms governing TFA (as a representative of PFCAs) enrichment and reactive processing on marine aerosols. Molecular dynamics simulations reveal that TFA exhibits pronounced surface activity at air-water interfaces, with its carbonyl oxygen atom protruding beyond the hydration layer, thereby enabling efficient interaction with gas-phase SO3. The reaction follows an Eley–Rideal mechanism, where interfacial TFA undergoes deprotonation facilitated by hydrogen bonding with interfacial water molecules, forming hygroscopic TFASA- ions. Electrostatic potential analysis further demonstrates that TFA deprotonation enhances electrostatic attraction to SO3, driving anhydride formation. The product TFASA- exhibits superior hygroscopicity compared to its precursors, enhancing the growth potential form SSAs to CCN. These findings can provide theoretical clues for the discrepancies between field observations and traditional partitioning models by identifying reactive interfacial pathways as key drivers of PFCA enrichment in polluted marine aerosols. Especially, with the continuous accumulation of PFCAs in the marine environment, the interfacial chemistry between PFCAs and anthropogenic pollutant SO3 will be increasingly important to understand the influence of PFCAs on marine particulate matter pollution and global climate.
Declaration of competing interest
The authors declare that they have no known competing financial interests or personal relationships that could have appeared to influence the work reported in this paper.
This research has been supported by the National Science Fund for Distinguished Young Scholars (No. 22225607) and the National Natural Science Foundation of China (Nos. 22376013, 22306011, and 42105101).
Supplementary materials
Supplementary material associated with this article can be found, in the online version, at doi:10.1016/j.cclet.2025.112175.
Figure 1
Solvation free-energy (kcal/mol) profile of TFA with its movement from the vacuum to the bulk water. Reaction coordinate indicates the distance between the center of mass of the water box and TFA along the Z direction (unit: Å).
Figure 2
Probability density distribution of Rdiff (Rdiff = ROⅡ-com - Rhydration-com). The yellow line (ROⅡ-com) is the distance between the center of mass of the TFA carbonyl oxygen atom (OⅡ) and that of the water slab, and the green line (Rhydration-com) is the distance between the center of mass of the TFA hydration layer and that of the water slab.
Figure 3(A) BOMD simulation snapshots of the reaction between TFA and SO3 on the water slab, illustrating the reaction pathway of the formation of the ion pairs TFASA- and H3O+ ions. (B) Time evolution of the key distances S-OⅡ, H-OⅠ and H-Ow involved in the reaction. (C) Schematic diagram of the reaction mechanism between TFA and SO3 at the air-water interface.
Figure 4
(A) Radial-distribution-function profiles between the proton (H atom) of TFA with the Ow atoms of interfacial water molecules. (B) ESP on molecular vdW surface of TFA molecule, TFA- ion and SO3 molecule. The unit is kcal/mol.

 DownLoad:

 下载:
下载:


 下载:
下载:
