Citation:
Bolin Zhao, Zhifang Wu, Baohua Zhang, Li Niu, Yuwei Zhang. Solid phase transition behavior induced the synthesis of unique high crystallinity C3N4 nanosheets and the super-stability in ECL[J]. Chinese Chemical Letters,
2026, 37(7): 112161.
doi:
10.1016/j.cclet.2025.112161
Solid phase transition behavior induced the synthesis of unique high crystallinity C3N4 nanosheets and the super-stability in ECL
English
Solid phase transition behavior induced the synthesis of unique high crystallinity C3N4 nanosheets and the super-stability in ECL
GDMPA Key Laboratory for Process Control and Quality Evaluation of Chiral Pharmaceuticals, Guangzhou Key Laboratory of Analytical Chemistry for Biomedicine, School of Chemistry, South China Normal University, Guangzhou 510006, China
b.
School of Resources and Civil Engineering, Gannan University of Science and Technology, Ganzhou 341000, China
c.
Department of Clinical Laboratory, Department of Oncology, Life Science Research Center, The First Affiliated Hospital of Xinxiang Medical University, Xinxiang 453100, China
d.
Center for Advanced Analytical Science, Guangzhou Key Laboratory of Sensing Materials and Devices, Guangdong Engineering Technology Research Center for Photoelectric Sensing Materials and Devices, School of Chemistry and Chemical Engineering, Guangzhou University, Guangzhou 510006, China
e.
School of Chemical Engineering and Technology, Sun Yat-sen University, Zhuhai 519082, China
Received Date:
25 June 2025 Accepted Date:
22 November 2025 Revised Date:
28 September 2025 Available Online:
15 July 2026
Abstract:
Understanding the nucleation, growth and structural phase transitions process during the preparation of nanomaterials is crucial for the targeted design and controllable preparation of nanomaterials with specific structures and properties. Herein, a “solid phase transition” behavior is first found in the semiconductor C3N4 material during the conversion process from amorphous bulk C3N4 to high crystallinity C3N4 nanosheets, which usually exists in the process of metals or alloys conversion. A unique C3N4 nanosheet structure with uniform size distribution is successfully synthesized with a simple two-step calcination method, which is totally different from the traditional irregular nanosheets exfoliated from the bulk C3N4. This C3N4 nanosheets also possess high crystallinity and it helps to promote the migration of charge carriers during the catalytic process. By precisely exploring the synthesis process, a new “solid phase transition” mechanism is introduced to help understand the atoms recrystallize and grow to form the uniform high crystallinity nanosheets. The high yield (86%) of this strategy also overcomes the problem of low efficiency in preparing C3N4 nanosheets. Besides, the advantages of this uniform high crystallinity C3N4 nanosheets result in superior long-term stability in 100 CV cycles during the electrochemiluminescence (ECL) test, which is particularly superior to conventional C3N4 nanosheets.
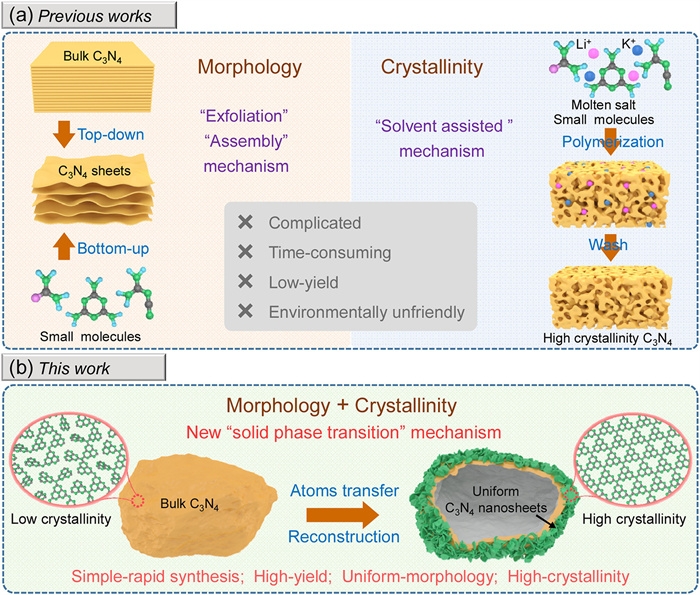
As a promising metal-free polymer semiconductor material, carbon nitride (C3N4) has drawn extensive attention owing to the low cost, facile synthesis and modification, high thermal and chemical stability, as well as the unique band gap structure [1-4]. Up to now, it has exhibited wide application in the fields of photocatalysis, electrocatalysis, sensing, energy conversion and storage since the first study of its photocatalytic activity in 2009 [5-11]. However, pristine bulk C3N4 obtained by thermal polymerization of nitrogen-rich precursors usually suffers from limited activities due to low specific surface area, insufficient active sites and rapid charge carrier recombination [12,13]. To address this issue, developing two-dimensional (2D) C3N4 nanosheet is generally considered as a simple and efficient approach because of the larger surface area, more active sites and better dispersibility characteristics from the nanosheet structure [14,15]. Over the past years, various strategies have been explored to get the C3N4 nanosheets and usually they can be divided into two broad categories: The “top-down” method and “bottom-up” method [16]. The top-down method is known as the ways of exfoliating bulk C3N4 into nanosheets, including liquid ultrasonic exfoliation, chemical etching and thermal oxidation [17,18]. While the bottom-up method refers to the synthesis of C3N4 nanosheets from small molecules by self-assembly. Nevertheless, these methods still face some shortcomings, such as time consuming, environmentally unfriendly and low yield [14]. Therefore, it is highly desired to develop some new strategies to efficiently synthesize the C3N4 nanosheets.
Except for the preparation methods, many efforts have demonstrated that the crystallinity of C3N4 also plays a crucial role in the performance of photocatalysis and electrocatalysis [19-23]. Increasing the crystallinity of C3N4 means extending the ordered π-conjugated structure and reducing the internal and surface defects, which will help facilitate the separation and migration rate of charge carriers, and thus boost the catalytic activity [19,24]. The long-range ordered atomic arrangements in high crystallinity C3N4 also can increase the chemical and structure stability. While the pristine bulk C3N4 generally exhibits an amorphous or poor crystallinity due to the kinetic hindrance during the synthesis process [25,26]. There have been several methods reported to improve the crystallinity of C3N4. Among them, molten salt method is the most popular way, which using molten salt (LiCl/KCl and KBr/LiBr) as the solvent to dissolve the precursor and providing a favorable condition for thermal polymerization process of small molecules [27]. Due to the high degree of condensation, the obtained crystalline C3N4 usually shows extremely low defects density, reduced carrier recombination, high charge transfer rate and excellent catalytic activity. However, the molten salt method usually will lead to the formation of polytriazine imide (PTI) species, which is unstable and inactive for the catalysis [20]. Moreover, the removal of molten salt residue in the samples is also complex and time-consuming [28]. Other methods, such as solvothermal, protonation, template, microwave-assisted and so on, are also complicated and usually need involve acids, organic solvents or other reagents [29]. Thus, it is also significance to design high crystallinity C3N4 samples using some fast, effective, inexpensive and scalable production approaches.
As can be seen from above, morphology regulation and crystallization engineering play crucial roles in the performance of C3N4 materials. Developing a strategy that can simultaneously solve the morphology and crystallinity problems of C3N4 from the initial crystal growth level is an effective idea. In this work, we introduced a new “solid phase transition” mechanism to constructed a novel uniform high crystallinity C3N4 nanosheets through a simple two-step calcination method (Fig. 1). By carefully controlling the calcination under favorable conditions, the morphology of the obtained C3N4 samples presents the nanosheet structure with uniform size and thickness, which is completely different from the conventional irregular nanosheet prepared by exfoliation. Moreover, the prepared C3N4 nanosheets also possess high crystallinity, which can greatly accelerate the mobility of charge carriers and improve the catalytic performance. Through the intensive study of the crystalline C3N4 nanosheets formation process, a new “solid phase transition” mechanism is proposed to reveal the recrystallization and growth of atoms in bulk C3N4 during the formation of high crystallinity nanosheets. First-principles density functional theory (DFT) calculations further confirm the feasibility of this phase transition process by checking the formation energies of the low crystallinity bulk C3N4 precursor and high crystallinity C3N4 nanosheets, respectively. In addition, thanks to the well-sealed precursor by copper foil, a high yield of 86% is achieved during the secondary calcination. Remarkably, due to the fast electron transfer capability and stable structure of the high crystallinity C3N4 nanosheets, it exhibited outstanding stability in 100 cyclic voltammetry (CV) cycles during the electrochemiluminescence (ECL) test.
Figure 1
Figure 1.
(a) Schematic illustration of the traditional morphology synthesis mechanism of C3N4 nanosheets (left) and high crystallinity C3N4 synthesis mechanism (right). (b) Schematic illustration of the new C3N4 synthesis mechanism for the high crystallinity and nanosheets structure, simultaneously.
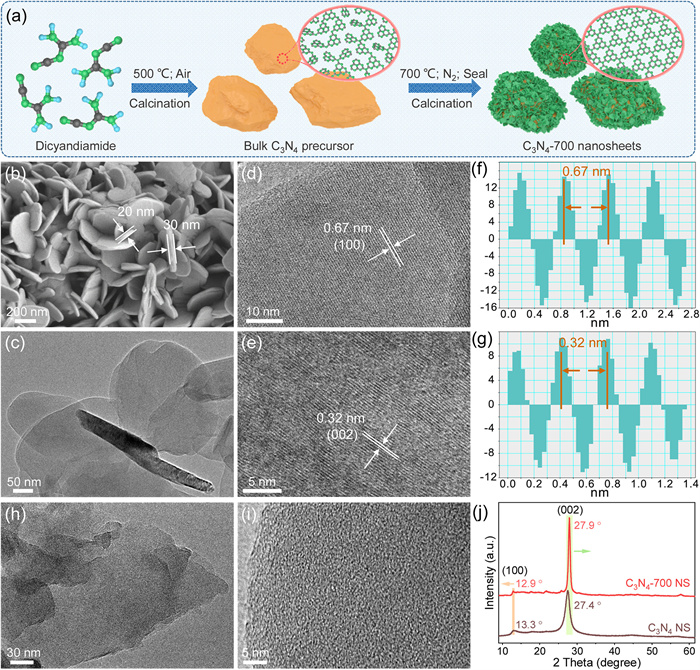
The uniform high crystallinity C3N4 nanosheets were prepared by two-step calcination of the nitrogen-rich dicyandiamide as illustrated in Fig. 2a, which include the pre-polymerization to obtain the C3N4 precursor and the recrystallization and growth to form the high crystallinity C3N4 nanosheets (the details are shown in the experimental part in Supporting information). The morphology and micro-structure of the C3N4 precursors and high crystallinity nanosheets were first investigated by scanning electron microscopy (SEM) and transmission electron microscopy (TEM). As present in Fig. S1 (Supporting information), the C3N4 precursor is the typical dense bulk structure similar to the conventional bulk C3N4 with the rough surface. However, after annealing in the tube furnace under special conditions, a large number of nanosheets densely appeared on the surface of bulk C3N4 precursors (Fig. S2 in Supporting information). The higher magnification SEM image in Fig. 2b shows that the nanosheets are uniform in size with a diameter of about 300–400 nm and a thickness of about 20–30 nm, and the surface of the nanosheets looks very smooth. Besides, these nanosheets are interconnected with each other to form a rich porous nanostructure, which is conducive to facilitating the electrolyte diffusion, increasing the surface area and providing a wealth of accessible active sites for the electrochemical behavior. To the best of our knowledge, this unique C3N4 nanosheet structure has never been reported before. The TEM image in Fig. 2c further confirms the nanosheet microstructure of the samples stripped from the bulk C3N4. From the high-resolution TEM (HRTEM) images in Figs. 2d and e and the corresponding lattice distances in Figs. 2f and g, very clear lattice fringes with a spacing of 0.67 nm and 0.32 nm are distributed on the entire in-planar and interlayer stacking of the nanosheet, which correspond to the (100) and (002) lattice plane of the C3N4 structure, respectively [30,31]. These nanosheet structures are totally different from the traditional irregular and size-random C3N4 nanosheet morphology obtained by ultrasonic exfoliation, chemical etching and thermal oxidation methods (Fig. 2h and Fig. S3 in Supporting information). The appearance of the clear lattice fringes indicates the high crystallinity of the C3N4 nanosheet because these are difficult to obtain in low crystallinity C3N4 (Fig. 2i). The scanning TEM (STEM) image and the corresponding energy-dispersive X-ray spectrum (EDX) mapping images in Fig. S4 (Supporting information) verify that the C and N elements are evenly distributed into the C3N4 nanosheet structure.
Figure 2
Figure 2.
(a) Schematic illustration of the synthesis process for high crystallinity C3N4 nanosheets. (b) SEM image, (c) TEM image, (d, e) HRTEM images and (f, g) lattice distances of (100) and (002) lattice plane of the high crystallinity C3N4 nanosheets. (h, i) TEM images of the conventional C3N4 nanosheets prepared by exfoliation. (j) XRD pattern of the high crystallinity C3N4 nanosheets and conventional C3N4 nanosheets.
Subsequently, X-ray diffraction (XRD) and Fourier transform infrared (FTIR) spectroscopy were further employed to confirm that the prepared materials are C3N4 structure. As shown in Fig. S5a (Supporting information), two main diffraction peaks in XRD patterns located at 13.0° and 27.4° represent the (100) and (002) lattice planes, which correspond to the in-planar repeated tri-s-triazine units and the interlayer stacking of aromatic systems in C3N4 structure, respectively [32]. This indicates that the C3N4 structure has been formed in the precursor although some small molecules were still not completely polymerized. The FTIR spectra in Fig. S5b (Supporting information) display three peak regions distribute at 810, 1200–1700 and 3000–3500 cm-1, which attribute to the stretching vibration of tri-s-triazine units, C–N–C and C=N in CN heterocyclic, N–H in the terminal amino groups and O–H of the surface-bonded H2O, respectively [33]. This also implies the existence of the C3N4 structure in the precursor. The XRD patterns of high crystallinity C3N4 nanosheet (C3N4-700 NS) and traditional C3N4 nanosheet (C3N4 NS) were shown in Fig. 2j. It can be clearly seen that the C3N4 characteristic peaks of C3N4-700 NS are sharper and stronger than C3N4 NS, which means a better polymerization and higher crystallinity in C3N4-700 NS. Moreover, it also can be found that the (002) peak shift to a higher angle from 27.4° to 27.9°, which means the stack interlayers distance become smaller; while the (100) peak shift to a lower angle from 13.3° to 12.9°, which means the expansion of the tri-s-triazine units in planar [34]. Compared with the C3N4 NS, the FTIR peaks of C3N4-700 NS look sharper at the CN heterocyclic region, which also implies the higher crystallinity (Fig. S6 in Supporting information). All these results are consistent with the morphology analysis.
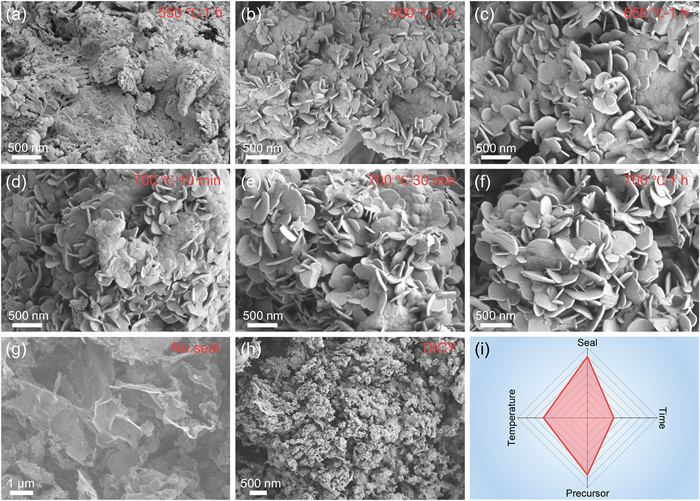
In order to clearly understand how these unique C3N4 nanosheets are formed, a series of controlled condition experiments were carried out. Firstly, the influence of the secondary calcination temperature was investigated. The bulk C3N4 precursors were annealed at different temperatures (550, 600, 650, 700 ℃) for 1 h with copper foil wrapped, respectively. It can be seen from the SEM images that the calcination temperature has a very important effect on the morphology of the obtained samples (Fig. 2b and Figs. 3a–c and Fig. S7 in Supporting information). The nanosheet structures can only form when the temperature is above 600 ℃, and the nanosheets gradually grow up and become uniform with the increase of temperature. If the temperature is too high (>750 ℃), the samples will completely decompose and nothing will be left, and this is also proved by the thermogravimetric analysis (TGA) curve in Fig. S8. Besides, it can be found that the C3N4 nanosheets all can be obtained within 10–60 min at the temperature of 700 ℃, and this means that the effect of heating time is less than that of temperature (Figs. 3d–f and Fig. S9 in Supporting information). Moreover, the C3N4 precursors were annealed in the tube furnace (N2 atmosphere) at 700 ℃ for 1 h without wrapping the porcelain boat with copper foil, and the resulting samples are irregular nanosheets and similar to the samples obtained by thermal oxidation etching method (Fig. 3g and Fig. S10 in Supporting information). This suggests that encapsulating the sample to form an enclosed space plays a crucial role in the formation of the uniform C3N4 nanosheet structure, which maybe can prevent the over-decomposition of the samples into gaseous species and provide a unique environment for the morphology transition (Fig. S11 in Supporting information). Furthermore, the C3N4 samples were also prepared by directly heating the dicyandiamide chemical in the tube furnace at 700 ℃ for 1 h using the copper foil wrapped the porcelain boat by one step calcination, while the final products were only dense nanoparticles (Fig. 3h and Fig. S12 in Supporting information). In summary, there are three decisive factors in the formation of the uniform high crystallinity C3N4 nanosheets, namely, suitable calcination temperature, enclosed space, and precursor, which are all indispensable (Fig. 3i).
Figure 3
Figure 3.
(a-c) SEM images of high crystallinity C3N4 nanosheets prepared at different temperatures for 1 h. (d-f) SEM images of high crystallinity C3N4 nanosheets prepared at 700 ℃ for different time. (g) SEM image of C3N4 prepared without wrapping the porcelain boat with copper foil during the calcination. (h) SEM image of C3N4 prepared by directly heating the dicyandiamide at 700 ℃ for 1 h using the copper foil wrapped the porcelain boat. (i) Summary chart of each influencing factor for the preparation of C3N4 nanosheets.
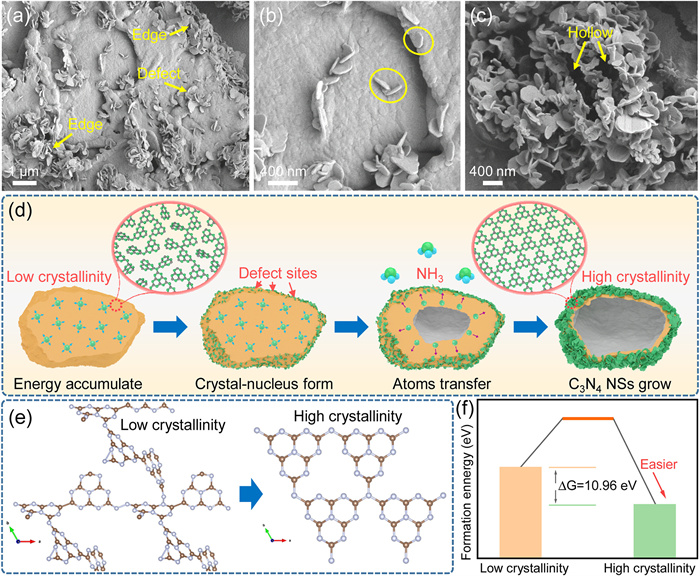
Except for the formation conditions, the specific growth process of the high crystallinity C3N4 nanosheets has also been investigated in depth. According to previous reports, a large amount of gaseous species (N2, NH3, CO2 and CNx) will be formed during the calcination process when C3N4 is synthesized using the nitrogen-rich molecules. So it is easier to think that some gaseous species generated by the decomposition of C3N4 precursor will condense and recrystallize on the bulk C3N4 attachments in the enclosed space and further grow into the C3N4 nanosheets (Figs. S13a and b in Supporting information). Sun’s group proposed a vapor-solid growth mechanism to prepared a nitrogen-rich C3N4 microfiber material [35]. To prove this hypothesis, a carbon paper was placed in the sealed porcelain boat together with the C3N4 precursor during calcination. But there was nothing can be found on the smooth surface of the carbon paper (Figs. S13c-e in Supporting information), which probably due to a low-temperature zone can’t be provided for the condensation of CNx vapor on the substrate under the experimental conditions in this work, so this hypothesis is ruled out. The SEM images of the C3N4 sample prepared at 600 ℃ were further analyzed to reveal the early formation stage of the C3N4 nanosheets. It can be seen that the edges and defect areas of the bulk precursor are more likely to form the C3N4 nanosheets (Fig. 4a). Besides, the nanosheets in the Fig. 4b seem to grow out from the bulk precursor, which like bamboo shoots growing out from the soil. Moreover, we found that there are lots of holes on the broken nanoparticles and the bulk C3N4 maybe have become hollow structures (Fig. 4c, Fig. S14 in Supporting information). Therefore, we infer that it might be the atoms inside the bulk C3N4 have transferred to the outside to form the C3N4 nanosheet structure by re-crystallization. Furthermore, the 86% high yield in the secondary calcination process (Table S1) also can prove that the hollow structure is formed due to atoms transfer not the decomposition of precursor. Based on these proofs, a new “solid phase transition” mechanism is proposed to explain the formation process of this unique highly crystalline C3N4 nanosheets as illustrated in Fig. 4d: (1) The low crystallinity C3N4 precursors accumulate energy at the initial heating process, which causes the atoms of the precursor in a highly active and high-energy state. (2) Once the energy exceeds the threshold, the atoms at the defect sites of the precursor will first recrystallize and nucleate due to the higher energy at defect sites, and followed by other place when the energy is enough. (3) During the continuous heating process, when the atoms on the surface of precursor are insufficient to maintain crystallization, the atoms inside the precursor will start transfer to the surface to promote the growth of crystal nucleus. In the solid to solid phase transition process, the crystal nucleus tends to form sheet-like or plate-like morphology to reduce strain energy when the crystal nucleus maintains similar structure to the parent phase. (4) With the continuous supply of internal atoms, the small crystal nucleus on the surface will eventually form the big C3N4 nanosheets, which like the growth of bamboo shoots. This process also leads to the formation of the hollow structure due to the transfer of atoms. In addition, the NH3 produced by the small amount of decomposition of precursor will fill the closed space, and this suitable NH3 atmosphere is conducive to the formation of high crystallinity C3N4 [36-39]. This kind of crystallization, growth and phase transformation process has been widely reported in the preparation of nano-alloys and crystal materials [40-43]. The DFT theoretical calculation results in Figs. 4e and f show that the high crystallinity C3N4 structure has lower formation energy than the low crystallinity structure, this prove that the high energy atoms will more easily to form the high crystallinity C3N4.
Figure 4
Figure 4.
(a, b) SEM images of high crystallinity C3N4 nanosheets prepared at 600 ℃. (c) SEM image of high crystallinity C3N4 nanosheets prepared at 700 ℃ with holes. (d) Schematic illustration of the formation mechanism of high crystallinity C3N4 nanosheets. (e, f) DFT theoretical calculation and the formation energy about the low and high crystallinity C3N4 nanosheets.
Subsequently, the C3N4 nanosheets synthesized at different temperature (named C3N4-550 NS, C3N4-600 NS, C3N4-650 NS, C3N4-700 NS, respectively) and the conventional C3N4 nanosheets prepared by ultrasonic exfoliation (named C3N4 NS) were also characterized by XRD (Fig. S15a, Table S2 in Supporting information), FTIR spectroscopy (Fig. S15b in Supporting information) and X-ray photoelectron spectroscopic (XPS) (Fig. S16 in Supporting information) for crystalline structure and chemical composition analysis. The results are in agreement with the morphology analysis and further confirm higher crystallinity of C3N4 nanosheets prepared at higher calcination temperature. Furthermore, the optical properties of C3N4 samples were also investigated by the UV–vis diffuse reflectance spectroscopy (DRS) (Fig. S17 in Supporting information), photoluminescence (PL) spectra (Fig. S18 in Supporting information), time-resolved PL decay spectra (Fig. S19 in Supporting information) and electrochemical impedance spectroscopy (EIS) (Fig. S20 in Supporting information). These results indicate that the changes of morphology and crystallinity will greatly affect the optical and electrical properties of C3N4 materials (the details are shown in Supporting information).
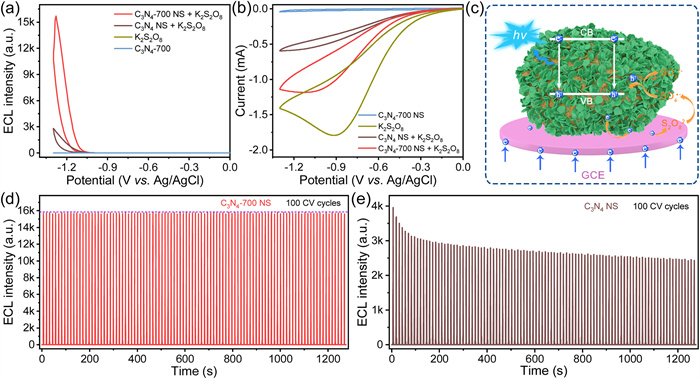
It is well known that C3N4 is a promising ECL luminophore since Xiao’s group reported it in 2012, so we will explore the application value of this high crystallinity C3N4 nanosheets in the ECL field [44]. Similar to previous works, the cathode ECL responds and CV curves were conducted in 0.1 mol/L PBS electrolyte with 100 mmol/L K2S2O8 as the co-reactant [26]. As can be seen from Fig. 5a, the C3N4-700 NS modified GCE emitted a strong light signal with the presence of K2S2O8, while almost no light emission could be seen when the C3N4-700 NS and K2S2O8 existed alone. This indicates that the C3N4 nanosheets was used as luminophore and the K2S2O8 was used as the co-reactant to help the C3N4 nanosheets to emit the light. The CV curve of C3N4-700 NS in Fig. 5b showed a broad reduction peak at −1.1 V in the solution containing 100 mmol/L K2S2O8, which perhaps due to the catalytic reduction of K2S2O8 [44]. Meanwhile, a very small reduction peak at the same potential also appeared on the CV curve of C3N4-700 NS without K2S2O8, and this may be caused by the reduction of C3N4-700 NS (Fig. S21 in Supporting information) [45]. Therefore, a possible ECL reaction mechanism of the highly crystalline C3N4 nanosheets/K2S2O8 system was shown in Fig. 5c: Firstly, the S2O82- was reduced to S2O83- and then spontaneously transformed to strong oxidizing SO4•- species during the electrochemical reduction process (Eq. 1); at the same time, the C3N4-700 nanosheets were also reduced to the negatively charged C3N4•- (Eq. 2); subsequently, the oxidizing SO4•- free radical will react with the reductive C3N4•- to form the excited-state C3N4* (Eq. 3), and because SO4•- and C3N4•- were formed at the same time, so the short-lived free radicals had more chance to react to produce more C3N4*; finally the C3N4* will decay to its ground state accompanied by the production of light radiation (Eq. 4).
$
\mathrm{C}_3 \mathrm{N}_4^* \rightarrow \mathrm{C}_3 \mathrm{N}_4+h v
$
(4)
Figure 5
Figure 5.
(a) ECL and (b) CV curves of the C3N4-700 NS + K2S2O8, C3N4 NS + K2S2O8, K2S2O8, and C3N4-700 NS. (c) The possible ECL mechanism of C3N4-700 NS. (d, e) The ECL intensity stability of C3N4-700 NS and traditional C3N4 NS under 100 continuous CV cycles.
Besides, the ECL signal and CV curve of the conventional C3N4 nanosheets were also recorded to compare with the C3N4-700 NS. It can be seen the ECL intensity of C3N4-700 NS is 5.6 times higher than the traditional C3N4 nanosheets, which indicates the advantage of the C3N4-700 NS in ECL (Fig. 5a). Furthermore, the ECL behavior of the high crystallinity C3N4 nanosheets prepared at different temperature were also tested under the same conditions. As present in Fig. S22 (Supporting information), the ECL emission intensity increased dramatically with the increase of calcination temperature, which maybe ascribe to the high current of C3N4-700 NS generated in catalytic reduction of K2S2O8 and reduction of C3N4 nanosheets. The high current meant more of the two kinds of SO4•- and C3N4•- free radicals produced in the reduction process and resulted in stronger light signal. The ECL emission spectra were also conducted with a constant potential at −1.3 V, and the result shows that the ECL emission peaks appear at 472 nm in all the C3N4 sample, which is consistent with the PL spectra (Fig. S23 in Supporting information).
In addition to the ECL intensity, long-term stability testing is also an important criterion for evaluating the illuminant materials in practical applications. The ECL-time curve of C3N4-700 NS was recorded in Fig. 5d, and the result showed negligible degradation during the 100 continuous cyclic scans in the potential range of 0 V to −1.3 V. This super stability exceeded most of the ECL materials reported by others [46,47]. Besides, the C3N4-650 NS and C3N4-600 NS samples also maintained a stable ECL emission in the 100 CV cycles, while the C3N4-550 NS sample showed a little decline (Fig. S24 in Supporting information). On the contrary, the conventional C3N4 NS showed relatively poor stability during the 100 CV cycles long-term stability test (Fig. 5e). The excellent strong ECL emission intensity and super stability further indicate the application prospects in the field of ECL.
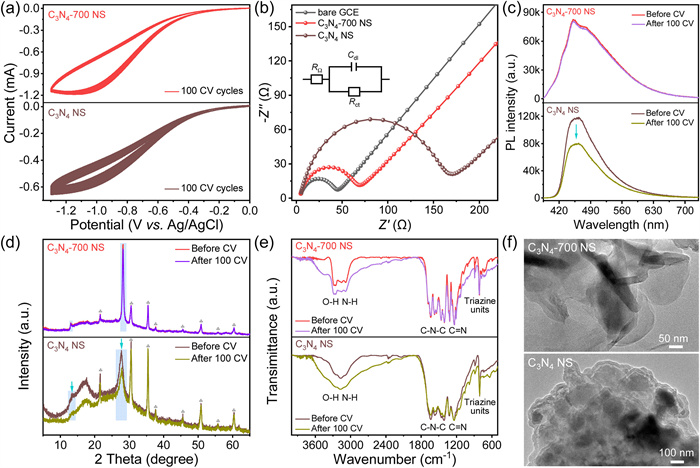
To better understand the difference of the C3N4-700 NS and conventional C3N4 NS in ECL stability, a series of characterization techniques including electrochemical stability, electrical conductivity, photophysical stability and structural stability were carried out to systematically reveal the internal reasons. As shown in Fig. 6a, C3N4-700 NS did not show significant current decline compared with the conventional C3N4 NS during the 100 continuous CV cycles, indicating the better electrochemical stability of the C3N4-700 NS and ensuring a stable source of the free radicals in ECL test. In addition, the EIS curves also confirmed that C3N4-700 NS sample possesses a smaller charge transfer resistance, which will help to accelerate the charge transfer during ECL process, reduce the interface charge accumulation and inhibit the passivation damage of the C3N4 nanosheets (Fig. 6b). The photophysical stability of the samples were revealed by testing the PL spectra (Fig. 6c) of C3N4 samples before and after the 100 CV cycles. It can be clearly seen that the fluorescence emission intensity of C3N4 NS decreased a lot after 100 CV cycles, while the intensity of C3N4-700 NS was almost no change, implying its excellent optical stability. Furthermore, the changes of the structure, composition and morphology were checked by XRD, FTIR and TEM characterization. The change of XRD was obtained by loading the C3N4 samples on ITO and then testing the XRD pattern before and after 100 CV cycles (Fig. 6d). The C3N4-700 NS showed negligible change while the C3N4 NS showed a larger change, meaning the crystallinity of C3N4 NS deteriorated during the electrochemical reaction (Note: the peaks marked by gray arrows were caused by indium tin oxides (ITO) electrode, Fig. S25 in Supporting information). FTIR results in Fig. 6e displayed that there were lots of N–H and O–H bond formed after the CV test, which proved that the C–N–C and C=N frame in the edge of the C3N4 nanosheets will partially decompose during the CV test in both C3N4-700 NS and conventional C3N4 NS [48]. The TEM image after 100 CV cycles test showed that the morphology of C3N4-700 NS had no obvious change, while the conventional C3N4 NS looked like some of the nanosheets stacked together, which may have some impact on the ECL stability (Fig. 6f). This morphology stability of C3N4-700 NS maybe caused from the stable long-range ordered atomic arrangements in high crystallinity C3N4 nanosheets. In conclusion, all these results confirmed the better stability of high crystallinity C3N4-700 NS in various aspects, which resulted in the excellent ECL stability.
Figure 6
Figure 6.
(a) 100 CV curves of the C3N4-700 NS and C3N4 NS. (b) EIS curves of C3N4-700 NS, C3N4 NS and bare GCE in the 0.1 mol/L PBS solution containing 5 mmol/L [Fe(CN)6]3-/4-. (c) PL spectra, (d) XRD, (e) FIRT spectra of the C3N4-700 NS and C3N4 NS before and after 100 CV cycles. (f) TEM images of the C3N4-700 NS and C3N4 NS after 100 CV cycles.
In summary, a new kind of C3N4 nanosheets with uniform size distribution and high crystallinity were prepared by a simple two-step calcination method. Mechanism studies and DFT calculation results revealed that the solid phase transition behavior plays an important role in the recrystallization and growth process of C3N4 nanosheets structure. Benefit from the advantages of uniform morphology and high crystallinity, this as-prepared C3N4 samples exhibited excellent stability in 100 CV cycles during the ECL test. Thus, this work provides new insights for the understanding of solid phase transition behavior in the semiconductor C3N4 material. Based on the super stability during the ECL process, it is highly expected that this uniform high crystallinity C3N4 nanosheets can be used in other electrochemical field.
Declaration of interest statement
The authors declare that they have no known competing financial interests or personal relationships that could have appeared to influence the work reported in this paper.
CRediT authorship contribution statement
Bolin Zhao: Writing – original draft, Data curation. Zhifang Wu: Formal analysis, Supervision. Baohua Zhang: Visualization, Data curation. Li Niu: Funding acquisition, Conceptualization. Yuwei Zhang: Funding acquisition, Conceptualization.
Acknowledgments
This work is financially supported by the National Natural Science Foundation of China (Nos. 22122402, 22171092), Natural Science Foundation of Guangdong Province (No. 2021B1515020048).
Supplementary materials
Supplementary material associated with this article can be found, in the online version, at doi:10.1016/j.cclet.2025.112161.
[1]
S. Cao, J. Low, J. Yu, et al., Adv. Mater. 27 (2015) 2150–2176. doi: 10.1002/adma.201500033
H. Yu, R. Shi, Y. Zhao, et al., Adv. Mater. 29 (2017) 1605148. doi: 10.1002/adma.201605148
Figure 1
(a) Schematic illustration of the traditional morphology synthesis mechanism of C3N4 nanosheets (left) and high crystallinity C3N4 synthesis mechanism (right). (b) Schematic illustration of the new C3N4 synthesis mechanism for the high crystallinity and nanosheets structure, simultaneously.
Figure 2
(a) Schematic illustration of the synthesis process for high crystallinity C3N4 nanosheets. (b) SEM image, (c) TEM image, (d, e) HRTEM images and (f, g) lattice distances of (100) and (002) lattice plane of the high crystallinity C3N4 nanosheets. (h, i) TEM images of the conventional C3N4 nanosheets prepared by exfoliation. (j) XRD pattern of the high crystallinity C3N4 nanosheets and conventional C3N4 nanosheets.
Figure 3
(a-c) SEM images of high crystallinity C3N4 nanosheets prepared at different temperatures for 1 h. (d-f) SEM images of high crystallinity C3N4 nanosheets prepared at 700 ℃ for different time. (g) SEM image of C3N4 prepared without wrapping the porcelain boat with copper foil during the calcination. (h) SEM image of C3N4 prepared by directly heating the dicyandiamide at 700 ℃ for 1 h using the copper foil wrapped the porcelain boat. (i) Summary chart of each influencing factor for the preparation of C3N4 nanosheets.
Figure 4
(a, b) SEM images of high crystallinity C3N4 nanosheets prepared at 600 ℃. (c) SEM image of high crystallinity C3N4 nanosheets prepared at 700 ℃ with holes. (d) Schematic illustration of the formation mechanism of high crystallinity C3N4 nanosheets. (e, f) DFT theoretical calculation and the formation energy about the low and high crystallinity C3N4 nanosheets.
Figure 5
(a) ECL and (b) CV curves of the C3N4-700 NS + K2S2O8, C3N4 NS + K2S2O8, K2S2O8, and C3N4-700 NS. (c) The possible ECL mechanism of C3N4-700 NS. (d, e) The ECL intensity stability of C3N4-700 NS and traditional C3N4 NS under 100 continuous CV cycles.
Figure 6
(a) 100 CV curves of the C3N4-700 NS and C3N4 NS. (b) EIS curves of C3N4-700 NS, C3N4 NS and bare GCE in the 0.1 mol/L PBS solution containing 5 mmol/L [Fe(CN)6]3-/4-. (c) PL spectra, (d) XRD, (e) FIRT spectra of the C3N4-700 NS and C3N4 NS before and after 100 CV cycles. (f) TEM images of the C3N4-700 NS and C3N4 NS after 100 CV cycles.

 DownLoad:

 下载:
下载:


 下载:
下载:
