Figure 1.
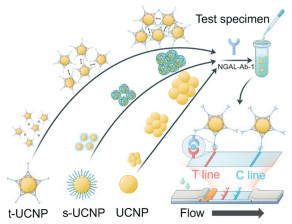
Stability of UCNPs with different DNA modifications and schematic diagram of t-UCNP-based LFIA detection of NGAL.

Detecting neutrophil gelatinase-associated lipocalin (NGAL) quickly and accurately is essential for diagnosing acute kidney injury (AKI) in its early stages. NGAL is a key biomarker for AKI, and its concentration in urine is low under normal physiological conditions. However, once acute kidney injury (AKI) occurs, renal tubular epithelial cells are stimulated by oxidative stress and inflammatory mediators, leading to the increase in NGAL-related mRNA expression within one hour. Subsequently, the elevated NGAL is released via secretory pathways and accumulates in the urine [1-6]. Relevant clinical studies have demonstrated that the concentration of NGAL in urine increases significantly approximately 2–6 h after AKI, with levels rising up to 1000-fold [7-9]. Given this pattern, the ability to detect NGAL levels early and rapidly is crucial for timely diagnosis and effective treatment of AKI. Several methods have been employed to detect NGAL, including enzyme-linked immunosorbent assay (ELISA), chemiluminescent microparticle immunoassay (CMIA), electrochemical immunosensing, and lateral flow immunoassay (LFIA) [10-13]. Among these methods, LFIA has garnered significant attention due to its potential for point-of-care testing (POCT) [14]. However, traditional LFIA relies on colorimetric signals from colloidal gold or latex microspheres, which have a low signal-to-noise ratio [15-17]. This limitation makes it challenging to detect and analyze low concentrations of NGAL in the early stages of AKI.
Upconversion nanoparticles (UCNPs) offer unique optical properties that make them promising candidates for improving detection sensitivity. These properties include extremely low autoluminescence background, narrow emission bands, and good photostability [18-25]. UCNPs have been used to develop LFIA platforms for detecting various biomarkers, such as cardiac troponin I (cTnI) and C-reactive protein (CRP) [26-29]. However, the UCNPs used in these assays are typically small (< 100 nm) and exhibit weak fluorescence, limiting their ability to detect low-concentration substances with high sensitivity. While larger UCNPs with stronger luminescence could potentially address this issue, their poor stability has been a significant barrier to practical application [30-32]. Large-sized UCNPs tend to aggregate, which can lead to a loss of luminescence and reduced performance in diagnostic assays [33-36]. Currently, there is a lack of effective methods to enhance the stability of large-sized UCNPs, making the development of highly sensitive LFIA methods for point-of-care NGAL detection a great challenge.
In this study, we developed highly stable DNA-conjugated UCNPs by attaching single-stranded DNA (ssDNA) or tetrahedral DNA (tDNA) to the surface of UCNPs, resulting in s-UCNPs and t-UCNPs, respectively. The tDNA nanostructure was chosen in this work due to its multiple advantages, including high stability, strong structural rigidity and multiple functionalization sites [37-44]. Notably, the large-sized t-UCNPs (300 nm) demonstrated remarkable long-term stability. When stored in phosphate-buffered saline (PBS) at 25 ℃ and pH 7.4, these nanoparticles maintained their stability for at least 60 days, with a luminescence signal decrease of < 20% and minimal aggregation. Mechanistic analysis revealed that this high stability was primarily due to the combined effects of surface charge density and the rigid tDNA structure, which effectively prevented nanoparticle aggregation. Leveraging these t-UCNPs, we developed a highly sensitive luminescent LFIA strip for NGAL detection. This strip exhibited a linear detection range of 2.00–250 ng/mL and a detection limit of 1.00 ± 0.07 ng/mL. It also demonstrated high selectivity and a rapid point-of-care testing time of < 5 min. We successfully applied this LFIA strip to detect NGAL in artificial urine samples, highlighting its potential for practical clinical use (Fig. 1).
Herein, four distinct sizes of Yb and Pr-doped upconversion nanoparticles (UCNPs) were synthesized by adjusting the doping ratio of rare earth ions Yb and Pr. Yb3+ was chosen as the sensitizing ion due to its large near-infrared absorption cross-section, while Pr3+ was selected as the activating ion because its efficient energy transfer with Yb3+ ion as well as for preparation of relatively large-sized UCNPs [45-48]. Transmission electron microscopy (TEM) analysis revealed that all UCNPs were monodispersed with average particle sizes of 35.0 ± 3.00, 100 ± 5.00, 200 ± 8.00, and 300 ± 10.0 nm, designated as UCNP35, UCNP100, UCNP200, and UCNP300, respectively (Fig. 2a). Elemental mapping analysis confirmed the primary composition of the synthesized UCNPs as Na, Y, F, Yb, and Pr (Fig. 2b). X-ray diffraction (XRD) patterns exhibited distinct diffraction peaks (2θ) at 12.0°, 27.0°, 41.0°, and 52.0°, corresponding to the (100), (110), (201), and (121) crystal planes, respectively (Fig. 2c), confirming the hexagonal phase structure of the synthesized UCNPs [49]. All these UCNPs demonstrated significant luminescence emission under 980 nm excitation, with typical emission peaks at 480, 540, and 640 nm, attributing to the transitions of 3P0 → 3H4, 3P1 → 3H4, and 3P1 → 3F2, respectively [50]. As the nanoparticle size increased, the intensity of these luminescence emission peaks gradually increased while the peak positions remained unchanged (Fig. 2d). Notably, the luminescence intensity of UCNP300 was 3.5 times that of UCNP35 at the same concentration (quantified by the emission intensity at 540 nm: I540). The mechanism underlying this phenomenon can be attributed to several factors. Small-sized UCNPs have a smaller proportion of activator ions. Due to their high surface-to-volume ratio, they also exhibit a greater degree of lattice imperfection and a higher density of surface defects [51,52]. In contrast, larger-sized UCNPs possess a more complete crystal structure and a lower density of surface defects. Additionally, larger particles contain a greater number of Yb3+ sensitizers and luminescent centers, leading to a larger total light absorption cross-section [53]. These results confirmed the successful synthesis of luminescent UCNPs with varying sizes.
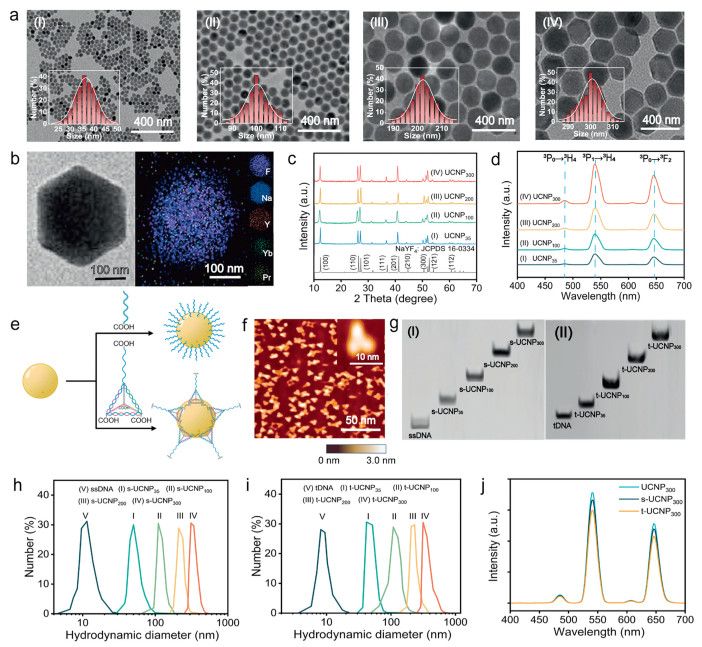
First, to enhance the stability of the synthesized UCNPs, single-stranded DNA (ssDNA) or tetrahedral DNA (tDNA)-modified UCNPs, noted as s-UCNP and t-UCNP, respectively, were prepared using a ligand exchange method (Fig. 2e). This method leveraged the stronger coordination of carboxyl groups at the DNA termini with rare earth ions compared to the oleic acid ligands of UCNPs [54]. Atomic force microscopy (AFM) image showed typical tetrahedral morphology (Fig. 2f). In addition, the assembly process of tDNA was characterized using gel electrophoresis (Fig. S1 in Supporting information). Individual single-strand DNA exhibits rapid migration behavior, while the intermediates produced slower migration bands. Only one clear smeared band with the slowest migration behavior was observed for tDNA, confirming the successful assembly of tDNA with high yield [39]. Moreover, compared with individual tDNA, t-UCNPs exhibited a single band with slower migration, and the migration speed progressively decreased with increasing particle size, including t-UCNPs of 35.0 nm (t-UCNP35), 100 nm (t-UCNP100), 200 nm (t-UCNP200), and 300 nm (t-UCNP300). Similar results were also observed for s-UCNPs of 35.0 nm (s-UCNP35), 100 nm (s-UCNP100), 200 nm (s-UCNP200), and 300 nm (s-UCNP300) (Fig. 2g). Dynamic light scattering (DLS) results indicated that ssDNA and tDNA had hydrodynamic diameters of approximately 10.0 nm and 9.00 nm, respectively, and their modification enhanced the water solubility of UCNPs. The hydrodynamic diameters of s-UCNP35, s-UCNP100, s-UCNP200, and s-UCNP300 were approximately 45.0, 110, 210, and 310 nm, respectively, while those of t-UCNP35, t-UCNP100, t-UCNP200, and t-UCNP300 increased to approximately 44.0, 109, 209, and 309 nm, respectively (Figs. 2h and i). Notably, conjugation of tDNA onto UCNPs resulted in a 10%−15% decrease in luminescence (quantified by the emission intensity at 540 nm: I540). Similar findings were observed for these s-UCNPs (Fig. 2j). In addition, the shift of the wavenumbers of chemical bonds in the FT-IR spectrum and the peak at 260 nm in the ultraviolet spectrum after the modification of tDNA can also indicate the successful attachment of the tDNA to UCNPs (Fig. S2 in Supporting information). Notably, the modification density of the tetrahedral DNA (tDNA) on the UCNP surface was quantified as 61.2 ± 2.10 pmol/mg (n = 5, ±SD) (Fig. S3 in Supporting information). All these results collectively indicated the successful development of DNA-conjugated UCNPs.
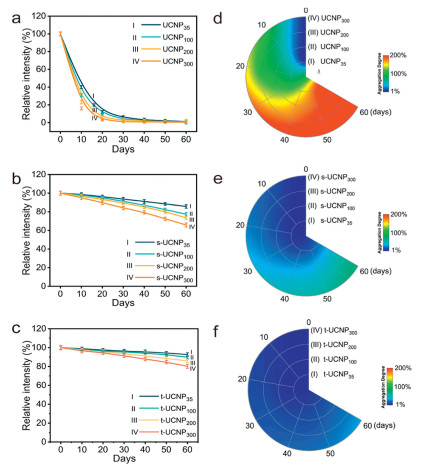
Following the successful development of s-UCNP and t-UCNP, the stability of these UCNPs was further assessed under conventional storage conditions for POCT reagents, specifically at 25 ℃ and pH 7.4 in PBS buffer. As shown in Fig. 3a, the luminescence intensity (quantified by the emission intensity at 540 nm: I540) of unmodified UCNPs (UCNP35, UCNP100, UCNP200, UCNP300) decreased by 70%−90% after 10 days of storage in PBS buffer (pH 7.4) at 25 ℃ (Fig. S4 in Supporting information). After 30 days, no significant luminescence (< 10%) was detected for these unmodified UCNPs, indicating poor stability under conventional storage conditions. Notably, the luminescence intensity of small-sized s-UCNPs (s-UCNP35, s-UCNP100) remained stable even after 30 days of storage, maintaining above 80% intensity. However, for large-sized s-UCNPs (s-UCNP200, s-UCNP300), the luminescence intensity decreased significantly after 60 days of storage, retaining only about 60% (Fig. 3b and Fig. S5 in Supporting information). This suggested that ssDNA modification significantly enhanced the stability of small-sized UCNPs but offered limited improvement for large-sized UCNPs. Surprisingly, t-UCNPs exhibited minimal luminescence decrease after 60 days of storage, with large-sized t-UCNPs (t-UCNP200 and t-UCNP300) maintaining above 80% luminescence intensity even after 60 days (Fig. 3c and Fig. S6 in Supporting information). This demonstrated that tDNA modification significantly improved the stability of both small and large UCNPs. Then, the stability of these UCNPs was further characterized by dynamic light scattering (DLS). As shown in Fig. 3d and Fig. S7 (Supporting information), the hydrodynamic diameter of unmodified UCNPs increased obviously with the prolongation of storage time, as well as the increase of particle sizes. Specifically, the hydrodynamic diameter of UCNP300 increased by 200% after 60 days of storage in PBS (pH 7.4) at 25 ℃, confirming severe aggregation. In contrast, small-sized s-UCNPs (s-UCNP35 and s-UCNP100) showed minimal aggregation (< 35%) after 60 days of storage, while large-sized s-UCNPs (s-UCNP200 and s-UCNP300) experienced significant aggregation, with a 65% increase in hydrodynamic diameter (Fig. 3e and Fig. S8 in Supporting information). Moreover, t-UCNPs of different sizes maintained good stability in PBS (pH 7.4) even after 60 days of storage at 25 ℃. Specifically, the hydrodynamic diameter of t-UCNP300 increased by only 26% after 60 days of storage (Fig. 3f and Fig. S9 in Supporting information). It should be pointed out that the luminescence intensity of polyethylene glycol (PEG) or bovine serum albumin (BSA)-modified UCNP (UCNP300@PEG, UCNP300@BSA) decreased significantly (33%−37%) within 10 days, with hydrated particle size increased by 58%−62% (Fig. S10 in Supporting information), indicating that the better stability of tDNA-modified UCNPs than PEG or BSA-modified UCNP300 as well as other UCNP coated by polymer, silica shell, and lipid [55-58]. Notably, no additional smear band was observed even after the individual tDNA or t-UCNPs being irradiated with a 980 nm laser (400 mW) for 20 min (Fig. S11 in Supporting information), proving negligible effect of excitation light on structural stability of DNA nanostructure. Collectively, these results highlighted the good stability of tDNA-modified UCNPs, making them suitable for long-term applications, compared with unmodified or ssDNA-modified UCNPs.
To explore the stability enhancement mechanism of DNA-modified UCNPs, zeta potentials of s-UCNPs and t-UCNPs were measured after 1, 30, and 60 days of storage. As shown in Figs. 4a and b, the zeta potentials of s-UCNPs with different sizes or t-UCNPs with different sizes were similar, indicating that the surface charge density was comparable on functionalized UCNP with different sizes. Interestingly, t-UCNPs had slightly higher zeta potentials (about −30.0 mV) than s-UCNPs (about −35.0 mV), possibly due to different DNA modification densities on the surface of UCNPs. For s-UCNPs, zeta potentials increased with storage time and particle size. Small-sized s-UCNP35 and s-UCNP100 had zeta potentials of −26.0 mV and −24.0 mV after 60 days, maintaining good water solubility. However, the zeta potentials of s-UCNP200 and s-UCNP300 increased by 64% and 71% after 60 days, with little precipitation. This suggested a substantial decrease in surface charge for large-sized s-UCNPs, likely due to ssDNA detachment and entanglement. In contrast, small-sized s-UCNP35 and s-UCNP100 had no significant zeta potential increase (< 10%). Notably, large-sized t-UCNP200 and t-UCNP300 only showed a 22% increase in zeta potentials after 60 days, indicating minimal surface charge change. Generally, the flexible structure of ssDNA can densely pack on the surface of UCNPs, resulting in a higher density of negatively charged phosphate backbones per unit area [59,60]. However, this dense packing is prone to conformational changes and entanglement over time [61,62]. Conversely, rigid three-dimensional structures and multiple anchor points of tDNA provided more stability, resisting detachment or deformation [63-65]. Thus, tDNA modification enhanced the stability of UCNPs despite their lower surface modification density.
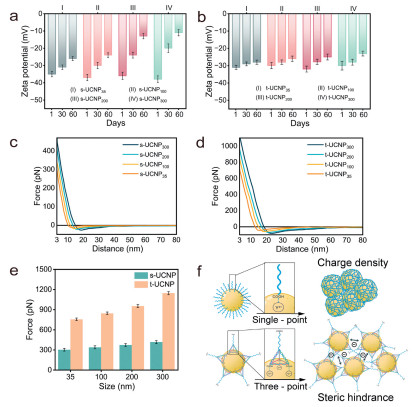
To confirm the effect of DNA rigid structure on the stability of UCNPs, AFM measurements were performed to record force curves, quantitatively evaluating the steric hindrance effects. As shown in Figs. 4c and d, as the AFM probe approached the nanoparticle surface, it first experienced an increasing attractive force, followed by a repulsive force (RF) that grew exponentially as the distance decreased. The RF value increased with particle size for s-UCNPs due to their denser and thicker ligand layers, providing stronger physical hindrance and hydration effects. RF value at a 3 nm distance (RF3) was selected for quantitative analysis. As shown in Fig. 4e, RF3 values for s-UCNP35, s-UCNP100, s-UCNP200, and s-UCNP300 were 300 ± 20.0, 337 ± 21.3, 372 ± 22.8, and 415 ± 23.5 pN, respectively. Similar force variation curves were also observed for t-UCNPs, but the RF of t-UCNPs was higher than that of s-UCNPs at the same size. Specifically, RF3 values for t-UCNP35, t-UCNP100, t-UCNP200, and t-UCNP300 were 755 ± 22.5, 844 ± 24.2, 953 ± 24.5, and 1146 ± 25.1 pN, respectively (Fig. 4e). These higher RF3 values indicated a more rigid structure for t-UCNPs, reducing deformation probability and providing stronger steric hindrance and repulsive forces. In summary, the dual effects of surface charge density and rigid structure of tDNA significantly enhanced the stability of t-UCNPs, especially for large-sized t-UCNP300 (Fig. 4f), effectively reducing particle aggregation and luminescence decrease tendencies.
Leveraging the high luminescence intensity and good stability of t-UCNP300, a luminescent LFIA strip was developed for detecting neutrophil gelatinase-associated lipocalin (NGAL), an early biomarker for acute kidney injury (AKI). The test strip was marked with monoclonal antibody (NGAL-Ab-2) at the test line (T line) and goat anti-mouse IgG antibody at the control line (C line). A detection nanoprobe (t-UCNP300-Ab) was developed by conjugating monoclonal antibody (NGAL-Ab-1) with t-UCNP300 through an amide reaction in PBS buffer. In the presence of NGAL, t-UCNP300-Ab binds with NGAL and then with NGAL-Ab-2, forming a sandwich structure and producing a luminescence signal at the T line. Excess-free t-UCNP300-Ab would be captured by goat anti-mouse IgG antibody, resulting in a luminescence signal at C line (Fig. 5a). The FT-IR spectrum of t-UCNP300-Ab showed a shift in the C=O stretching vibration peak from 1685 cm−1 to 1655 cm−1, compared with individual t-UCNP300 (Fig. 5b), and a distinct broad peak for N—H stretching vibration appeared at 3300 cm−1. These results confirmed the successful development of t-UCNP300-Ab through amide bond formation.
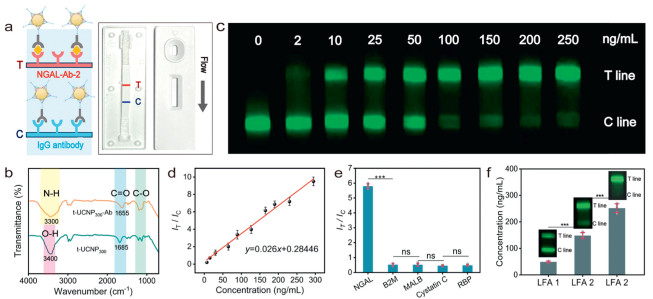
The detection capability of the LFIA strip toward NGAL was assessed using the standard addition method. As shown in Fig. 5c, with NGAL concentration increasing from 0.00 to 250 ng/mL, the green luminescence intensity of the T line (IT) increased significantly within 5 min, while the luminescence intensity of the C line (IC) decreased, achieving a ratiometric response. The minimum detectable concentration for NGAL was 2.00 ng/mL. Quantification of luminescence intensity showed good linearity between the IT / IC ratio and NGAL concentration in the range of 2.00–250 ng/mL (Fig. 5d and Fig. S12 in Supporting information). The limit of detection (LOD) was calculated as 1.00 ± 0.07 ng/mL (S/N = 3, ±SD), while sensitivity (S) was calculated as 0.0260 ± 0.002 mL/ng (n = 10, ±SD). Both of LOD and S values of our method were better than those of reported LFIA methods, including upconversion phosphor-based LFIA, latex microsphere-based LFIA and commercial colloidal gold-based LFIA [66-68].
To validate the specificity of the LFIA strip, the effect of common potential interfering components in urine including urea, creatinine, uric acid, glucose, and albumin, as well as four other common AKI biomarkers including beta-2 microglobulin (B2M), microalbumin (MALB), cystatin C, and retinol-binding protein (RBP), were evaluated at physiological concentrations. A minimal luminescence signal was observed at the T line in the presence of these potential interferences, especially four other common AKI biomarkers (Fig. 5e and Fig. S13 in Supporting information). The results confirmed good selectivity of the developed LFIA strip.
The good selectivity combined with high sensitivity and fast response of the developed LFIA strip to NGAL suggested that our method might be directly applied to detecting NGAL in real biological samples. To validate the accuracy of the developed luminescent LFIA strip in real biological samples, we applied a standard addition method to detect the concentration of NGAL in artificial urine. Three concentrations of NGAL (50.0, 150 and 250 ng/mL) were spiked into the artificial urine samples, the recovery values were in the range of 98.2% ± 7.10% (n = 5, ±SD), 98.9% ± 8.30% (n = 5, ±SD) and 99.4% ± 8.10% (n = 5, ±SD), respectively (Fig. 5f), indicating that our proposed assay could potentially be applied to complex realistic samples. All these results proved that a luminescent LFIA strip was developed successfully, which can be used for point-of-care testing of NGAL with high selectivity and high sensitivity.
In this work, the stability of UCNPs with various sizes was significantly enhanced in an aqueous solution using a tDNA nanostructure functionalized method. Although larger-sized UCNPs typically exhibit stronger luminescence, they often suffer from poor stability. We introduced the dual effects of surface charge density and the rigid tDNA structure to prevent aggregation of UCNPs, markedly improving their stability across different sizes. Specifically, tDNA-modified UCNPs with size of 300 nm maintained good stability (> 60 days) in PBS buffer (pH 7.4) at 25 ℃, with no obvious aggregation and only slight luminescence attenuation, making them suitable for long-term storage.
Using the developed t-UCNP300, we developed a luminescent LFIA strip for detecting the biomarker NGAL. This LFIA strip offered a detection linear range of 2.00–250 ng/mL for NGAL, covering concentrations found in the urine of patients with both mild and severe acute kidney injury (AKI). The limit of detection was approximately 1.00 ± 0.07 ng/mL, lower than that reported colloidal gold-based or latex microspheres (LMs)-based LFIA methods and comparable with that of ELISA methods. Additionally, the developed LFIA strip demonstrated high selectivity and a rapid response time of < 5 min, providing a portable solution for point-of-care testing (POCT). Our developed LFIA strip offered a reliable method for the early diagnosis of AKI. The strategy employed in this work can be extended to other fluorescent nanoparticles. This could enhance their stability and facilitate the development of multifunctional detection kits for complex samples such as urine and blood, broadening the scope for advanced diagnostic tools.
The authors declare that they have no known competing financial interests or personal relationships that could have appeared to influence the work reported in this paper.
Honghao Ma: Writing – original draft, Investigation, Formal analysis, Data curation. Yilin Chen: Data curation. Zhichao Liu: Writing – review & editing, Writing – original draft, Supervision, Methodology, Funding acquisition, Conceptualization. Yang Tian: Writing – review & editing, Validation, Supervision, Conceptualization.
This work was supported by the National Key Research and Development Program of China (No. 2022YFF0710000), the National Natural Science Foundation of China (Nos. 22393930, 22393933 and 22474043), Shanghai "Science and Technology Innovation Action Plan" Fundamental Research Project (Nos. 22JC1401200 and 24ZR1418600), Shanghai Agricultural Science and Technology Innovation Program (No. T2024327), and Fundamental Research Funds for the Central Universities. We also thank the Material Characterization Center of East China Normal University for their assistance in fluorescence imaging.
Supplementary material associated with this article can be found, in the online version, at doi:
J. Mishra, C. Dent, R. Tarabishi, et al., Lancet 365 (2005) 1231–1238. doi: 10.1016/S0140-6736(05)74811-X
L. Nuttha, A. Monpraween, T. Sasipha, et al., Sci. Rep. 10 (2020) 8718. doi: 10.1038/s41598-020-65764-w
L. Li, Y. Shen, Z. Tang, et al., Exploration 3 (2023) 20220148. doi: 10.1002/EXP.20220148
Z.L. Li, J.L. Ji, B. Wang, et al., Am. J. Physiol. Renal. Physiol. 321 (2021) F225–F235. doi: 10.1152/ajprenal.00119.2021
J.R. Karlsen, N. Borregaard, J.B. Cowland, J. Biol. Chem. 285 (2010) 14088–14100. doi: 10.1074/jbc.M109.017129
S. Cao, A. Schnelzer, A. Bozec, et al., Front. Immunol. 12 (2021) 701675. doi: 10.3389/fimmu.2021.701675
R.M. Chang, X.Y. Qu, Y.T. Ye, et al., Chin. Chem. Lett. 36 (2025) 110802. doi: 10.1016/j.cclet.2024.110802
K. MoriK, K. Nakao, Kidney Int. 71 (2007) 967–970;. doi: 10.1038/sj.ki.5002165
M. Zappitelli, K.K. Washburn, A.A. Arikan, et al., Crit. Care 11 (2007) R84. doi: 10.1186/cc6089
D.M. Rissin, C.W. Kan, T.G. Campbell, et al., Nat. Biotechnol. 28 (2010) 595–599. doi: 10.1038/nbt.1641
R.M. Lequin, Clin. Chem. 51 (2005) 2415–2418. doi: 10.1373/clinchem.2005.051532
L.J. Kricka, Clin. Chem. 49 (2003) 990–1001.
J.R. Choi, K.W. Yong, R.H. Tang, et al., Adv. Healthcare Mater. 6 (2017) 1600920. doi: 10.1002/adhm.201600920
L. Huang, D. Zhang, L.R. Jiao, et al., Chin. Chem. Lett. 29 (2018) 1853–1856. doi: 10.1016/j.cclet.2018.11.028
G.A. Posthuma-Trumpie, J. Korf, A.V. Amerongen, Anal. Bioanal. Chem. 393 (2009) 569–582. doi: 10.1007/s00216-008-2287-2
C. Parolo, A. Merkoçi, Chem. Soc. Rev. 42 (2013) 450–457. doi: 10.1039/C2CS35255A
J. Wang, K. Mu, H.J. Wei, et al., Sens. Actuators B 390 (2023) 134029. doi: 10.1016/j.snb.2023.134029
J. Zhou, Z. Liu, F.Y. Li, Chem. Soc. Rev. 41 (2012) 1323–1349. doi: 10.1039/C1CS15187H
M. Chen, Q. Han, C.H. Fan, et al., Sci. Adv. 10 (2024) eadk9485. doi: 10.1126/sciadv.adk9485
Y. Sun, J. Peng, F.Y. Li, et al., Theranostics 3 (2013) 346–353. doi: 10.7150/thno.5137
S. Wen, J. Zhou, D.Y. Jin, et al., Nat. Commun. 9 (2018) 2415. doi: 10.1038/s41467-018-04813-5
T. Zhai, Y. Zhang, D. Guan, et al., J. Anal. Test. 7 (2023) 377–383. doi: 10.1007/s41664-023-00281-z
N.N. Wang, Y.Q. Yang, Z.H. Li, et al., Anal. Chem. 94 (2022) 15738–15745. doi: 10.1021/acs.analchem.2c03351
M. Zhang, N.N. Wang, Z.H. Li, TrAC, Trends Anal. Chem. 151 (2022) 116602. doi: 10.1016/j.trac.2022.116602
P. Liu, S.L. Zhang, L. Wang, et al., Chin. Chem. Lett. 37 (2026) 110966. doi: 10.1016/j.cclet.2025.110966
H. He, B.L. Liu, D.Y. Jin, et al., Anal. Chem. 90 (2018) 12356–12360. doi: 10.1021/acs.analchem.8b04330
M.J. Lang, D. Luo, G.Y. Yang, et al., RSC Adv. 10 (2020) 36396–36403. doi: 10.1039/d0ra05171c
H. Dong, S.R. Du, X.Y. Zheng, et al., Chem. Rev. 115 (2015) 10725–10815. doi: 10.1021/acs.chemrev.5b00091
C. Liu, T.Q. Zhao, J.L. Zhou, et al., Chin. Chem. Lett. 37 (2026) 110967. doi: 10.1016/j.cclet.2025.110967
W.H. He, M.L. You, Z.D. Li, et al., Sens. Actuators B 334 (2021) 129673. doi: 10.1016/j.snb.2021.129673
L. Zhang, S.H. Wen, D.Y. Jin, et al., Anal. Chem. 96 (2024) 16581–16589. doi: 10.1021/acs.analchem.4c02379
S. Mei, J.J. Zhou, D.Y. Jin, et al., Adv. Sci. 8 (2021) 20203325.
Y. Ma, M. Song, L. Li, et al., Exploration 2 (2022) 20210216. doi: 10.1002/EXP.20210216
Y.F. Li, J.M. Ke, F.Y. Li, et al., Sens. Actuators B 345 (2021) 130380. doi: 10.1016/j.snb.2021.130380
Z.H. Li, Q.Y. Liu, F.Y. Li, et al., J. Rare Earths 39 (2021) 11–18. doi: 10.1016/j.jre.2020.06.020
Q.Y. Liu, S.M. Cheng, F.Y. Li, et al., ACS Appl. Mater. Interfaces 12 (2020) 4358. doi: 10.1021/acsami.9b22449
Z.C. Liu, H. Pei, Y. Tian, et al., ACS Nano 12 (2018) 12357–12368. doi: 10.1021/acsnano.8b06322
Z.H. Zhang, Z.C. Liu, Y. Tian, iScience 23 (2020) 101344. doi: 10.1016/j.isci.2020.101344
Z.C. Liu, P.C. Wu, Y. Tian, Chem. Commun. 55 (2019) 9955–9958. doi: 10.1039/c9cc05046a
Z.C. Liu, Z.H. Zhang, Y. Tian, et al., Angew. Chem. Int. Ed. 61 (2022) e202111630. doi: 10.1002/anie.202111630
S.H. Zhang, Z.C. Liu, Y. Tian, et al., Angew. Chem. Int. Ed. 62 (2023) e202301382. doi: 10.1002/anie.202301382
H. Lee, A. Lytton-Jean, Y. Chen, et al., Nat. Nanotechnol. 7 (2012) 389–393. doi: 10.1038/nnano.2012.73
P. Song, J. Shen, D. Ye, et al., Nat. Commun. 11 (2020) 838. doi: 10.1038/s41467-020-14664-8
L. Liang, J. Li, C.H. Fan, et al., Angew. Chem. Int. Ed. 53 (2014) 7745–7750. doi: 10.1002/anie.201403236
M. Haase, H. Schäfer, Angew. Chem. Int. Ed. 50 (2011) 5808–5829. doi: 10.1002/anie.201005159
B. Zhou, B. Shi, D. Jin, et al., Nat. Nanotechnol. 10 (2015) 924–936. doi: 10.1038/nnano.2015.251
F. Wang, J. Wang, X. Liu, Angew. Chem. Int. Ed. 49 (2010) 7456–7460. doi: 10.1002/anie.201003959
D. Yang, Z. Peng, J. Qiu, et al., Small 15 (2019) 1904298. doi: 10.1002/smll.201904298
G. Yi, G. Chow, Adv. Funct. Mater. 16 (2006) 2324–2329. doi: 10.1002/adfm.200600053
F. Auzel, Chem. Rev. 104 (2004) 139–174. doi: 10.1021/cr020357g
W. Christian, F. Stefan, G. Bettina, et al., J. Am. Chem. Soc. 140 (2018) 4922–4928. doi: 10.1021/jacs.8b01458
A. Schroter, S. Märkl, N. Weitzel, et al., Adv. Funct. Mater. 32 (2022) 2113065. doi: 10.1002/adfm.202113065
Y. Cai, M. Lu, X. Qin, et al., Nat. Commun. 16 (2025) 4927. doi: 10.1038/s41467-025-60347-7
D.L. Zhang, R.Z. Peng, W.F. Liu, et al., ACS Nano 15 (2021) 17257–17274. doi: 10.1021/acsnano.1c08036
M. Karan, F. Richard, K. Balmiki, et al., Nano Lett. 22 (2022) 7285–7293. doi: 10.1021/acs.nanolett.2c00437
C. Kembuan, M. Saleh, B. Rühle, et al., Beilstein J. Nanotechnol. 10 (2019) 2410–2421. doi: 10.3762/bjnano.10.231
X. Zhu, J. Li, X. Qiu, et al., Nat. Commun. 9 (2018) 2176. doi: 10.1038/s41467-018-04571-4
M. Susanne, S. Alexandra, H. Thomas, Nano Lett. 20 (2020) 8620–8625. doi: 10.1021/acs.nanolett.0c03327
C.Y. Yang, Y.B. Liu, J.W. Liu, et al., Langmuir 40 (2024) 8730–8737. doi: 10.1021/acs.langmuir.4c00670
B. Liu, J.W. Liu, Chem. Commun. 50 (2014) 8568–8570. doi: 10.1039/C4CC03264K
H.R. Zheng, Y. Zhou, C.H. Fan, et al., J. Am. Chem. Soc. 146 (2024) 17094–17102. doi: 10.1021/jacs.4c02401
P.J.J. Huang, J.W. Liu, Angew. Chem. Int. Ed. 62 (2023) e202212879. doi: 10.1002/anie.202212879
Y. Wei, Y. Feng, C.H. Fan, et al., Angew. Chem. Int. Ed. 63 (2024) e202319907. doi: 10.1002/anie.202319907
Z.Y. Li, C. Wang, C.H. Fan, et al., CCS Chem. 2 (2020) 707–728. doi: 10.31635/ccschem.020.202000236
R.P. Goodman, I.A.T. Schaap, C.F. Tardin, et al., Science 310 (2005) 1661–1665. doi: 10.1126/science.1120367
L.J. Lei, J. Zhu, Y.W. Han, et al., Talanta 162 (2017) 339–344. doi: 10.1016/j.talanta.2016.10.009
P. Tunakhun, S. Ngernpimai, P. Tippayawat, et al., Anal. Methods 16 (2024) 7033–7042. doi: 10.1039/d4ay00838c
K.B. Bufkin, J. Silva, J. Clin. Med. 13 (2024) 7564. doi: 10.3390/jcm13247564

Figure 1 Stability of UCNPs with different DNA modifications and schematic diagram of t-UCNP-based LFIA detection of NGAL.

Figure 2 Synthesis and characterization of UCNPs and DNA functionalized UCNPs. (a) TEM images of UCNPs with average sizes of 35.0 ± 3.00 nm (Ⅰ), 100 ± 5.00 nm (Ⅱ), 200 ± 8.00 nm (Ⅲ), 300 ± 10.0 nm (Ⅳ). Inserts are the particle size distribution diagrams. (b) Elemental mapping of the 300 nm UCNP, showing the distribution of Na, Y, F, Yb, and Pr. (c) XRD patterns of UCNP35 (Ⅰ), UCNP100 (Ⅱ), UCNP200 (Ⅲ), UCNP300 (Ⅳ). (d) Luminescence spectra of UCNP35 (Ⅰ), UCNP100 (Ⅱ), UCNP200 (Ⅲ), UCNP300 (Ⅳ) under 980 nm excitation. (e) Schematic illustration of single-stranded DNA (ssDNA) or tetrahedral DNA (tDNA) conjugated UCNPs. (f) AFM image of the assembled tDNA structure. Insert is the typical image of individual tDNA. (g) Gel electrophoresis images of UCNPs modified with ssDNA (Ⅰ) (from left to right: ssDNA, s-UCNP35, s-UCNP100, s-UCNP200, and s-UCNP300) and tDNA (Ⅱ) (from left to right: tDNA, t-UCNP35, t-UCNP100, t-UCNP200 and t-UCNP300). (h) DLS spectra of ssDNA (Ⅴ), s-UCNP35 (Ⅰ), s-UCNP100 (Ⅱ), s-UCNP200 (Ⅲ), s-UCNP300 (Ⅳ). (i) DLS spectra of tDNA (Ⅴ), t-UCNP35 (Ⅰ), t-UCNP100 (Ⅱ), t-UCNP200 (Ⅲ), t-UCNP300 (Ⅳ). (j) Luminescence spectra of UCNP300, s-UCNP300, t-UCNP300 under 980 nm excitation.

Figure 3 Stability of ssDNA- or tDNA-modified UCNPs. (a) Luminescence intensity of UCNP35 (Ⅰ), UCNP100 (Ⅱ), UCNP200 (Ⅲ), UCNP300 (Ⅳ) after being stored in PBS for different time periods. (b) Luminescence intensity of s-UCNP35 (Ⅰ), s-UCNP100 (Ⅱ), s-UCNP200 (Ⅲ), and s-UCNP300 (Ⅳ) after being stored in PBS for different time periods. (c) Luminescence intensity of t-UCNP35 (Ⅰ), t-UCNP100 (Ⅱ), t-UCNP200 (Ⅲ), t-UCNP300 (Ⅳ) after being stored in PBS for different time periods. (d) Percentage of hydrodynamic diameter increase of UCNP300 (Ⅳ), UCNP200 (Ⅲ), UCNP100 (Ⅱ), UCNP35 (Ⅰ) over 60 days. (e) Percentage of hydrodynamic diameter increase of s-UCNP300 (Ⅳ), s-UCNP200 (Ⅲ), s-UCNP100 (Ⅱ), s-UCNP35 (Ⅰ) over 60 days. (f) Percentage of hydrodynamic diameter increase of t-UCNP300 (Ⅳ), t-UCNP200 (Ⅲ), t-UCNP100 (Ⅱ), t-UCNP35 (Ⅰ) over 60 days.

Figure 4 Mechanism of stability enhancement for DNA-modified UCNPs. (a) Zeta potential of s-UCNP35 (Ⅰ), s-UCNP100 (Ⅱ), s-UCNP200 (Ⅲ), s-UCNP300 (Ⅳ) after being stored in PBS for 1, 30, and 60 days. (b) Zeta potential of t-UCNP35 (Ⅰ), t-UCNP100 (Ⅱ), t-UCNP200 (Ⅲ), t-UCNP300 (Ⅳ) after being stored in PBS for 1, 30, and 60 days. (c) Force curves of s-UCNP300, s-UCNP200, s-UCNP100, s-UCNP35 at different distances. (d) Force curves of t-UCNP300, t-UCNP200, t-UCNP100, t-UCNP35 at different distances. (e) Repulsive forces at a 3 nm distance (RF3) for s-UCNPs and t-UCNPs of different sizes. (f) Schematic illustration of the stability mechanism.

Figure 5 Sensing performance of luminescent LFIA strip for NGAL. (a) Schematic illustration of the sandwich structure (left) and photograph of the LFIA strip (right), where the red line represents the test line (T line) and the blue line represents the control line (C line). (b) FT-IR spectra of t-UCNP300-Ab, t-UCNP300. (c) Upconversion luminescence images of the LFIA strip under 980 nm laser excitation after incubation with varying concentrations of NGAL standard solutions (0.00, 2.00, 10.0, 25.0, 50.0, 100, 150, 200, 250 ng/mL). (d) Calibration curve between the IT/IC ratio and various concentrations of NGAL in (c) (n = 3, ±SD). (e) Selectivity evaluation of the developed LFIA strips towards common AKI biomarkers at their physiological levels. The concentrations of NGAL, B2M, MALB, Cystatin C and RBP are 100 ng/mL, 150 ng/mL, 1.00 µg/mL, 67.0 ng/mL and 300 ng/mL (n = 5, ±SD). (f) The detection of NGAL in artificial urine using the developed luminescent LFIA strip.

 扫一扫看文章

扫一扫关注我们
 DownLoad:
 下载:
下载:
 下载:
下载: