Citation:
Lin Cai, Lina Su, Zhiruo Zhou, Jianhua Liu, Li Li, Fengyang Yu, Jiaqi Li, Wenjin Wang, Pengfei Wang, Sihui Zhan. Ho-Engineered electronic structure of LaFeO3 for enhanced photocatalytic molecular oxygen activation and water purification[J]. Chinese Chemical Letters,
2026, 37(7): 112158.
doi:
10.1016/j.cclet.2025.112158
Ho-Engineered electronic structure of LaFeO3 for enhanced photocatalytic molecular oxygen activation and water purification
English
Ho-Engineered electronic structure of LaFeO3 for enhanced photocatalytic molecular oxygen activation and water purification
State Key Laboratory of Chemistry and Utilization of Carbon Based Energy Resources, College of Chemistry, Xinjiang University, Urumqi 830017, China
b.
School of Environmental Science and Engineering, Zhejiang Gongshang University, Hangzhou 310012, China
c.
MOE Key Laboratory of Pollution Processes and Environmental Criteria/Tianjin Key Laboratory of Environmental Remediation and Pollution Control, College of Environmental Science and Engineering, Nankai University, Tianjin 300350, China
d.
School of Environmental Science and Engineering, Tianjin University, Tianjin 300350, China
shzhan@tju.edu.cn (S. Zhan). 1 These authors contributed equally to this work.
Received Date:
18 June 2025 Accepted Date:
21 November 2025 Revised Date:
05 September 2025 Available Online:
15 July 2026
Abstract:
Rare–earth–based perovskite materials, due to their low cost and tunable structure, have been regarded as a promising platform for photoinduced molecular oxygen activation. However, a comprehensive understanding and precise regulation of the surface reconstruction of the active phase in perovskite oxides during molecular oxygen activation remain highly challenging tasks. Herein, a refined A–site management strategy is proposed for perovskite oxides, which provides power for molecular oxygen activation by adjusting the electronic structure of B–site elements. Comprehensive experimental results reveal that the enhanced photocatalytic mechanism is attributed to the substitution of holmium (Ho) at the atomic level, which facilitates an increase in the valence state of iron and shifts the center of the d–band to a more positive energy level, thereby promoting O2 adsorption. Additionally, theoretical calculations demonstrate that the Ho 4f orbital overlaps with the Fe 3d and O 2p orbitals near the Fermi level, significantly enhancing charge transfer between oxygen and metal, thereby facilitating the conversion of oxygen into highly reactive oxygen species. Therefore, the optimized La0.97Ho0.03FeO3 (LHFO) exhibits greatly enhanced catalytic performance for molecular oxygen activation, and the degradation rate constant of tetracycline is 9.5 times higher than LaFeO3, representing one of the most efficient and robust RE–based perovskites.
The persistent threat of emerging organic contaminants (EOCs) in water bodies, driven by their bioaccumulation and chronic toxicity [1–3], demands advanced solutions beyond conventional treatment limitations [4]. Photocatalytic activation of abundant molecular oxygen (O2) offers a sustainable route for EOCs degradation. However, exploiting O2 is fundamentally challenging: its ground triplet state (3Σg⁻) imposes a kinetic "spin restriction" barrier against direct reaction with singlet organic pollutants [5,6]. Effective catalytic activation is therefore essential. Designing efficient photocatalysts for O2 activation faces three critical challenges: (1) Facilitating efficient electron transfer to O2 to generate reactive oxygen species (ROS) amidst rapid charge carrier recombination in photocatalysts [7]; (2) enabling broad–spectrum light absorption to maximize solar energy utilization [8]; and (3) optimizing catalyst surface properties for strong O2 adsorption and activation. Addressing these challenges through rational material design that enhances charge separation, broadens light absorption, and tailors active sites is critical for developing efficient photocatalytic water purification technologies [9,10].
Low-cost tunable perovskite oxides (ABO3) serve as ideal catalytic platforms [11–13], yet their photocatalytic efficacy suffers from rapid charge recombination and limited light absorption [14]. Most enhancement strategies target B-site modifications, where cations dictate catalytic activity by regulating the binding of oxygen-related intermediates through their eg orbital occupancy [15,16]. Crucially, A-site engineering indirectly governs catalyst performance by steering B-site surface reconstruction, despite not participating directly in catalytic cycles. This pivotal role establishes A–site modulation as an essential optimization strategy. For example, Ce substitution at the A-site of LaMnO3 elevates Mn4+ content, forming Mn3++/Mn4+ redox couples that enhance Mn 3d/O 2p orbital overlap and reduce band energy, facilitating oxygen adsorption and charge transfer [17]. Similarly, La-O/Ce-O bond length differences in La0.5Ce0.5FeO3 distort FeO6 octahedra, improving oxygen mobility and surface exchange [18]. Feng et al. further demonstrated that increasing A-site ionic radius adjusts B-O-B bond angles, strengthening B-O covalency via hybridisation rearrangement to promote surface oxygen reactions [19]. These studies confirm A-site substitution drives B-site reconstruction to boost catalytic activity. Consequently, the rational design of A–site modulators is a promising strategy for enhancing molecular oxygen activation. This approach holds strategic value by uniquely optimizing both oxygen adsorption energetics and charge transfer kinetics, thereby advancing sustainable catalysis.
Rare earth single–atom catalysts (RE–SACs) emerge as catalytic frontiers for A-site modification, maximizing atom–specific activity and economy through distinctive properties including large ionic radii, diverse coordination environments, and strong oxygen affinity [20–22]. These characteristics enable efficient cocatalysis via d/p-f orbital coupling for local electron density modulation, as demonstrated in RE–SAC studies [23,24]. Notably, Ho single atoms exhibit exceptional properties, characterized by abundant f-f energy-level transitions and high charge polarizability, stemming from their unique intra-4f electronic configurations. As demonstrated by Fu et al., the introduction of Ho single atom can enhance the light absorption capacity of magnesium Mg1.2Ti1.8O5/g-C3N4 owing to 5G3(3H6)/3K7(5G4)/5G5/5G6(5F1)-5I8 emissions in the 4f energy level of Ho single atom can be more easily absorbed by CN and MTO, which is more conducive to improving light utilization and thus enhancing CO2 conversion efficiency [25]. Moreover, the crustal abundance of Ho (~1.3 ppm) is orders of magnitude higher than critical catalytic metals like platinum (~0.005 ppm), with established extraction and commercial supply chains, supporting its viability for scalable applications [26,27]. These catalysts form stable structures via strong metal-support interactions, exhibiting excellent regenerability and significant potential for photochemical applications [28]. However, their application in wastewater treatment remains critically understudied.
Based on the above considerations, we develop A-site management strategy to control the surface reconstruction of the active phase based on B-site elements on LaFeO3 for boost photocatalytic molecular oxygen activation. The optimized LHFO degraded 95% of TC in 60 min under visible light, and NIR responsive catalytic ability was achieved. Experimental and theoretical calculations reveal that introduction of Ho enhances the O2 binding interaction of LHFO by modulating the Fe valence state and eg orbital occupancy. Concurrently, the d-band center of LHFO shifts closer to the Fermi level, leading to a reduced occupancy of Fe antibonding orbitals. Consequently, the adsorption of oxygen is significantly reinforced, which enhances the production rate of ROS. In addition, the overlap of Fe 3d, Ho 4f and O 2p orbitals near the Fermi level improves the electron transfer between oxygen atoms and metal atoms, which greatly improves the activity of the catalyst. The toxicity of these intermediates was assessed through quantitative structure-activity relationship (QSAR) analysis, providing insights into the observed variations in toxicity during the photocatalytic oxidation of TC. The continuous-flow reactor experiments demonstrated that the LHFO/Vis system exhibits promising potential for practical wastewater treatment. This study demonstrates the feasibility of modulating the electronic structure of active phases through A–site management, providing a new strategy for developing highly efficient molecular oxygen activation catalysts.
Texts S1–S7 (Supporting information) of the gives detailed information on the characterization, photoelectrochemical measurement, theoretical calculation, molecular oxygen activation measurements, and degradation experiments.
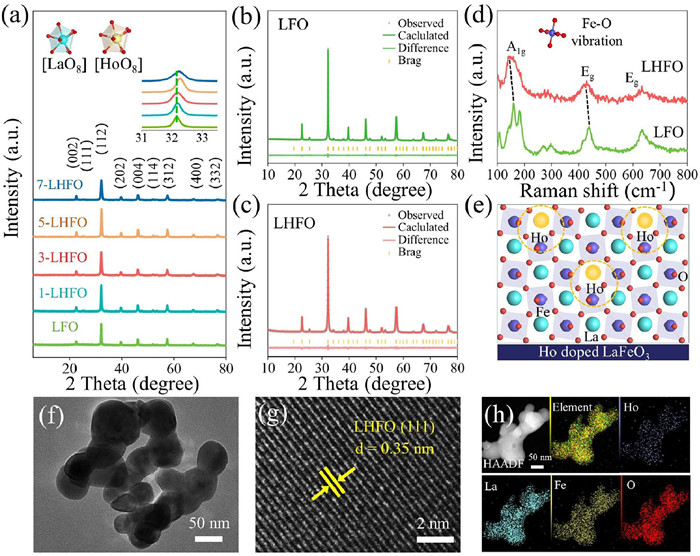
La1-xHoxFeO3 catalysts with different Ho/La molar ratios were synthesized by a sol–gel method (Fig. S1 of Supporting information). Among all La1-xHoxFeO3 samples with different compositions, the 3-LHFO (LHFO) shows the best photocatalytic activity, and hence LHFO was selected as the model catalyst for this work study. Crystalline structures of catalyst powders were characterized by X–ray diffraction (XRD) and Raman spectra. As described in Fig. 1a, the diffraction pattern of LFO is in well consistency with JCPDS card No. 04–6514, indicating that it has a Pnma space group structure without the appearance of any impurity phase [29]. For the LHFO, the main peak shift slightly to higher angles compared to the pristine LFO, implying a lattice contraction after the Ho doping [30]. Additionally, Rietveld refinement of the XRD pattern reveals (Figs. 1b and c, Table S1 in Supporting information) that the unit cell volume of LHFO (242.183 Å−3) slightly reduces compared to LFO (242.679 Å−3) further proving that Ho single atoms were successfully incorporated into the LFO unit cell (Fig. 1e). Moreover, the results of Raman analysis (Fig. 1d) showed that LFO is in 159.0, 438.2, and 632.9 cm−1 show three typical vibration modes. Based on their polarization characteristics, we assigned them to the A1g mode (oxygen octahedron rotating around the hexagonal (001) direction) and the Eg mode (pure bending vibration of oxygen) [31]. With the holmium incorporation, the position of Fe-O stretching vibration over LHFO catalysts is blue-shifted, implying the B-O bond covalency is enhanced. It is favorable for accelerating the adsorption and activation process for O2 on oxides surface [32]. Morphologies of the LFO and LHFO (Figs. 1f and g and Fig. S3 in Supporting information) were analyzed via scanning electron microscopy (SEM) and transmission electron microscopy (TEM). As shown in Fig. S2 (Supporting information), the particles of all samples present an irregular accumulation of nanoparticles and the particle size was approximately 50–100 nm, which conform to the representative morphological feature of La-based perovskite. The TEM image of LHFO shows clear crystal fringes with a lattice spacing of ~0.35 nm, which belongs to the (111) plane of the LFO. Furthermore, the corresponding energy dispersive X-ray spectroscopy (EDS) mapping images (Fig. 1h) suggest the uniform distribution of La, Ho, Fe, and O on the LHFO. Meanwhile, the specific surface areas of LFO and LHFO samples were investigated by nitrogen adsorption desorption isotherm measurements. The nitrogen adsorption–desorption analysis (Fig. S4 in Supporting information) reveals characteristic type IV isotherms across all specimens, demonstrating the existence of interconnected mesoporosity and high–pore connectivity in the skeleton. It is noticed that LHFO exhibits a specific surface area of about 8.1044 m2/g, while the observed surface areas for LFO samples is 4.6680 m2/g (Table S2 in Supporting information). Naturally expected, the large specific surface area is much beneficial for the better adsorption of O2 and provide more active sites for catalytic reactions [33].
Figure 1
Figure 1.
(a) XRD patterns of LFO, 1-LHFO, 3-LHFO, 5-LHFO and 7-LHFO powders. Refined XRD of LFO (b) and LHFO (c). (d) Raman spectra of LFO and LHFO. (e) Schematic model of Ho doped LFO perovskite. HRTEM image of LHFO (f) and (g). (h) HAADF-TEM image and the corresponding EDS element (Ho, La, Fe, O) mappings of the LHFO.
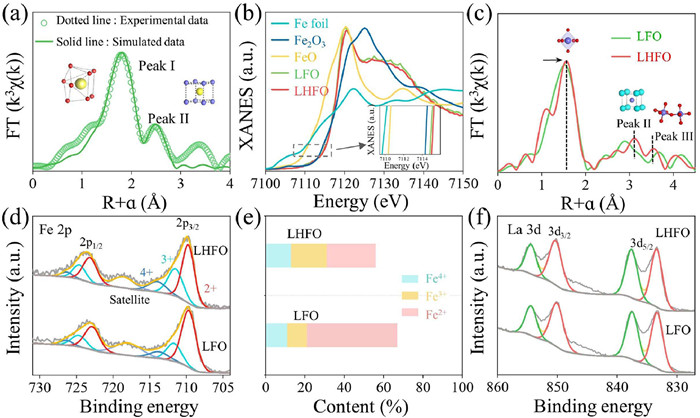
X–ray absorption fine structure (XAFS) analysis confirmed the atomic dispersion of holmium. Two notable peaks at about 1.8 Å and 2.7 Å were observed in the FT–XAFS fitting for LHFO (Fig. 2a and Table S3 in Supporting information), which correspond to Ho-O and Ho-La scattering paths. Subsequently, the results of the wavelet transform (WT) analysis is in accordance with Fourier transform extended X-ray absorption fine structure (FT-EXAFS) fitting, indicating the presence of a local intensity maximum at k = 4.0 Å−1 for Ho-O in LHFO (Fig. S5 in Supporting information), which demonstrate the successful formation of atomically dispersed Ho on the LHFO [25]. Considering that the modification of the A site can significantly adjust the electronic structure of the B site in the perovskite structure (ABO3), and thus has a strong impact on the catalytic activity, we conducted in-depth research on the oxidation state and coordination environment of Fe site. As shown by the XAFS, the absorption edges of LHFO and LFO are higher than that of Fe2O3, suggesting that their average valence states of Fe are slightly higher than +3 (Fig. 2b). Meantime, the absorption edges in LHFO has a higher energy than that in LFO, indicating that the valence rise. This shows that we have successfully optimized the electronic structure of the B site via the A site management strategy, and the Fe 3d eg occupancy rate has been significantly reduced, which may be beneficial to the subsequent reaction of activating molecular oxygen. The FT-XAFS measurements were used to provide insights into the coordination structures of Fe in LFO and LHFO (Fig. 2c). There are three prominent peaks at about 1.8, 3.3, and 3.7 Å for LFO and LHFO that originate from the scattering paths of the Fe-O, La-Fe, and Fe-O-Fe bonds. Furthermore, the two peaks (peak I and peak II) of LHFO were significantly a positive shift after Ho atom introduction, which represented the distance increase of Fe-O and Fe-La/Ho. The results of the WT analysis indicate the presence of a local intensity maximum at k = 7.0 Å−1 for Fe-O in LHFO (Fig. S6 in Supporting information) [34]. Moreover, the EXAFS fitting results in Table S4 and Fig. S7 (Supporting information) provide further support for this conclusion, with Ho atoms have replaced La atoms in the A site of the perovskite structure. The chemical state of various elements on the surface of the LHFO was studied by X–ray photoelectron spectroscopy (XPS) analysis, and the results also indicated that La, Fe, Ho and O are coexisted in the LHFO (Fig. S8 in Supporting information). From the Fe 2p3/2 spectra of LHFO, Fe species contained Fe2+ (709.72 eV), Fe3+ (711.47 eV), and Fe4+ (713.94 eV). In the analysis of different iron species concentrations (Figs. 2d and e, Table S5 in Supporting information), the relative contents of Fe3+ (31.30%) and Fe4+ (12.75%) in LHFO increased significantly compared to LFO, consistent with the XAFS results [35]. As exhibited in Fig. 2f and Table S6 (Supporting information), La 3d spectra depict two major doublets at around 833.57 eV and 850.18 eV, which can be distributed to the La 3d5/2 and La 3d3/2 orbitals, respectively. The shift of the La 3d peak is negligible, indicating that the change in chemical state occurs mainly at the B-site ions.
Figure 2
Figure 2.
(a) Ho K-edge EXAFS analysis of LHFO at R space. (b) Fe K-edge XANES spectra (inset: enlarged view of the absorption edge position) of LFO, LHFO, Fe foil, FeO, and Fe2O3. (c) Fe K-edge FT-EXAFS spectra of LFO and LHFO. (d) Fe 2p XPS spectra in LFO and LHFO. (e) Comparison of Fe2+, Fe3+and Fe4+ contents in LFO and LHFO. (f) La 3d XPS spectra in LFO and LHFO.
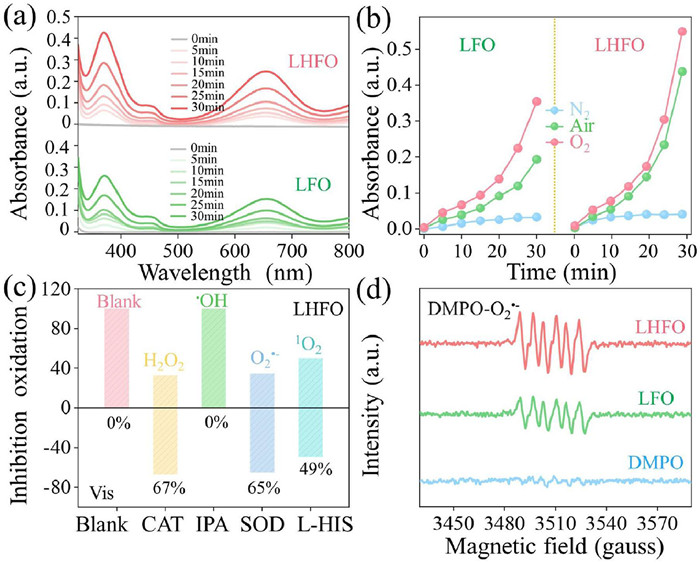
The oxygen activation capacity of the catalysts was quantitatively assessed through colorimetric monitoring of 3,3′,5,5′–tetramethylbenzidine (TMB) oxidation, a well–established protocol for evaluating photocatalytic ROS generation efficiency. As shown in Fig. 3a, the absorption spectrum of TMB solution under visible light indicates that both systems produce reactive oxygen species, and the oxidation efficiency of LHFO is significantly higher than that of LFO. Obviously, the oxidation rates of TMB are significantly different in O2, air and N2, indicating that the reactive oxygen species produced are converted by oxygen (Fig. 3b). Subsequently, in order to illustrate the type of ROS during TMB oxidation, isopropanol, superoxide dismutase (SOD), L-histidine and catalase were introduced into the photocatalytic system as scavengers to specifically restrain the generation of •OH, O2•−, 1O2 and H2O2 [36]. As illustrated in Fig. 3c, SOD, l-histidine and catalase reduced the TMB oxidation significantly, indicating that the main active species generated in the photocatalytic process of LHFO are O2•− and 1O2 and H2O2. However, isopropanol not changed the TMB oxidation, indicating not produce •OH in the catalytic process. Furthermore, electron paramagnetic resonance (EPR) capture measurements are used to directly recognize the type of ROS. As illustrated in Fig. S9 (Supporting information), in both LFO/Vis and LHFO/Vis systems, four characteristic peaks of DMPO–•OH signal (the intensities were 1:2:2:1) are not detected, indicating that the valence band (VB) potential of H2O/•OH is higher than that of LHFO. The signal attributed to DMPO–O2•− is clearly observed in the LFO and LHFO catalytic systems (Fig. 3d and Table S7 in Supporting information), and the intensity of LHFO is significantly enhanced, proving that LHFO exhibited a better ability for O2 activation to O2•−. In addition, singlet oxygen is also identified by EPR. The LHFO system exhibits obvious enhancement of TEMP–1O2 relative to the LFO system (Fig. S10 in Supporting information). Meanwhile, the source analysis of singlet oxygen produced in LHFO was carried out, as shown in Fig. S11 (Supporting information). The signal of 1O2 in the LHFO is not obviously changed with the quenching of O2•−, indicating that most of the 1O2 comes from the energy transfer [37].
Figure 3
Figure 3.
(a) Time-dependent absorption spectra of TMB oxidation with LFO and LHFO in air. (b) The absorbance peak monitored for the product at 370 nm vs. reaction time under different gas conditions of LFO and LHFO. (c) Absorbance change over LHFO at 370 nm with different scavengers of TMB oxidation. (d) DMPO spin-trapping EPR spectra of LFO and LHFO under visible light.
Similarly, as depicted in Fig. S12 (Supporting information), DMPO–•OH is not detected in the LFO and LHFO systems under NIR light irradiation. In the LFO system, we detected the signal of TEMP–1O2, while no signals of DMPO–O2•− was detected, this is due to the energy in the near infrared is low, which is usually not enough to directly promote the dissociation of excitons, resulting in that LFO activates O2 to produce 1O2 mainly through energy transfer process. In contrast, the signal of DMPO–O2•− was observed in LHFO, but the TEMP–1O2 was suppressed, which shows that the introduction of Ho single atom successfully facilitated exciton dissociation into free charge carriers and selectively activated O2 into O2•−via a one–electron–transfer pathway [38].
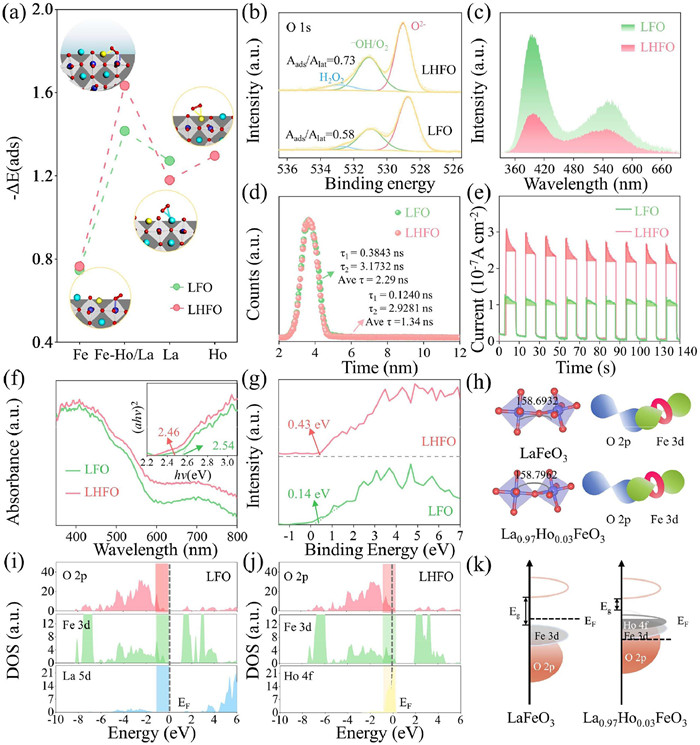
Catalytic activation of molecular oxygen involves sequential chemical absorption and bond cleavage at active sites, which constitutes a rate–determining process that controls redox efficiency in heterogeneous catalytic systems. Thereby, we used DFT theoretical calculations, O2–TPD and XPS to analyze the molecular oxygen adsorption process of LHFO. As shown in Fig. 4a, we compared the adsorption energy of different possible configurations of O2 adsorbed on as-prepared samples (Table S8 in Supporting information). Interestingly, we found that Ho (O=O) Fe formed via bridging two adjacent Fe atoms with O2 in end–pair mode has the highest absorption energy, indicating that this new structure of Ho (O=O) Fe is a preferential absorption form of O2 [39]. Furthermore, the O 1s of LHFO in Fig. 4b and Table S9 (Supporting information) was deconvoluted into three characteristic peaks, lattice oxygen (O2−) at 529.04 eV, absorbed oxygen (-OH or O2) at 531.08 eV, and absorbed molecular water at 532.88 eV. The -OH or O2/O2− ratio increases with the introduction of Ho single atom provided evidence of its significant ability to adsorb oxygen, thereby potentially enhancing its molecular oxygen activation activity. Moreover, The O2–TPD showed (Fig. S13 in Supporting information) that the desorption peak of LHFO at 175 ℃ had a higher intensity, suggesting a stronger bonding strength between LHFO and O2, which was consistent with XPS results [40]. The introduction of rare earth single atoms significantly contributes to the efficient charge separation in the LHFO, which can be explored from the view of charge–carrier dynamics. Fig. 4c shows the steady-state photo luminescence (PL) emission spectra of the LHFO and LFO. Evidently, dramatic PL quenching occurs on the LHFO relative to LFO, implying that the intrinsic radiative recombination of photogenerated electron–hole pairs in LFO themselves has been substantially inhibited. The time–resolved transient PL decay spectra recorded at the corresponding steady–state emission peaks show that the LHFO has a shorter average life–time (τavg) of charge carriers with respect to the LFO (Fig. 4d), meaning that there are more photogenerated carriers can be quickly transferred to the surface to participate in the redox process [41]. Additionally, light is a prerequisite and key driving force for bulk phase charge separation, thereby a series of photoelectrochemical characterization emission spectra were performed. Fig. 4e recorded a higher photocurrent response intensity for LHFO under visible light irradiation compared to LFO, indicating that separation efficiency of charge carriers is greatly increased. The smaller diameter of the semicircle in the Nyquist plot of LHFO further verified the significant improvement of interfacial charge transfer resistance (Fig. S14 in Supporting information). Similarly, the carrier density (Nd) for LHFO increased compared to LFO as determined from the Mott–Schottky plot (Fig. S15 in Supporting information). These findings collectively demonstrate its stronger efficiency in transferring photogenerated charge carriers compared to LFO, likely due to the introduction of 4f orbitals by the Ho single atom can temporarily store photogenerated electrons to alleviate electron–hole pair recombination [42]. Meanwhile, as shown in the charge density difference (CDD) analysis (Fig. S16 in Supporting information), the charge was redistribution after the chemisorption of O2 on the LHFO and LFO surface. More the feedback π electrons of Fe d orbital is transferred to the vacant orbital of oxygen after the introduction of Ho single atom, benefiting the production of reactive oxygen species [43,44].
Figure 4
Figure 4.
(a) The optimized structures of O2 adsorbed on LFO (112) and LHFO (112) surface at La-Fe site, La-Ho and Fe site. La: cyan, Ho: yellow, Fe: blue; O: red. (b) O 1s XPS spectra in LFO and LHFO. (c) Steady-state PL spectra. (d) TRPL decay spectra. (e) Transient photocurrent responses. (f) UV/vis diffuse reflectance spectra (inset: bandgap energy). (g) Valence band spectra of LFO and LHFO. (h) Schematic diagram for Fe-O-Fe bond hybridization at different bond angle. State density of LFO (i) and LHFO (j). (k) Schematic illustration of the d states of LFO and LHFO.
Optical properties are crucial for evaluating the catalytic performance of photocatalysts. To this end, UV–visible diffuse reflectance spectroscopy (UV–vis DRS) were conducted to evaluate the optical properties of as–prepared samples. Compared with LFO, LHFO exhibits a redshift in the optical absorption edge and shows higher absorption intensity, this is due to Ho3+ 4f-4f electronic transition can capture a wider range of spectra, improving the efficiency of light energy utilization [45,46]. According to all measurements and the Kubelka–Munk (KM) method, the band gap (Eg) for LFO and LHFO were calculated to be 2.54 and 2.46 eV (inset in Fig. 4f). As revealed by the VB XPS spectra, the maximum valence bands of LFO and LHFO are 0.14 and 0.43 eV, respectively (Fig. 4g). Obviously, the CB (−2.03 eV) of LHFO is more negative than O2/O2•− (−0.33 eV), while the VB position of LHFO and LFO is much lower than that of H2O/•OH (2.43 eV), which is consistent with the EPR results [47]. Furthermore, for perovskites, valence band (VB) is mainly caused by the anti–bond overlap of the orbitals of the metal and oxygen atoms. As presented in Fig. 4h, the introduction of Ho in the A site contracts the angle of Fe-O-Fe increases from 158.6932° (LFO) to 158.7962° (LHFO), indicating that increasing overlap between the metallic and oxygen d–p orbitals, causing an upward shift of the VB, ultimately contributing to a reduced bandgap. The densities of states (DOS) of LHFO and LFO, were calculated to gain insights into the reasons for the enhanced catalytic efficiency of LHFO. As shown in Figs. 4i and j, the DOS results showed that the d-band center of LHFO (−5.048 eV) was closer to the Fermi level than that of LFO (−5.745 eV) leads to an upward shift of the antibonding states of the Fe atom, decreasing the difficulty of O2 activation. LHFO had a new occupied state dominated by Ho 4f at the Fermi level compared with LFO, resulting in Ho (O=O) Fe conspicuously exhibits an augmented overlap of the Fe 3d, O 2p and Ho 4f orbitals (Fig. 4k), demonstrating to a more extensive electron delocalization over the Ho (O=O) Fe and a stronger binding ability of Fe and Ho for O2 [48].
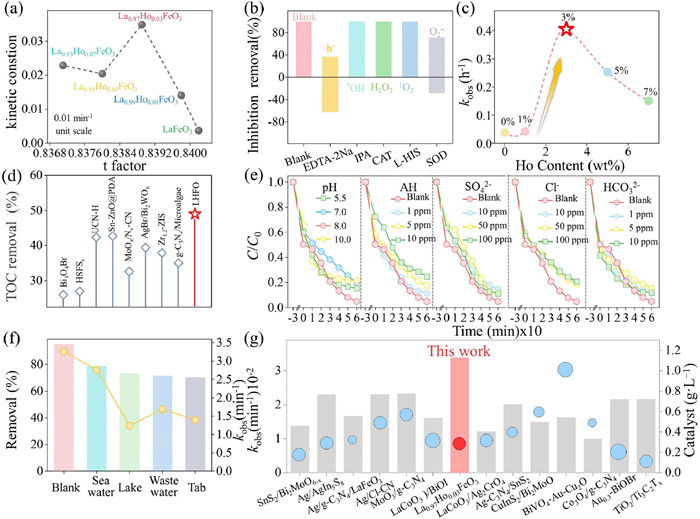
To evaluate the reaction activity of LHFO, the oxidative degradation of tetracycline (TC) was selected as a reaction model. According to above experiments and theoretical simulation, the partial substitution of Ho ions in A-site of perovskite will cause the surface reconstruction of the active phase B-site elements, promote molecular oxygen activation, and produce a large number of highly ROS, which may be beneficial to the degradation of pollutants in water. To confirm this conclusion, the tolerance factor (t) of each sample was calculated to investigate the relationship between lattice distortion and catalytic activity. As shown in Fig. 5a, the volcano like relationship curve shows that the catalytic activity does not increase monotonically with the tolerance factors, where the appropriate lattice distortion contributes to superior activity. At the same time, it can be observed that the catalyst with LHFO appears on the top of the volcano and exhibits the best catalytic activity. Also, a 0.03491 min−1 the rate constants (kobs) in LHFO system, which is 9.5 times higher than that of LFO (0.00368 min−1). This indicates that controlled Ho doping in LHFO can synergistically modulate both bulk–phase and interfacial electronic configurations, thereby enhancing molecular oxygen activation efficiency to drive superior pollutant degradation performance. For the sake of clarifying the type of ROS during photocatalytic, the trapping experiments were carried out to explore the possible intermediate reactive species. It was observed that •OH, H2O2 and 1O2 scavengers had no obvious inhibition on the degradation of TC, while adding O2•−, h+ scavengers the oxidation efficiency of LHFO demonstrated various degrees of inhibition revealing that the O2•− can cooperate with h+ to decompose TC into various intermediates and eventually mineralize it into H2O and CO2. (Fig. 5b). Additionally, despite under the irradiation of NIR, the TC removal efficiency of LHFO can reach 79% within 180 min. For a quantitative comparison of kinetics, the pseudo-first-order rate constant (kobs) and correlation coefficient were calculated (Fig. 5c and Fig. S17 in Supporting information). It can be seen that the rate constants (kobs) for LHFO exhibit the highest value of 0.4048 h−1, which is almost 10.6 times higher than with LFO. The mineralization ability of LHFO photocatalysts is ulteriorly demonstrated by TOC measurement. After 4 h of visible light irradiation (Fig. 5d and Table S10 in Supporting information), the LHFO achieved a remarkable TC mineralization rate of 49%, significantly surpassing values reported in prior studies. This result unequivocally demonstrates its superior capability for complete antibiotic mineralization into H2O and CO2. Furthermore, the stability test showed that LFO can maintain high activities during different treatment cycles (Fig. S18 in Supporting information) and the microstructure of LHFO remained unchanged even after five cycles (Fig. S19 in Supporting information), indicating the excellent stability of LHFO. Moreover, apart from TC, the LHFO also achieved an efficient removal for a wide type of organic micropollutants including MB, ONR, and DOXY, suggesting that LHFO systems are broadly adaptable (Fig. S20 in Supporting information). The practical application of catalysts in antibiotic wastewater treatment is critically influenced by multiple operational parameters, including wastewater pH, dissolved natural organic matter (NOM), and coexisting anions (e.g., Cl-, SO42-, HCO3-), which collectively govern catalyst stability, ROS generation efficiency, and pollutant degradation pathways. In general, the initial pH of the solution can impact TC degradation by affecting the morphology of TC. As depicted in Fig. 5e, the degradation efficiency of LHFO was slightly impeded under both acidic and alkaline conditions compared to neutral conditions. Similarly, some inorganic anions (Cl−, SO42−, HCO32−, etc.) and natural organic matter (HA) coexist in the real aquatic environment and have different effects on the degradation process of TC. Notably, the TC degradation rate, with increasing initial AH concentration from 1 ppm to 10 ppm, slightly decreased, which is consistent with the pH experiment, while adding inorganic anion have almost no effect on the removal efficiency of TC, indicating its potential application in the actual complex water environment. To verify the TC degradation performance of the LHFO photocatalytic system in real aquatic environments, this study conducted degradation tests using lake water, seawater, tap water, and secondary wastewater as matrices. The results (Fig. 5f) demonstrated that LHFO exhibited the highest TC degradation efficiency in seawater. This unique characteristic makes LHFO application value for antibiotic pollution control in marine environments, including applications in the management of seawater antibiotic pollution, especially suitable for scenarios such as aquaculture farms, coastal sewage treatment plants and marine pollution emergency treatment, showing broad practical potential. In addition, LHFO exhibited excellent pollutant removal performance in comparison to other reported catalysts in recently literatures for the TC degradation, while also exhibiting a lower catalyst dosage than the majority of photocatalysts, showing strong environmental remediation capabilities (Fig. 5g and Table S11 in Supporting information).
Figure 5
Figure 5.
(a) The lattice distortion dependent contaminant degradation. (b) The photocatalytic degradation efficiencies of TC (20 mg/L) by LHFO with different scavengers (Calculate the contribution rate of various sacrificial agents based on the original degradation efficiency). (c) Pseudo-first-order kinetics curves of different catalysts under NIR lights irradiation. (d) The reported TOC removal rate of catalysts for photocatalytic degradation. (e) Effects of different inorganic anions, humic acids. (f) The degradation rate of TC in different water bodies by LHFO. (g) Performance and catalyst usage comparison of reported catalysts.
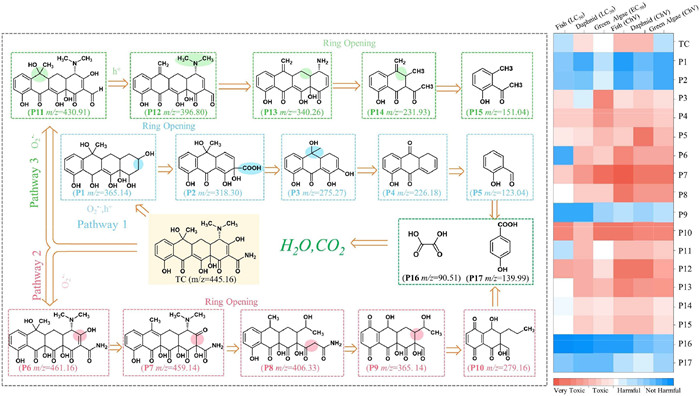
To further understand the degradation pathway and mechanism of TC degradation in LHFO/Vis system, the intermediates of TC were screened by LC–MS (Fig. S21 in Supporting information). From the tentatively identified 17 intermediates and related reports, Fig. 6 proposes three possible pathways for photocatalytic degradation of TC by LHFO. In pathway I, TC attacks the amide group via the electrophilic radical h+ to form P1 (m/z 365.14), then the P1 is broken to P2 (m/z 318.30) by breaking the C—C bond [49]. The P2 is further broken to P3 (m/z 274.27) by deacetylation and oxidation reactions. After further ring-opening and other reactions, the small molecular reactant P4 with m/z 226.18 and P5 with m/z 123.04 is finally formed [50]. In pathway II, TC was attacked by ROS group to form P6 (m/z 461.16). As the reaction continued, P6 molecule can be decomposed to P7 (m/z 459.14) via dehydration. Next, the cyclic hydrocarbon structure of P6 was opened by O2•- to produce P8 (m/z 406.33) [51]. The P8 was successively demethylated and deamidated to give P9 (m/z 365.14). Subsequently, P9 underwent double bond breaking to form P10 (m/z 279.16). In the case of pathway III, the amino group of TC molecule is removed under the reaction of O2•− to form the product P11 with m/z 430.91 [52]. Gradually, under the action of h+ and O2•− the detachment of methyl or hydroxyl groups resulted in the conversion of TC into products P12 (m/z 396.80) and P13 (m/z 340.26). After further ring-opening and other reactions, the small molecular reactant P14 (m/z 231.93) and P15 (m/z 151.04) is finally formed. These secondary intermediates are further oxidized and gradually form small molecular organic P16 (m/z 90.51) and P17 (m/z 139.99), ultimately resulting in their mineralization into H2O, CO2, and inorganic salt ions.
Figure 6
Figure 6.
Possible catalytic degradation pathway of TC in photocatalytic oxidation process and toxicity indicators of parent TC and its degradation products.
The ecotoxicity of TC and its intermediates (P1-P17) was analyzed by toxicity estimation software tool (ECOSAR) using QSAR as an indicator (Fig. S22 and Table S12 in Supporting information). The acute toxicity was reckoned as LC50 for fish and daphnia, and EC50 for green algae, and these results are 61.4, 4.49 and 10.24 mg/L for original TC, respectively. Chronic toxicity values (ChVs) of TC are 0.96, 1.04, and 2.52 mg/L for fish, daphnia, and green algae. This shows that TC is classified as a highly toxic compound to aquatic organisms according to the European Union criteria and Chinese hazard evaluation guidelines of new chemical substances (HJ/T 154–2004). For the chronic and acute toxicities of degradation products, most intermediates are toxic to three aquatic organisms. Encouragingly, among the three reaction pathways, we found that the chronic and acute toxicities of the final degradation products were harmless to aquatic organisms. In summary, these products could be further detoxified by reactive species through decomposing and transforming to CO2 and H2O with sufficient treated time, which further confirms LHFO potential advantages in water purification. To evaluate the practical applicability of the LHFO/vis system, we conducted continuous-flow experiments. As shown in Figs. S23a and b (Supporting information) show the wastewater treatment flow diagram for the practical application of the LHFO catalyst and the structural diagram of the active species generation device, respectively. Using TC as an indicator of organic pollutant removal, as shown in Fig. S23c (Supporting information), the LHFO system still maintains a TC removal rate of more than 90% even after continuous operation for 1200 min. This indicates that the active species generation unit can consistently and efficiently activate O2 to produce ROS. The above discussion demonstrates that our LHFO catalyst holds broad potential for practical applications. Then, the energy cost for TC degradation in the fast reactor system was evaluated using the EE/O method (Text S7 in Supporting information). The results demonstrate that the total energy consumption of the LHFO/Vis system (3.38 kWh/L) is significantly lower than that of the LFO/Vis system (27.99 kWh/L), further confirming the practical feasibility of the LHFO/vis system.
In conclusion, we have successfully illustrated an enhanced oxygen activation mechanism by modulating the electronic configuration of the B-site metal centers through precise A-site management in perovskite LaFeO3 oxides. The introduction of Ho single atom increases the valence state of the B site, providing a substantial number of photogenerated carriers with strong redox capabilities for molecular oxygen activation and ensuring the thermodynamic conditions for O2•− and 1O2 generation. DFT results showed partial Ho substitutions at the A–position create a new occupied state dominated by Ho 4f at the Fermi level, which leads to an expansion of the DOS near the Fermi level, enhances the adsorption strength of oxygen, and is conducive to the activation of molecular oxygen. Experimental observations indicate that during the simulated degradation reaction of TC in aqueous solution, under continuous attack by high concentrations of ROS, LHFO achieves a degradation rate exceeding 95% for 20 ppm TC within 60 min, with a kinetic constant of 0.03491 min−1. The findings suggest a practical approach for modulating transition metal electronic structure in perovskite oxide catalysts through A-site management, highlighting the strong interdependence between the components at each position during activation of molecular oxygen, and providing an innovative method to design perovskite oxides calcium titanium oxide catalysts.
Declaration of competing interest
The authors declare that they have no known competing financial interests or personal relationships that could have appeared to influence the work reported in this paper.
CRediT authorship contribution statement
Lin Cai: Writing – original draft. Lina Su: Writing – review & editing, Writing – original draft. Zhiruo Zhou: Data curation. Jianhua Liu: Data curation. Li Li: Data curation. Fengyang Yu: Data curation. Jiaqi Li: Data curation. Wenjin Wang: Data curation. Pengfei Wang: Data curation. Sihui Zhan: Writing – review & editing.
Acknowledgments
The authors gratefully acknowledge the financially support by the Natural Science Foundation of China projects (Nos. 22402169, 22466034, 22225604 and U24A20518), the Natural Science Foundation of Xinjiang Uygur Autonomous Region (No. 2022D01C668), the Basic Scientific Research Business Fee Scientific Research Project-Cultivation Project of Universities in Xinjiang Uygur Autonomous Region (No. XJEDU2024P015).
Supplementary materials
Supplementary material associated with this article can be found, in the online version, at doi:10.1016/j.cclet.2025.112158.
Q. Li, Q. Zhou, H. Deng, et al., Appl. Catal. B: Environ. Energy 360 (2025) 124533. doi: 10.1016/j.apcatb.2024.124533
Figure 1
(a) XRD patterns of LFO, 1-LHFO, 3-LHFO, 5-LHFO and 7-LHFO powders. Refined XRD of LFO (b) and LHFO (c). (d) Raman spectra of LFO and LHFO. (e) Schematic model of Ho doped LFO perovskite. HRTEM image of LHFO (f) and (g). (h) HAADF-TEM image and the corresponding EDS element (Ho, La, Fe, O) mappings of the LHFO.
Figure 2
(a) Ho K-edge EXAFS analysis of LHFO at R space. (b) Fe K-edge XANES spectra (inset: enlarged view of the absorption edge position) of LFO, LHFO, Fe foil, FeO, and Fe2O3. (c) Fe K-edge FT-EXAFS spectra of LFO and LHFO. (d) Fe 2p XPS spectra in LFO and LHFO. (e) Comparison of Fe2+, Fe3+and Fe4+ contents in LFO and LHFO. (f) La 3d XPS spectra in LFO and LHFO.
Figure 3
(a) Time-dependent absorption spectra of TMB oxidation with LFO and LHFO in air. (b) The absorbance peak monitored for the product at 370 nm vs. reaction time under different gas conditions of LFO and LHFO. (c) Absorbance change over LHFO at 370 nm with different scavengers of TMB oxidation. (d) DMPO spin-trapping EPR spectra of LFO and LHFO under visible light.
Figure 4
(a) The optimized structures of O2 adsorbed on LFO (112) and LHFO (112) surface at La-Fe site, La-Ho and Fe site. La: cyan, Ho: yellow, Fe: blue; O: red. (b) O 1s XPS spectra in LFO and LHFO. (c) Steady-state PL spectra. (d) TRPL decay spectra. (e) Transient photocurrent responses. (f) UV/vis diffuse reflectance spectra (inset: bandgap energy). (g) Valence band spectra of LFO and LHFO. (h) Schematic diagram for Fe-O-Fe bond hybridization at different bond angle. State density of LFO (i) and LHFO (j). (k) Schematic illustration of the d states of LFO and LHFO.
Figure 5
(a) The lattice distortion dependent contaminant degradation. (b) The photocatalytic degradation efficiencies of TC (20 mg/L) by LHFO with different scavengers (Calculate the contribution rate of various sacrificial agents based on the original degradation efficiency). (c) Pseudo-first-order kinetics curves of different catalysts under NIR lights irradiation. (d) The reported TOC removal rate of catalysts for photocatalytic degradation. (e) Effects of different inorganic anions, humic acids. (f) The degradation rate of TC in different water bodies by LHFO. (g) Performance and catalyst usage comparison of reported catalysts.
Figure 6
Possible catalytic degradation pathway of TC in photocatalytic oxidation process and toxicity indicators of parent TC and its degradation products.

 DownLoad:

 下载:
下载:


 下载:
下载:
