Hunan Province Key Laboratory for Advanced Carbon Materials and Applied Technology, College of Materials Science and Engineering, Hunan University, Changsha 410082, China
b.
College of Resources and Environment, University of Chinese Academy of Sciences, Beijing 101408, China
Received Date:
13 June 2025 Accepted Date:
21 November 2025 Revised Date:
22 October 2025 Available Online:
15 July 2026
Abstract:
Catalytic oxidation of H2S at room temperature has been regarded as a promising method for removing malodorous H2S pollution. However, most of the existing research has primarily focused on developing catalysts with high sulfur capacity, i.e., high elemental sulfur selectivity, which was unfavored for the catalyst regeneration. The present work prioritizes efficient water wash regeneration as a key objective. A series of activated carbon fibers (ACFs) was synthesized using a synergistic strategy of "nitrogen doping-plasma defect engineering". The certain amount of nitrogen species ensured a certain level of sulfur capacity. The plasma defect engineering can result in the enhancement of surface acidity and defect density, which worked together to make the catalyst with high sulfate selectivity. The O2-plasma modified NH3-ACF-O10 catalyst achieved the best catalytic performance with appropriate sulfur capacity (0.21 g/g) and highest sulfate selectivity (85.40%). Importantly, it can be easily regenerated by water wash, and almost 83.33% sulfur capacity can be recovered. Besides, superoxide radicals (O2•-) were identified as the primary reactive oxygen species for the reaction. And the reaction obeyed a Langmuir-Hinshelwood (L-H) like mechanism, i.e., the reaction was proceeded via chemisorbed H2S and O2•-, which was adsorbed and activated by defect.
In recent years, the issue of odor control has become increasingly significant due to the rising civil complaints and growing concerns regarding environmental and public health [1–3]. The primary gas responsible for malodor is hydrogen sulfide (H2S), which is emitted at high concentrations (around 100 ppm) and presents a considerable challenge in pollution management due to its extremely low olfactory threshold [4,5]. Currently, a variety of methods have been developed to remove H2S, including in situ precipitation, absorption, and room-temperature catalytic oxidation, among others [6,7].
Among various catalytic methods, H2S catalytic oxidation at room temperature is regarded as the most promising due to its simplicity and cost-effectiveness [4]. During the reaction, H2S reacts catalytically with oxygen under moist conditions to produce elemental sulfur and sulfate. As the reaction progresses, the products accumulate in the catalyst's pores and on its surface until its storage capacity becomes fully saturated [8,9]. Therefore, identifying suitable catalysts has become the central focus for optimizing this process. Significant progress has been made in the field of metal oxide catalysts, and a deeper understanding of the underlying reaction mechanisms has led to the development of advanced catalytic materials [10–12]. However, due to their inherent susceptibility to deactivation under humid and sulfur-rich conditions, metal oxides are not well-suited for this process. In contrast, carbon-based catalysts are emerging as promising candidates for room-temperature H2S oxidation, owing to their tunable surface chemistry and high specific surface area [13–15]. Nevertheless, the catalytic efficiency of pure carbon materials is limited by the absence of both basic and active sites. To enhance the catalytic performance of carbon-based materials, various strategies have been adopted, including heteroatom doping and metal single-atom modification, which enable efficient and selective oxidation of H2S [16–19]. Among these strategies, nitrogen doping has become one of the most prominent methods for enhancing the sulfur capacity of carbon materials [20–22]. Nitrogen atoms, due to their difference in electronegativity, act as Lewis basic sites, facilitating the adsorption and dissociation of H2S [23,24]. However, the practical application of nitrogen-doped carbon materials is significantly hindered by regeneration challenges. A higher sulfur capacity often leads to elemental sulfur as the primary reaction product, which is difficult to remove from the catalyst surface, thus limiting the catalyst's long-term performance.
It is worth noting that the catalyst can be regenerated readily using a water-wash method if the predominant product of the reaction can be shifted to water-soluble sulfate, that is, the catalyst with high sulfate selectivity. Extensive research has demonstrated that both porosity and surface acidity are important for the sulfate selectivity [25–27]. It is believed that acidic surfaces and small micropores (pore size less than 0.7 nm) are conducive to sulfate formation [8,28,29]. However, it is reported that the sulfate selectivity can only reach 52.58% through the modification of the catalyst's porosity and surface acidity [30]. Significantly, superoxide radicals (O2•-) have been detected during the reaction over modified carbon materials in recent studies, which can lead to the direct oxidation of H2S to sulfate by considering the highly reactive of these radicals. At the current stage of knowledge, ultra-micropores, carbon defect sites and doped heteroatoms (N, S, B, P) can be regarded as active sites that activate O2 to form O2•- [31–34].
Therefore, more radical active sites lead to the generation of more radicals, and consequently, high sulfated selectivity can be achieved. Enhancing the defect density on the surface of carbon materials has emerged as a key strategy to boost radical generation and improve sulfate selectivity, especially in light of the limited heteroatom content in the carbon framework and the higher mass transfer resistance associated with ultra-micropores during the reaction. However, it should be noted that the achievement of both high sulfate selectivity and high sulfur capacity is inherently contradictory in principle. Namely, high sulfate selectivity always means relative low sulfur capacity.
Therefore, developing catalyst with both high sulfate selectivity and appropriate sulfur capacity is a major challenge.
In the present work, a "nitrogen doping-defect engineering" synergy strategy was employed out on activated carbon fibers (ACFs) materials. First, ACFs were treated and activated under an ammonia atmosphere. Plasma defect engineering was then further applied to modify the nitrogen-doped ACFs. Hence, the doped nitrogen species can serve as basic sites and enhance the sulfur capacity. Meanwhile, the plasma treatment, in combination with NH3 etching, can introduce defects on the surface of ACFs and facilitate the activation of oxygen to radicals. Additionally, the doped nitrogen atoms can contribute to the formation of defects as well and can be considered as extrinsic defects. Subsequently, the catalytic performance, regeneration performance, and the reaction mechanism were thoroughly evaluated and investigated.
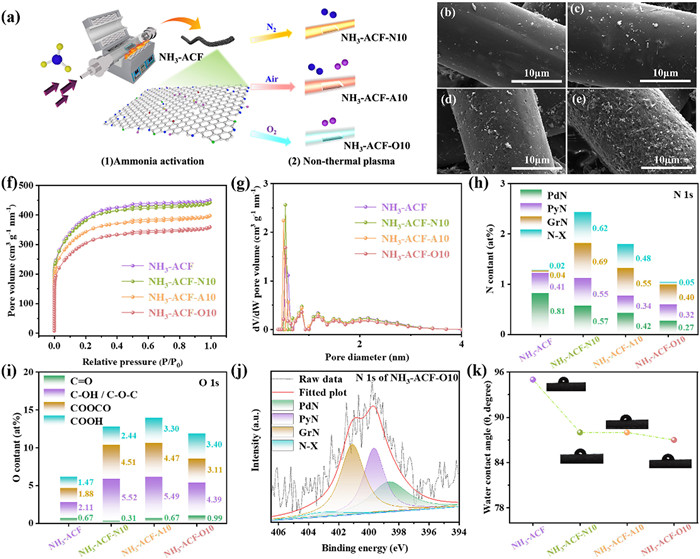
Fig. 1a showed the preparation process of plasma engineered N doped ACFs. The SEM images of the modified ACFs were depicted in Figs. 1b-e. It is shown that ACFs exhibited a rough surface after plasma-modified due to the plasma etching, where the active species (N2, air and O2) colliding with the surface. Additionally, it was evident that the extent of surface roughness strongly depended on the reactivity of the active species (N2 < air < O2) and followed the order: NH3-ACF-N10 < NH3-ACF-A10 < NH3-ACF-O10. Among these, NH3-ACF-O10 exhibited the highest surface roughness.
Figure 1
Figure 1.
(a) The preparation of NH3-ACFs and NH3-ACF-X, SEM images of NH3-ACF (b), NH3-ACF-N10 (c), NH3-ACF-A10 (d), and NH3-ACF-O10 (e). N2 adsorption-desorption isotherms (f), pore size distribution (g), the composition of nitrogen species (h), the composition of oxygen species (i), the high-resolution N 1s XPS spectra of NH3-ACF-O10 (j) and water contact angle of ACFs (k).
The N2 adsorption-desorption isotherms of the synthesized ACFs were presented in Fig. 1f. All isotherms exhibited the characteristics of typical type I, indicating that all the samples were dominated by micropore structures [35–37]. Table 1 summarized the specific surface area, pore volume, and pore size of the prepared ACFs. It was noteworthy that both the SBET and pore volume decreased markedly after plasma treatment. Specifically, the values were 1366, 1332, 1212, and 1064 m2/g for NH3-ACF, NH3-ACF-N10, NH3-ACF-A10 and NH3-ACF-O10, respectively. Moreover, the decreasing trend was in perfect agreement with the increase in surface roughness. In other words, the greater the reactivity of the active species, the more pores collapsed, leading to a reduction in both the SBET and Vtot. However, plasma modification had minimal impact on pore size and distribution, as illustrated in Fig. 1g, where all samples displayed comparable pore dimensions.
XPS analysis was additionally performed to examine the chemical composition and characteristics of the prepared ACFs. The spectra (Fig. S1 in Supporting information) revealed that C, N, O elements are presented on the surface for all the samples, indicating the successfully introduction of nitrogen species. Regarding surface nitrogen content, as shown in Fig. 1h, it was 1.28, 2.43, 1.79, and 1.04 at% for NH3-ACF, NH3-ACF-N10, NH3-ACF-A10 and NH3-ACF-O10, respectively. In other words, the nitrogen content increased after N2 and air plasma modification, however, decreased after O2 plasma. Meanwhile, the surface oxygen content increased significantly for all the plasma modified samples. As demonstrated in Fig. 1i, the content of surface oxygen content in the NH3-ACF, NH3-ACF-N10, NH3-ACF-A10 and NH3-ACF-O10 ranges were 6.13, 12.78, 13.93, and 11.89 at%, respectively. As is known that the plasma modification process is comprised of two distinct stages. The initial stage encompasses the introduction of nitrogen and oxygen containing functional groups. However, for the second stage, the carbon atom, the introduced nitrogen and oxygen atoms will be further removed partially as processing time progresses and plasma power increased [38]. Therefore, both the nitrogen and oxygen content of NH3-ACF-A10 and NH3-ACF-O10 catalysts decreased significantly compared with NH3-ACF-N10, which can be explained by the fact that the active substances air and oxygen can cause more oxygen and nitrogen species remove in the second stage. It was noteworthy that the removal of carbon and nitrogen atoms from the carbon framework may lead to the creation of vacancies due to the rearrangement of the sp2 hybridized carbon network [34,39,40]. This observation reinforced the notion that plasma modification effectively promoted the formation of defects on the catalyst surface. More important, the N content of the prepared catalyst was extremely low comparing to the literature reports, which was in the range of 5.00–20.00 at% [21,22,24].
Moreover, as depicted in Fig. S2 (Supporting information), the oxygen species were further classified into C=O species (531.1 eV), C—OH/C—O-C species (532.2 eV), COOCO species (533.3 eV) and COOH species (534.2 eV) [41]. In a similar manner, the N 1s spectra (Fig. 1j and Fig. S3 in Supporting information) were deconvoluted into four peaks corresponding to binding energies of 398.5, 400.0, 401.0 and 403.0 eV, attributable to pyridinic-N atoms (PdN), pyrroline-N atoms (PyN), quaternary-N atoms (GrN), and pyridine-N-oxide (N-X), respectively [42]. Notably, PdN content decreased significantly after plasma modification due to the transformation of nitrogen species to the more stable GrN and N-X species under the high energy of the plasma process. The PdN content was 0.81, 0.57, 0.42, and 0.27 at% for NH3-ACF, NH3-ACF-N10, NH3-ACF-A10 and NH3-ACF-O10, respectively. PdN was considered the most important nitrogen species for the reaction because it provided basic anchoring sites to capture acidic H2S. As illustrated in Fig. 1k, the water contact angles of the plasma-modified ACFs did not exhibit significant differences. Specifically, the water contact angles of NH3-ACF, NH3-ACF-N10, NH3-ACF-A10, and NH3-ACF-O10 were measured at 95°, 88°, 88°, and 87°, respectively. However, the hydrophilic properties were slightly enhanced after plasma modification, which could be attributed to the relatively increased content of oxygen-containing functional groups.
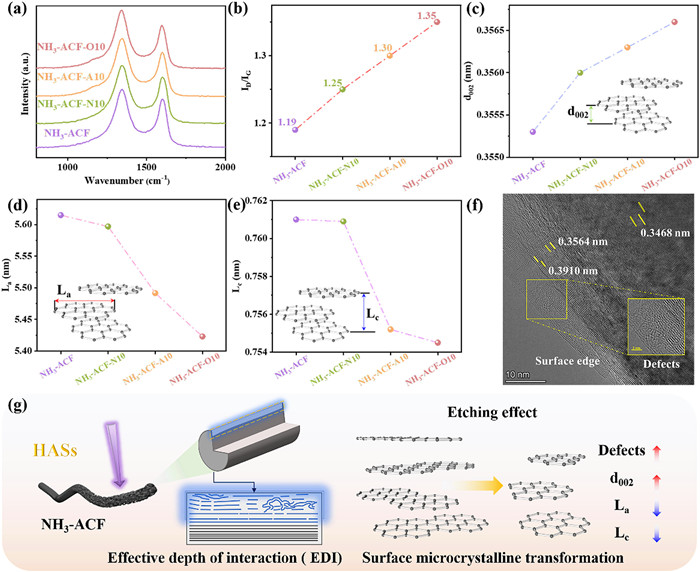
As illustrated in Fig. 2a, Raman spectroscopy was used to analyze the intensity ratio of the d-band to the G-band (ID/IG) in the ACFs, which was sensitive to defects [24]. The findings shown an increase in the ID/IG ratio for all plasma-modified samples (Fig. 2b), with values of 1.19, 1.25, 1.30 and 1.35 for NH3-ACF, NH3-ACF-N10, NH3-ACF-A10 and NH3-ACF-O10, respectively. To further analysis defect density (nD, cm-2), the following Cançado's equation Eq. 1 was used to quantify [43].
Figure 2.
Raman spectra (a), ID/IG values (b), d002, La and Lc values (c-e) of ACFs. HRTEM images of NH3-ACF-O10 (f), and mechanism of plasma modification on microscopic crystal structure (g).
where EL is specified as excitation energy, which is set to 2.41 eV in this work.
As demonstrated in Table S1 (Supporting information), upon subjecting the samples to plasma treatment, the observed change in nD values exhibited consistency with ID/IG, with NH3-ACF-O10 demonstrating the highest nD value, reaching 4.33 × 1011 cm-2. In other words, the defect density was significantly increased after plasma modification, which was consistent with the XPS results. Notably, the NH3-ACF-O10 catalyst exhibited the highest defect density among the catalysts. The XRD spectrum was shown in Fig. S4 (Supporting information). All samples exhibited a typical microcrystalline graphite-like feature with a prominent (002) diffraction peak around 24° and a weaker (100) peak near 43° [44,45], indicating a typical microcrystalline graphite-like structure.
Moreover, the interlayer spacing (d002), and the La and Lc values (shown in Figs. 2c-e) increased and decreased for the plasma-modified ACFs, respectively. The decrease in interlayer spacing indicated a reduction in van der Waals forces, potentially enhancing the interaction of reactive species with graphite microcrystals. La and Lc were known to represent the average size of graphite crystals in the plane along the a axis, as well as the thickness of graphite planes stacked along the c axis, which was perpendicular to the aforementioned plane. This further confirmed the damage to the surface crystal structure of ACFs caused by plasma modification, suggesting the formation of defects. As depicted in Fig. 2f, the TEM results reveal the previously mentioned increase in layer spacing, while the locally magnified images illustrated the short-range ordering of surface microcrystals and the fracturing of lattice planes, further confirming the formation of defects. Fig. 2g summarized the mechanism of plasma modification and the resulting transformation of the microcrystalline structure of ACFs.
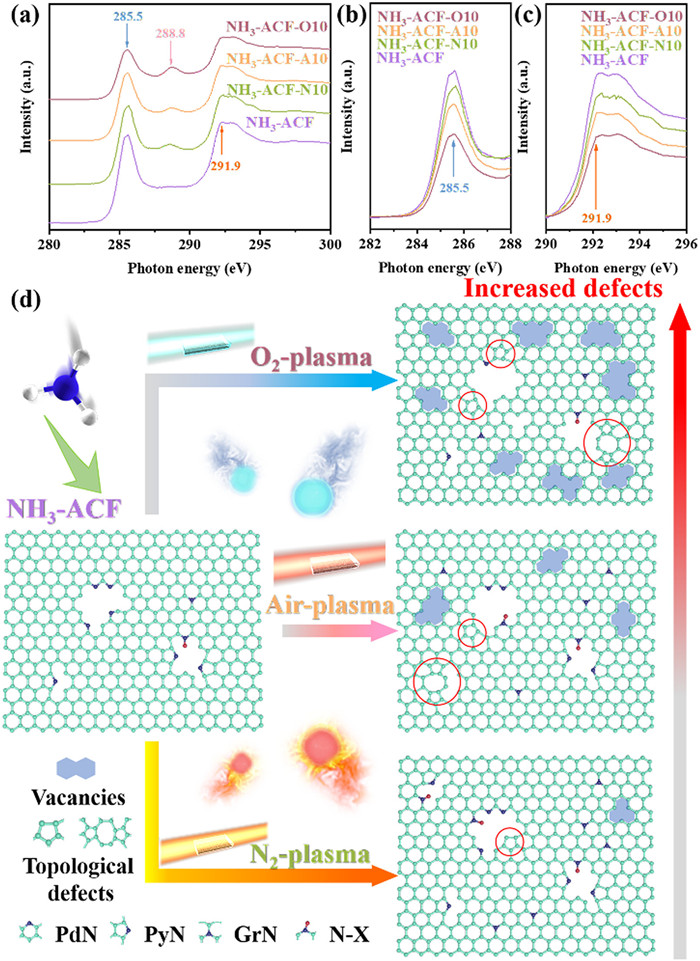
C K-edge NEXAFS spectroscopy was used to gain a more precise understanding of the carbon defects. As depicted in Fig. 3a, the minor peak observed at 288.8 eV was associated to 1s→π* resonances from oxygen-containing impurities [46]. This indicated an increase in oxygen content in the ACFs after plasma modification, which was in agreement with the XPS results. The spectra (Figs. 3b and c) shown two prominent peaks at 285.5 eV and 291.9 eV, which were attributed to 1s→π* (C=C bond-ring) transitions and 1s→σ* (C—C bond-ring) transitions in the sp2 hybridized network, respectively [39,47]. These peaks were recognized to be sensitive to strain and distortions in the carbon bonds within the sp2 hybridized network [48]. Notably, the strength of two dominant peaks decreased significantly after plasma modification, indicating that the carbon matrix was partially disrupted, leading to the formation of surface defects. Additionally, the O2 plasma modified sample exhibited the weakest peaks, suggesting it possessed the highest number of defects, which aligned with the Raman findings. As previously discussed, the presence of oxygen in the plasma process has been shown to induce partial removal of nitrogen species. Indeed, the removal of doped nitrogen has been demonstrated to create vacancies and induce the formation of topological defects. However, it also indicated that the defects primarily manifested as vacancies, given that the formation of new topological defects would result in a notable enhancement of the π* feature in the sp2 hybridized network [39,49], which contrasted with the NEXAFS results. Moreover, Fig. 3d provided a summary of the defects and specific nitrogen heteroatom transitions that occurred following plasma modification. The formed defects caused deviations in graphitic lattice, and the resulting delocalization of π electrons could, in turn, influenced the defects and altered their chemical properties.
Figure 3
Figure 3.
C K-edge NEXAFS spectra (a), expanded peaks at 285.5 eV (b) and 291.9 eV (c) of ACFs, and schematic diagram of nitrogen species and defects in ACFs (d).
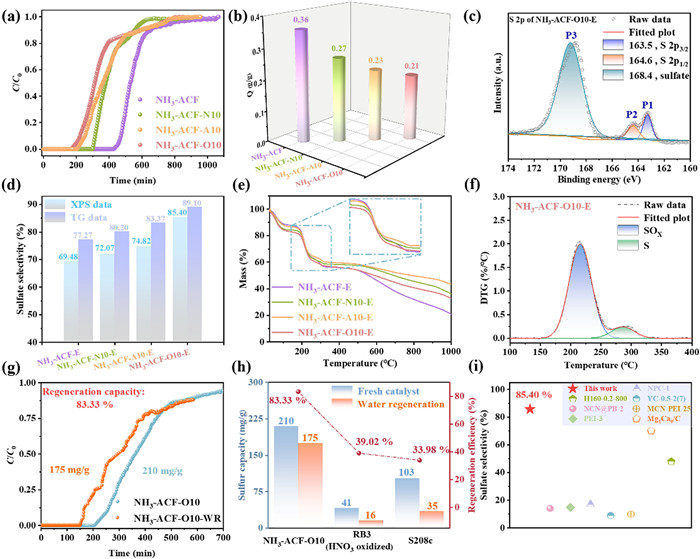
Fig. 4a illustrated the catalytic performance of the prepared ACFs. As shown in Fig. 4b, NH3-ACF achieved the highest sulfur capacity of 0.36 g/g. However, this capacity decreased to 0.27, 0.23, and 0.21 g/g for NH3-ACF-N10, NH3-ACF-A10, and NH3-ACF-O10, respectively. Notably, the pristine ACF (without nitrogen doping) exhibited an exceptionally low sulfur capacity, with a breakout time of less than 10 min, underscoring the crucial role of nitrogen doping in the reaction. In comparison with other studies on nitrogen doping, our sulfur capacity was comparatively minimal, with conventional levels ranging from 0.4 g/g to 1.8 g/g [21,22,24]. This may be attributed to the comparatively low nitrogen content in our doping.
Figure 4
Figure 4.
(a) Breakthrough curves of H2S on ACFs. (b) H2S removal capacities of ACFs. (c) S 2p spectrum of NH3-ACF-O10-E. (d) Sulfate selectivity and SOx content of ACFs. (e) TG curves of exhausted ACFs. (f) DTG-peak-deafferenting analysis of NH3-ACF-O10-E. (g) H2S breakthrough curves over NH3-ACF-O10 and NH3-ACF-O10-WR. Comparison of water regeneration (h), and comparison of sulfate selectivity (i).
XPS method was employed to investigate the sulfur-containing products of the reaction. As shown in Fig. 4c and Fig. S5 (Supporting information), the S 2p XPS spectra of all deactivated ACFs were deconvoluted into peaks attributed to elemental sulfur (163.5 and 164.6 eV) and sulfate (168.4 eV) [50], respectively. Notably, the sulfate selectivity varied among the different samples, and the results were presented in Fig. 4d. It was noted that NH3-ACF exhibited the lowest sulfate selectivity, but it still achieved a notable 69.48%. Remarkably, the sulfate selectivity increased significantly after plasma modification, reaching 72.07%, 74.82% and 85.40% for NH3-ACF-N10, NH3-ACF-A10 and NH3-ACF-O10, respectively. Additionally, the spent ACFs were analyzed by TG in a N2 atmosphere. The TG curves (Fig. 4e) shown a distinct weight loss between 150 and 350 ℃, signaling the desorption of sulfur species. The derivative thermogravimetric (DTG) curves (Fig. 4f and Fig. S6 in Supporting information) enabled the division of the weight loss into two separate peaks: One at a lower temperature associated with sulfate decomposition, and another at a higher temperature linked to the desorption of elemental sulfur [8,29,51]. It was evident that the weight loss from sulfur oxides was notably higher than that of elemental sulfur across all samples, as shown in Table S2 (Supporting information). Fig. 4d also shown the SOx content (sulfate selectivity) of all samples which are calculated by peak integration, which was 77.27%, 80.20%, 83.37% and 89.10% for NH3-ACF, NH3-ACF-N10, NH3-ACF-A10 and NH3-ACF-O10, respectively. These results were in perfect agreement with the XPS results.
Furthermore, the regeneration performance of NH3-ACF-O10 was explored using the water wash method, as described in the experimental section in Supporting information. As shown in Fig. 4g, it was noteworthy that 83.33% of sulfur capacity (175 mg/g) was recovered, indicating that nearly all the generated SOx were removed from the catalyst surface. The results were also compared with similar studies in literature (Figs. 4h and i). To the best of our knowledge, the present work demonstrated the highest sulfate selectivity [21,22,24,26,29,50], as well as the highest sulfur capacity and regeneration performance based on the water washing regeneration method [52], achieved on carbon materials to date. Although the sulfur capacity progressively declines with regeneration cycles, and achieving near-perfect sulfate selectivity (ideally 100%) remains a key challenge for practical applications, the high sulfate selectivity, combined with an appropriate sulfur capacity of 0.21 g/g, makes NH3-ACF-O10 one of the most promising candidates for practical use due to its easy regeneration. In comparison with representative heterogeneous catalysts with alternative regeneration methods, including thermal regeneration, the water-wash method maintains high capacity and regeneration performance (Table S3 in Supporting information). However, several key issues remain to be addressed, such as the primary factors governing sulfur capacity and high sulfate selectivity, as well as the underlying reaction mechanism.
For the reaction, it was assumed that H2S was initially adsorbed on the basic sites of the catalyst surface, then dissolved into the water layer to form HS-, which later reacted with reactive oxygen species to produce sulfur-containing compounds [29,53]. As mentioned in the introduction, the porosity, SBET, and surface chemistry could affect the catalytic performance greatly.
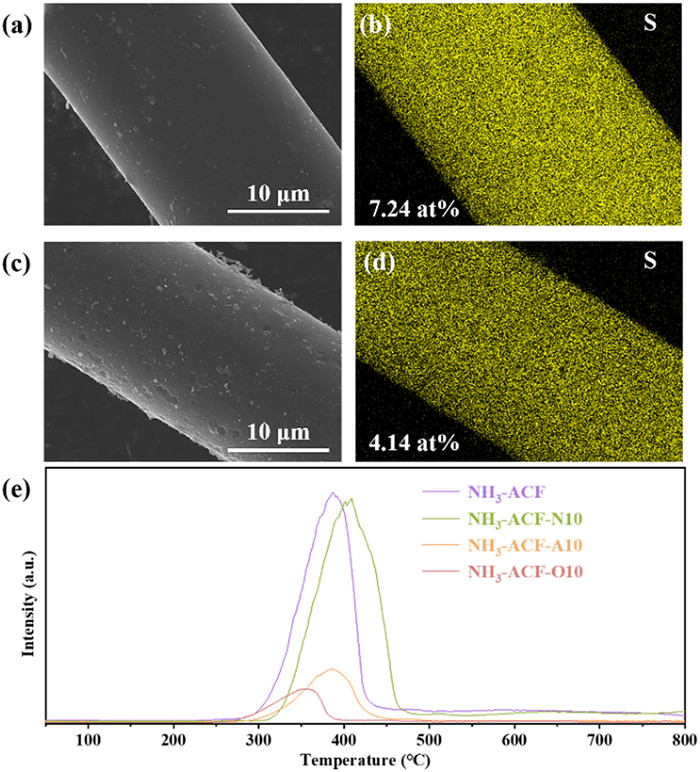
As illustrated in Figs. 5a-d, SEM-EDS analysis demonstrated that no large sulfur deposits were observed on the surface of the ACFs, and sulfur-containing species were evenly dispersed throughout the pores. At the same time, ACFs demonstrated structural stability by maintaining good surface structure even after deactivation. Subsequently, regression analysis was performed to evaluate how pore structure influenced both sulfur capacity and sulfate selectivity. Figs. S7a-d (Supporting information) shown linear fit plots between the sulfur capacity and the Vtot, SBET, Vmic and Vmes of the prepared ACFs, with R2 values of 0.78, 0.71, 0.77 and 0.68, respectively. Meanwhile, the linear fit plots the sulfate/elemental sulfur content versus micropores/mesopores density were displayed in Figs. S7e and f (Supporting information), with R2 values of 0.20. The statistically insignificant correlation between sulfur capacity/sulfate selectivity and pore structure strongly indicated that the traditionally considered factors, such as Vtot, SBET, and Vmic, were no longer the primary factors governing sulfur capacity and sulfate formation for the prepared ACFs, respectively [29,30].
Figure 5
Figure 5.
Elemental mapping images with EDS of NH3-ACF-E and NH3-ACF-O10-E (a-d) and H2S-TPD profiles of ACFs (e).
The results obtained above provide a rational basis for the assumption that the deposition of sulfur-containing products on the surface basic sites is one primary cause catalyst deactivation before the occurrence of complete pore blockage by sulfur species. In essence, the surface basicity, as opposed to conventional parameters of pore structure, emerges as the pivotal factor determining sulfur capacity. It was strongly supported by the positive and negative correlation between PdN content and sulfur capacity and sulfate selectivity, respectively (Fig. S8 in Supporting information). Furthermore, the H2S-TPD (Fig. 5e) indicated that H2S was chemisorbed on the catalyst surface. The gradual weakening of the desorption peak supports the hypothesis that surface basicity decreased after plasma modification, which is consistent with the observed decrease in both sulfur capacity and PdN content.
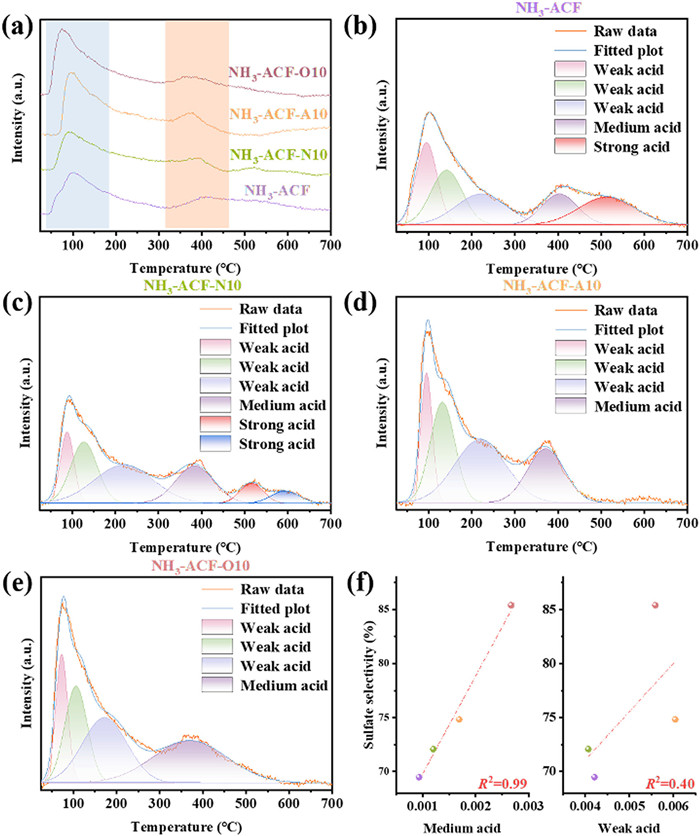
Meanwhile, surface acidity may also influence sulfate selectivity, similar to the previously mentioned limitation of basic sites. To investigate the effect of surface acidity and acid type on sulfate selectivity, NH3-TPD and Py-IR analyses were performed. As shown in Fig. 6a, the NH3 desorption profile was categorized into three regions: weak acid sites below 300 ℃, medium acid sites between 300 ℃ and 500 ℃, and strong acid sites above 500 ℃ [54,55]. Figs. 6b-e display the fitted curves for peak splitting, and the corresponding NH3 desorption peak areas were quantified and compiled in Table S4 (Supporting information). It was evident that both weak acidity and medium acidity were significantly enhanced in plasma-modified samples, primarily due to the transformation of oxygen-containing functional groups. NH3-ACF-A10 and NH3-ACF-O10 exhibited the highest amounts of weak and medium acid sites, respectively, along with the disappearance of strong acid sites. This is because oxygen-containing, high-energy active substances generated by Air and O2 plasma can oxidize the strong acidic sites, which typically contain unstable, oxygen-containing functional groups. These high-energy active substances then react with free radicals or unsaturated bonds on the carbon surface, forming new weak and medium acid sites [56]. In contrast, N2 plasma tends to dope nitrogen atoms into the carbon matrix, achieving surface acid-base regulation without directly affecting the strong acid sites [57]. It has been demonstrated that when pH < 4.5, physical adsorption of H2S does not dissolve in the water film. In the range of 4.5 < pH < 7, the dissociation of H2S is inhibited, promoting sulfate formation [8]. In the present work, the correlation between the acid sites on the catalyst surface and sulfate selectivity is clear. Regression analysis (Fig. 6f) shows that medium acid sites significantly influence sulfate selectivity (R2 = 0.99), while the influence of weak acid sites is negligible (R2 = 0.40). As anticipated, medium acid sites exhibit a negative correlation with sulfur capacity, reflecting the inherent trade-off between sulfur capacity and sulfate selectivity.
Figure 6
Figure 6.
(a) NH3-TPD profiles of ACFs. (b-e) TPD-peak-fitting analysis of ACFs, and the relationships between sulfate selectivity and acid of ACFs (f).
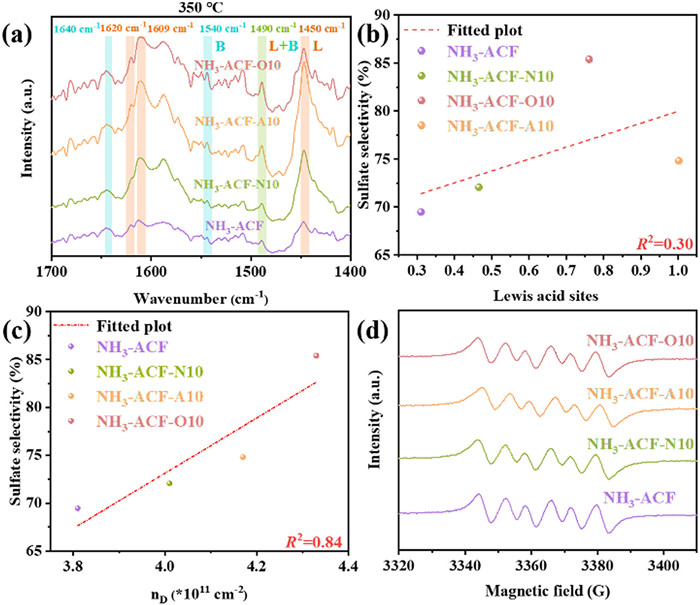
The Py-IR spectra were shown in Fig. 7a. As observed, six bands were detected in the 1300–1700 cm-1 region, absorption peaks were identified for Lewis acid sites at 1450, 1609, and 1620 cm-1, for Brønsted acid sites at 1540 and 1640 cm-1, and a combined band at 1490 cm-1, which corresponded to pyridine adsorption on both Lewis and Brønsted acid sites [58–60]. It was evident that Lewis acid sites were the predominant acidic sites in all synthesized samples, with their concentration notably increased following plasma treatment. However, contrary to expectations, NH3-ACF-A10, rather than NH3-ACF-O10, exhibited the highest Lewis acid sites concentration, which contradicts with the trends observed for sulfur capacity and sulfate selectivity. This observation suggested that the strength of the acid sites, i.e., medium acid rather than their type, was a key factor influencing catalytic performance. The poor linear correlation (R2=0.30) between sulfate selectivity and the content of Lewis acid sites (Fig. 7b) further supported this conclusion.
Figure 7
Figure 7.
(a) Pyridine-IR spectra of ACFs at 350 ℃. (b) Relationships between sulfate selectivity and Lewis acid sites of ACFs. Relationships between sulfate selectivity and the value of nD (c), and EPR spectra of ACFs (d).
The influence of defects on sulfate selectivity was also investigated. As illustrated in Fig. 7c, a significant linear correlation between the nD ratio and sulfate selectivity was observed, with an R2 value of 0.84. This indicated that defects undeniably had a considerable impact on sulfate formation. And the influence perhaps due mainly to the catalytically generating oxygen-containing free radicals with strong oxidative capabilities, which could directly oxidize H2S to sulfate. As demonstrated in Fig. S9 (Supporting information), the EPR signal intensity of the reaction oxygen vacancy (g = 2.003) content in the catalyst gradually increases with the increase in defect density. The appearance of O2•- signals in the EPR spectra of all the samples (Fig. 7d) further confirms the formation of superoxide radicals during the reaction process. Specifically, the electrons accumulated at the carbon atoms exposed around vacancies, which then reduced the adsorbed O2 to O2•- [61]. Furthermore, doped nitrogen atoms (PdN and PyN) in the carbon matrix, due to the localized unpaired electrons, could activate O2 to form oxygen-containing free radicals. This activation occurred through the conjugation and enhanced migration of π* electrons in the adjacent sp2 carbon [24,34,62].
Thus, it was clear that the further reduction of basic sites was responsible for the relative low sulfur capacity, while the enhanced surface acidity, especially medium acid, together with the increased defect density were contributed to the high sulfate selectivity.
As is well known, oxygen was crucial for the reaction, however it must first be activated into reactive oxygen species because of the stability of its triplet state with spin-paired electrons [9]. It was believed that chemically adsorbed oxygen species, oxygen-containing group, and oxygen radicals could be served as reactive oxygen species. Furthermore, it has been shown that O2•- could indeed be generated by defects and enhance the formation of sulfate. However, it remains necessary to investigate whether the other reactive oxygen species also participate during the reaction.
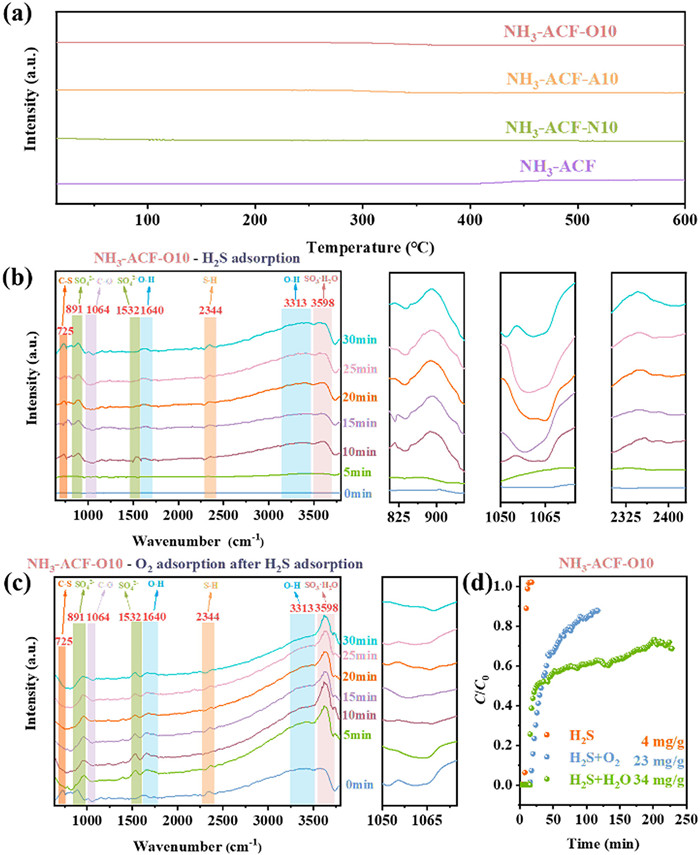
As depicted in Fig. 8a, no O2 desorption peak was detected in the O2-TPD spectra of any of the samples, indicating that the ACFs surface could not form chemically adsorbed oxygen. In other words, molecular oxygen was adsorbed exclusively at defect and further activated by defect to form O2•-. Indeed, it has proved that oxygen-containing functional groups could participate in the reaction and exert a dominant influence. Therefore, in situ DRIFTS was carried out to investigate the role of oxygen containing group. As shown in Fig. 8b, when only H2S was present in the atmosphere, the gradually intensified peak at 2344 cm-1, corresponding to the stretching of the H-S bond in H2S [14], were detected, indicating the adsorption of H2S on the surface. Additionally, the appearance of peaks at 1640 and 3313 cm-1, which corresponded to O—H stretching in H2O, together with the depletion peak at 1064 cm-1 related to the C—O species, strongly suggested that the adsorbed H2S reacted with the C—O group on the surface to form water and sulfur-containing species. This suggested that the oxygen-containing function group were involved in the reaction. Furthermore, the peaks at 3598, 1532 and 891 cm-1 were mainly ascribed to the formation of sulfur oxides, specifically SO3·H2O, S=O for tridentate sulfate, and O-S-O for chelating bidentate sulfate, respectively [21,63,64]. These findings were in perfect agreement with the above-mentioned assumption. Fig. 8c shown the infrared spectrum after introducing O2 into the atmosphere following H2S adsorption. It was clearly observed that the consumed C—O was recovered, indicating that oxygen-containing functional groups can be regenerated by molecule O2.
Figure 8
Figure 8.
(a) O2-TPD-MS profiles of ACFs. In situ DRIFTS spectra for H2S adsorption (b) and O2 adsorption after H2S adsorption on NH3-ACF-O10 (c), and breakthrough curves over NH3-ACF-O10 under different conditions (d).
Concurrently, the extent of the participation of oxygen-containing functional groups in the reaction was investigated. The related breakthrough curves were presented in Fig. 8d. It was evident that sulfur capacity of the catalyst was rather low when O2 was absent, amounting to 34 mg/g comparing to 210 mg/g when O2 was involved in the reaction. This was also in sharp contrast to the literature result, where the catalyst exhibited a sulfur capacity in the presence of H2S and H2O that was comparable to that in a coexisting system of H2S, H2O, and O2 when the oxygen containing group was regarded as the main reactive oxygen species. Thus, the possibility of oxygen containing group was the main reactive oxygen species could also be excluded. Furthermore, when only H2S and O2 were introduced into the reaction simultaneously, even with a modest amount of functional group regeneration facilitated by oxygen, there was a negligible contribution to the sulfur capacity (23 mg/g). This led to the conclusion that the O2•- was thought the main reactive oxygen species for the reaction. And water played an important role in the reaction, which not only formed water film that dissolved adsorbed H2S and reactive oxygen species, but also acted as a conveyor belt to transport the generated sulfur species for storage on the surface and within the pore channels.
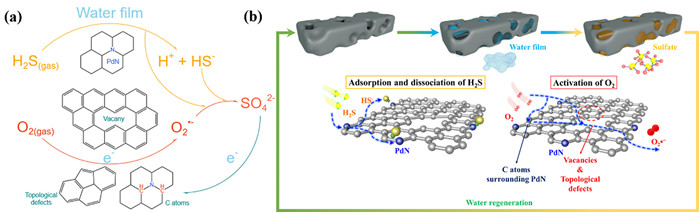
Based on the above analysis, the reaction mechanism over the prepared ACFs could be tentatively proposed as following (Fig. 9):
(1) H2S was chemisorbed on the basic sites of catalysts, i.e., the doped N species, specially PdN species. However, the adsorption capacity was relatively low due to the low content of PdN content. Finally, the adsorbed H2S dissolved in the water film in the form of HS-.
(2) the molecular O2 was adsorbed on the defects (mainly in the form of vacancy), where the adsorbed oxygen acquired electrons and reduced to O2•-. Subsequently, the formed O2•- dissolved in the water film.
(3) the dissolved HS- reacted with the O2•- with strong oxidative capabilities to formed sulfate via isolated sulfur radical intermediate product. Meanwhile, a little fraction of isolated sulfur radicals collided with each other to form elemental S8. Additionally, the collision probability of isolated sulfur radical was greatly limited due to the poor H2S adsorption capacity, namely low isolated sulfur radical generation, and enhanced surface acidity of the catalyst. Therefore, the generation of elemental sulfur was restricted, which in turn facilitated the further reaction of isolated sulfur radical to form sulfate.
Figure 9
Figure 9.
Schematic illustration of the catalytic oxidation of H2S at room temperature on NH3-ACF-O10.
Therefore, the reaction process obeyed a Langmuir-Hinshelwood (L-H) like mechanism. As is known, the L-H mechanism usually means that the reaction occurred via two chemisorbed molecules [65]. However, for this reaction, it was proceeded via chemisorbed H2S and superoxide radical, which was adsorbed and activated by defect.
In summary, ACFs with high sulfate selectivity and optimal sulfur capacity were prepared through a synergistic strategy of "nitrogen doping - defect engineering". Among the prepared catalyst, NH3-ACF-O10 presented the best catalytic performance, which could achieve sulfur capacity of 0.21 g/g, sulfate selectivity of 85.40%, and outstanding water wash regeneration performance, i.e., 83.33% sulfur capacity could be recovered. The sulfur capacity was mainly depended on the content of N species, especially PdN species. The low content of PdN species for the prepared ACFs meant that limited amount of H2S could be adsorbed and participate in the reaction, leading to the relatively low sulfur capacity. Meanwhile, the enhanced surface acidity, especially medium acid, together with the increased defect density after plasma modification were responsible for the high sulfate selectivity. The enhanced surface acidity could greatly decrease the collision probability of isolated sulfur radical, subsequently, restricting the formation of elemental sulfur and benefiting the formation of sulfate, which was in turn further decrease the sulfur capacity. Simultaneously, the molecular O2 was adsorbed exclusively at defects and further activated by defects to form O2•- with strong oxidative capabilities, which could oxidize adsorbed H2S to sulfate directly. Moreover, based on the previous work, it was thought that the defects, i.e., the formation of O2•-, played a curial role in the formation of sulfate. Besides, it was thought that O2•- were the main reactive oxygen species for the reaction. Moreover, the reaction obeyed a L-H like mechanism, the reaction was proceeded via chemisorbed H2S and O2•-. However, although relative high sulfate selectivity was obtained for the prepared catalysts, it is critical to note that achieving near-perfect sulfate selectivity (ideally 100%) remained a key challenge for practical applications.
Declaration of competing interest
The authors declare that they have no known competing financial interests or personal relationships that could have appeared to influence the work reported in this paper.
This work was supported by the National Natural Science Foundation of China (Nos. 22276191, 52372044 and 21976177), National Key Research and Development Program of China (No. 2022YFB4101500), Shccig-Qinling Program Found (No. SMYJY20230072), Postgraduate Scientific Research Innovation Project of Hunan Province (No. LXBZZ2024044) and CNPC Innovation Found (No. 2022DQ02–0411).
Supplementary materials
Supplementary material associated with this article can be found, in the online version, at doi:10.1016/j.cclet.2025.112153.
A. Cabrera-Codony, M.A. Montes-Morán, M. Sánchez-Polo, M.J. Martín, R. Gonzalez-Olmos, Environ. Sci. Technol. 48 (2014) 7187–7195. doi: 10.1021/es501274a
[42]
J.R. Pels, F. Kapteijn, J.A. Moulijn, Q. Zhu, K.M. Thomas, Carbon 33 (1995) 1641–1653. doi: 10.1016/0008-6223(95)00154-6
[43]
L.G. Cançado, A. Jorio, E.H.M. Ferreira, et al., Nano Lett. 11 (2011) 3190–3196. doi: 10.1021/nl201432g
Figure 1
(a) The preparation of NH3-ACFs and NH3-ACF-X, SEM images of NH3-ACF (b), NH3-ACF-N10 (c), NH3-ACF-A10 (d), and NH3-ACF-O10 (e). N2 adsorption-desorption isotherms (f), pore size distribution (g), the composition of nitrogen species (h), the composition of oxygen species (i), the high-resolution N 1s XPS spectra of NH3-ACF-O10 (j) and water contact angle of ACFs (k).
Figure 2
Raman spectra (a), ID/IG values (b), d002, La and Lc values (c-e) of ACFs. HRTEM images of NH3-ACF-O10 (f), and mechanism of plasma modification on microscopic crystal structure (g).
Figure 3
C K-edge NEXAFS spectra (a), expanded peaks at 285.5 eV (b) and 291.9 eV (c) of ACFs, and schematic diagram of nitrogen species and defects in ACFs (d).
Figure 4
(a) Breakthrough curves of H2S on ACFs. (b) H2S removal capacities of ACFs. (c) S 2p spectrum of NH3-ACF-O10-E. (d) Sulfate selectivity and SOx content of ACFs. (e) TG curves of exhausted ACFs. (f) DTG-peak-deafferenting analysis of NH3-ACF-O10-E. (g) H2S breakthrough curves over NH3-ACF-O10 and NH3-ACF-O10-WR. Comparison of water regeneration (h), and comparison of sulfate selectivity (i).
Figure 6
(a) NH3-TPD profiles of ACFs. (b-e) TPD-peak-fitting analysis of ACFs, and the relationships between sulfate selectivity and acid of ACFs (f).
Figure 7
(a) Pyridine-IR spectra of ACFs at 350 ℃. (b) Relationships between sulfate selectivity and Lewis acid sites of ACFs. Relationships between sulfate selectivity and the value of nD (c), and EPR spectra of ACFs (d).
Figure 8
(a) O2-TPD-MS profiles of ACFs. In situ DRIFTS spectra for H2S adsorption (b) and O2 adsorption after H2S adsorption on NH3-ACF-O10 (c), and breakthrough curves over NH3-ACF-O10 under different conditions (d).

 DownLoad:

 下载:
下载:


 下载:
下载:
