Received Date:
26 August 2025 Accepted Date:
19 November 2025 Revised Date:
18 November 2025 Available Online:
15 October 2026
Abstract:
Bioluminescence imaging has emerged as a vital tool for studying molecular dynamics in living organisms, owing to its high sensitivity, absence of background fluorescence, and independence from external excitation light sources, demonstrating significant potential for propelling self-illuminated theranostic applications. Among bioluminescent systems, NanoLuc luciferase (NLuc) demonstrates significant advantages over traditional luciferases due to its exceptional catalytic efficiency, small molecular size (19 kDa), stability, and ATP independence. However, its short emission wavelength (ca. 460 nm) is susceptible to tissue attenuation, which hinders deep-tissue applications, severely impeding its application in deep-tissue imaging and theranostics. Fortunately, bioluminescence resonance energy transfer (BRET) technology, combined with fluorescent protein fusions, protein tag techniques, and site-specific labeling with fluorescent dyes, effectively extends emission wavelengths, greatly enriching the toolkit for bioluminescence-based integrated theranostics. This review, for the first time, systematically summarizes groundbreaking strategies for engineered NLuc in “self-illuminating” theranostic applications. By elucidating its structure-function relationships, we focus on developments in NLuc engineering, substrate optimization, and the construction of BRET systems. The review critically assesses progress in deep-tissue imaging and spatiotemporally controlled phototherapy, providing a forward-looking roadmap for clinical translation in diagnostics and precision medicine.
The rapid advancement of molecular imaging has unveiled new dimensions in biomedical research, enabling real-time capturing of molecular dynamics underlying various biological events at both the cellular and in vivo levels [1–5]. Among various imaging paradigms, bioluminescence imaging has emerged as a valuable modality for studying gene expression, protein-protein interactions, and disease progression, owing to its excellent sensitivity, minimal background autofluorescence, and independence from external excitation light [6–8]. In contrast to conventional fluorescence imaging, which entails real-time exogenous photoexcitation, bioluminescence imaging harnesses endogenous luciferases to catalyze substrate oxidation for light emission, thereby circumventing limitations such as undesired photobleaching, potential photocytotoxicity of imaging probes, and background autofluorescence [9–11]. Additionally, bioluminescence imaging allows for long-term visualization in living organisms, further underscoring its irreplaceable role in biomedical realms [12].
Within the bioluminescence toolkit, NanoLuc luciferase (NLuc) stands out as a transformative representative in bioluminescence imaging by virtue of its unprecedented catalytic efficiency, compact molecular size (19 kDa), adenosine triphosphate (ATP) and Mg2+-independence, and excellent stability [13]. Compared with traditional firefly luciferase (FLuc) or renilla luciferase (RLuc), NLuc usually displays a significantly higher luminescence intensity, and its substrate, furimazine, exhibits superior pharmacokinetic properties, allowing for longer-lasting signal output [14]. However, the emission wavelength of NLuc/furimazine systems is relatively short (ca. 460 nm), which is susceptible to tissue absorption and scattering, hindering its broader application in deep tissue imaging and/or phototherapy. Moreover, as mammalian cells per se do not possess luciferase intrinsically, target cells must be transfected to express luciferase employing gene delivery and/or plasmid transfection techniques for bioluminescence imaging [13,14], which substantially increases the operational complexity. These shortcomings of NLuc have driven the exploration of alternative techniques (e.g., protein tagging) [15] or improved strategies (e.g., substrate optimization) [16]. Other than protein engineering and substrate derivation, the development of multicomponent nanointegration strategies is another appealing approach to advance bioluminescence-based theranostic applications [17–19]. Despite these advancements, to the best of our knowledge, there is no summative review specifically centering on the engineering of NLuc for self-illuminated imaging and deep-tissue phototherapy applications. Therefore, in this review, we aim to examine the cutting-edge approaches for tailoring NLuc toward “self-illuminated” bioluminescent theranostic systems. Herein, we dissect the structure-function relationships of engineered NLuc variants, then explore how protein engineering and nanohybrids can bridge bioluminescence with bioimaging, biosensing, and phototherapy through energy transfer mechanisms. By highlighting successes in deep-tissue imaging and spatiotemporally controlled photodynamic therapy (PDT), and this review provides a roadmap for translating engineered bioluminescent systems into clinical diagnostics and precision medicine.
2.
Tailoring NLuc for theranostic applications
2.1
Tailoring NLuc for self-illuminated imaging
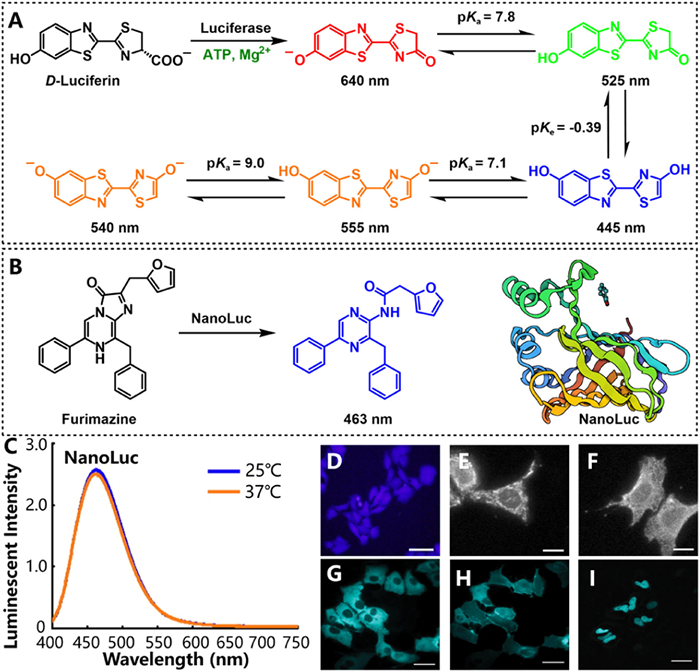
Bioluminescence offers an attractive alternative for live-cell imaging but remains underutilized, primarily owing to its inherent low signal intensity. However, recent breakthroughs in ultrasensitive detection technologies, particularly the electron multiplying charge-coupled devices (EMCCD) and quanta image sensors (QIS), have demonstrated the capability to overcome this inherent low-intensity barrier, providing a viable pathway for practical bioluminescence microscopy [20–22]. The FLuc/luciferin pair represents one of the most investigated bioluminescence systems [23–26]. Nevertheless, the scientific community comes to realize that the traditional FLuc/luciferin system suffers from a key limitation, i.e., its emission wavelength and intensity exhibit high sensitivity toward environmental variables such as pH, temperature, Ca2+ fluctuations, and solvent polarity, which can compromise experimental reliability [27]. For example, the emission maxima of oxyluciferin (the reaction product of D-luciferin) can shift dramatically across a spectral range from blue to deep red (445–640 nm) under different conditions, notably influenced by acidity (Fig. 1A) [27–29]. In contrast, the bioluminescent NLuc/furimazine system exhibits greater spectral stability, typically emitting with a peak centered near 463 nm (Figs. 1B and C). Furthermore, its corresponding luciferase, NLuc, possesses two distinct advantages: (1) Its smaller size (19 kDa vs. 61 kDa for FLuc) minimizes potential perturbation to biological systems, and (2) it operates without requiring cofactors like ATP and Mg2+/Ca2+. These attributes contribute to reduced experimental variables and enhanced reproducibility in bioluminescence imaging [14]. Notably, bioluminescence microscopy studies demonstrate that U2OS cells expressing the NLuc gene alone display diffuse intracellular bioluminescence distribution (Fig. 1D). Conversely, when the NLuc sequence is fused to genes encoding specific organelle-targeting sequences, precise subcellular localization of the bioluminescence signal is achieved (Figs. 1E–I), underscoring the versatility and tunability of the NLuc system for tailored bioimaging applications [30,31].
Figure 1
Figure 1.
(A) The luciferin/luciferase reaction and the emission maxima of its reaction products. (B) The bioluminescent reaction between NanoLuc and furimazine. (C) Bioluminescence stability of the NanoLuc/furimazine reaction system. Bioluminescence microscopy of U2OS cells displaying whole-cell staining (D), mitochondrial (E), endoplasmic reticulum (F), cytosolic (G), plasmic membrane (H), and nuclear localization (I), respectively. (C–F): Reproduced with permission [30]. Copyright 2014, Wiley-VCH GmbH. (G–I): Reproduced with permission [31]. Copyright 2012, American Chemical Society. Scale bars: 100 µm (D), 20 µm (E, F), 40 µm (G–I).
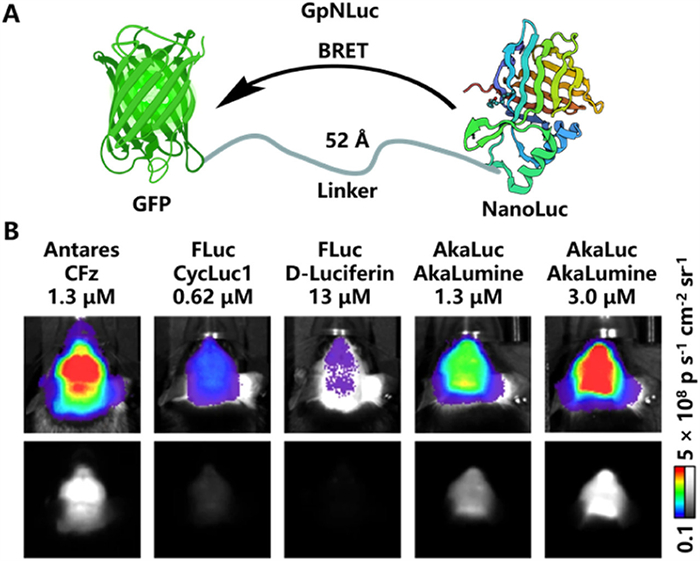
Despite the cellular imaging studies, the NLuc/furimazine bioluminescence system has also been employed for tracking of tumor growth in living mice [7,32–35]. However, blue emission is subjected to strong scattering in living tissues and may be attenuated by biomolecules due to spectral overlaps. Therefore, in a study directed by Amelio and coworkers [33], NLuc was fused with an enhanced green fluorescent protein (eGFP) to afford a fusion protein (GpNLuc) in A549-GpNLuc cells (Fig. 2A). The Nanoluc/furimazine pair generates blue light via a catalytic chemical reaction. When the NLuc and eGFP are in extremely close molecular proximity (<10 nm), this bioluminescence is efficiently “relayed” to eGFP through the bioluminescence resonance energy transfer (BRET) mechanism. The energy acceptor, eGFP, subsequently emits intense green emission, enabling imaging of intracellular protein interactions with high sensitivity, high specificity, and powerful quantitative capability. The BRET efficiency and Förster distance calculations are similar to those in Förster resonance energy transfer (FRET) processes, which have been well-documented in many references [36–38]. In the current system, the mean distance between the NLuc reactive site and the eGFP is around 5.2 nm (Fig. 2A), which is within the favorable range of Förster distances (1–10 nm) for an efficient BRET process [36–38]. Particularly, it is claimed that this BRET reporter is applicable for tracking the progress of tumor development. In addition, studies by other researchers have shown that engineered NLuc systems were applicable for brain imaging [34,35]. Taking Antares for example (Antares: a fusion protein featuring a NanoLuc unit and two fluorescent proteins, λmax = 589 nm) [37], Lin, Kirkland, and coworkers optimized a substrate (cephalofurimazine, CFz) with better performance (lower dose and higher brightness) than the commercialized AkaLuc/AkaLumine pair (6.5-fold brighter) for monitoring of brain neurons in transgenic mice (Fig. 2B) [34,35]. It is worth noting that the Antares/CFz bioluminescent could be multiplexed with other luciferase/luciferin pairs and allows imaging of moving animals.
Figure 2
Figure 2.
(A) Schematic illustration of the NanoLuc-GFP conjugate (GpNLuc). Created with BioRender.com. (B) Bioluminescence imaging of the mouse brain with different luciferases. Reproduced with permission [35]. Copyright 2023, Nature Publishing Group.
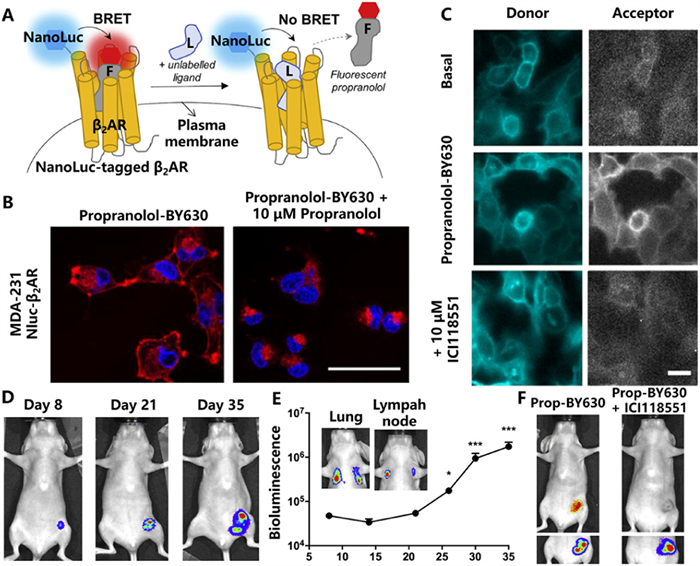
The therapeutic efficacy of a drug is significantly contingent upon its capability to interplay with the corresponding protein targets in living organisms. However, current drug assessment inclines to monitor the concentrations of drugs at the organ level, rather than directly evaluating their interaction with protein targets in living organisms. To address this issue, Alcobia and coworkers managed to attach an NLuc to the human β2-adrenoceptor (β2AR, a cell surface protein involved in cancer progression and metastasis) to afford a BRET reporter for straightforward tracking of the protein-drug interaction in cell level and in living mice [39]. As illustrated in Fig. 3A, upon binding with a β2AR antagonist (Prop-BY630, a boron-dipyrromethene (BODIPY)-modified propranolol derivative), the bioluminescence produced from the NLuc/furimazine system could be transferred to the Prop-BY630, yielding bright red-shifted bioluminescence (acceptor emission). On the contrary, if unlabelled antagonists (propranolol or ICI118551) were introduced to block β2AR binding sites, the BRET signals were significantly attenuated (Fig. 3C). Subsequently, this system was successfully utilized to monitor the MDA-MB-231 tumor growth and its metastasis to the lung and lymph node (Figs. 3D and E). Additionally, it is noteworthy that the performance of the NLuc-β2AR bioluminescence imaging modality surpasses that of the fluorescence method as the fluorescence signals of the internalized Prop-BY630 substantially interfere with the binding interactions (Figs. 3B and F).
Figure 3
Figure 3.
(A) Schematic illustration of the NLuc-β2AR imaging system. Fluorescence (B) and bioluminescence (C) microscopy studies on the interaction of NLuc-β2AR with its antagonists (propranolol and ICI118551) using MDA-MB-231 cells that express NLuc-β2AR. (D, E) Bioluminescent tracking of tumor growth and metastasis. (F) Comparison of bioluminescence and fluorescence on interaction of NLuc-β2AR with ICI118551 in tumor-bearing living mice. Reproduced with permission [39]. Copyright 2018, Elsevier.
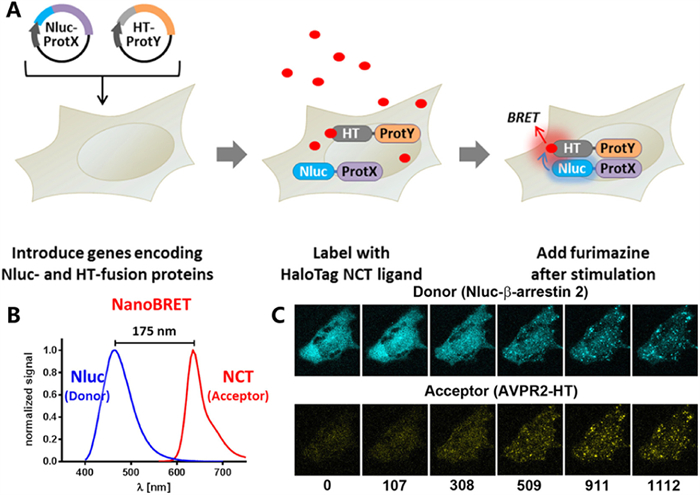
Other than monitoring ligand-protein interactions, Machleidt et al. employed the NLuc/furimazine pair for studying protein-protein interactions [40]. In their design, two target proteins (ProtX and ProtY) were labelled with NLuc and HaloTag (HT) proteins, respectively. Only if these two targets were close enough (<10 nm) would the donor emission (bioluminescence) induce the acceptor emission (Fig. 4A). The BRET processes involving NLuc were referred to as NanoBRET. By varying the fluorescent HaloTag ligands, different NanoBRET pairs with various emission wavelengths could be obtained (Fig. 4B). Under optimal conditions, a spectral separation as large as 175 nm minimizes the interferences of spectral crosstalk. By employing the aforementioned NanoBRET techniques, the recruitment process of β-arrestin 2 by the vasopressin receptor 2 (AVPR2-HT) was imaged (Fig. 4C). Before arginine vasopressin induction, the NLuc-β-arrestin 2 was evenly distributed in the cells (blue channel), while it translocated to the chlathrin-coated pits upon introduction of arginine vasopressin, revealing the interaction of these proteins. This NanoBRET technique has also been applied to the investigation of other interactions of the proteins of interest [40]. Additionally, other studies have split the NLuc into two subunits (LgBit and SmBit or HiBit) to facilitate the protein-fragment complementation assays [41–44]. If one protein was labeled with LgBit, no bioluminescence could be produced. The bioluminescence could only be activated when the LgBit-labeled protein binds with another protein labeled with the complementary SmBit or HiBit subdomains. These advancements not only promote the studies on protein-protein interactions but also facilitate the quantification of certain cellular proteins. A recent study has validated the usefulness of the NanoBit technology in tracking RNA transcriptions, which further expands its application territory [45].
Figure 4
Figure 4.
(A) Schematic illustration of the NLuc-derived NanoBRET system. (B) Optimized spectral separation. (C) Arginine vasopressin-induced interaction between β-arrestin 2 and vasopressin receptor 2 (AVPR2-HT). Reproduced with permission [40]. Copyright 2015, American Chemical Society.
2.2
Tailoring NLuc for self-illuminated biosensing
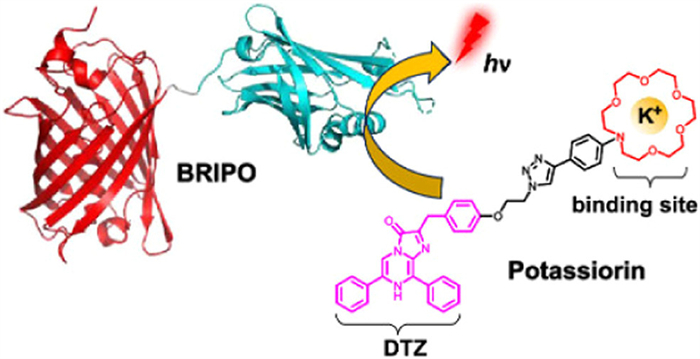
Potassium (K+) plays a significant role in many biological processes, while available K+ biosensors remain limited. In view of this, Ai and coworkers designed a new NLuc substrate, Potassiorin, by modifying a crown ether as the K+ sensory unit on the coelenterazine molecule (Fig. 5) [46]. When complemented with an NLuc variant BRIPO (NLuc-RFP conjugate, RFP: red fluorescent protein), this sensory system was capable of detecting the K+ levels in living cells and animals via the extraction of the ratios of the Potassiorin bioluminescence and the acceptor emission signals (Fig. 5). A binding affinity of 25 mmol/L was attained, which was significantly lower than that for Na+ (67 mmol/L), implicating good selectivity for this sensing system. The efficiency of such BRET-based sensors is often quantified by the acceptor emissions or the BRET ratios (i.e., the acceptor emission intensity divided by donor emission intensity). With respect to this bioluminescent K+ sensing system, the BRET ratios are particularly sensitive to subtle K+ fluctuations, providing a reliable readout for its concentration. Corresponding studies demonstrated that before high concentrations of K+ exposure, strong BRET emissions resulted, while upon binding with K+, the BRET signals markedly decreased. These observations are reaffirmed in detailed investigations using transfected HEK293T cells, mouse neurons, and living mice, where the K+ efflux and/or K+ dynamics were readily visualized by applying the bioluminescence imaging techniques.
Figure 5
Figure 5.
Schematic illustration of the bioluminescent K+ sensor. Copied with permission [46]. Copyright 2024, American Chemical Society.
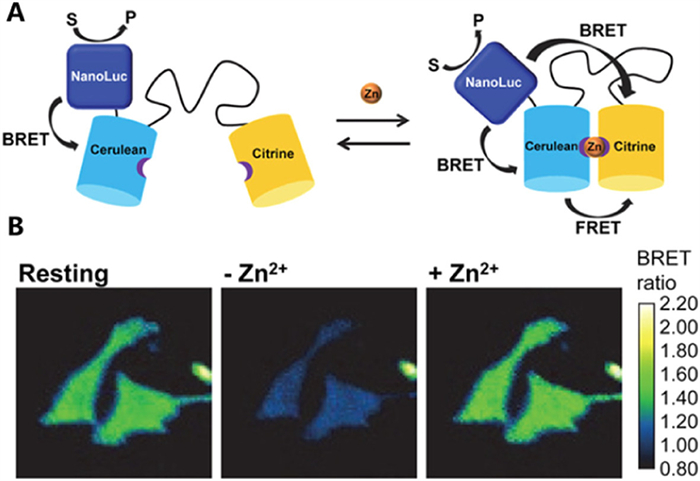
Although genetically encoded fluorescent protein-based Zn2+ biosensor proteins have been constructed for studying the basic function of Zn2+ in living systems [47], the signal readouts are primarily fluorescence, which requires photoexcitation, thus suffer from strong autofluorescence and potential photobleaching and photocytotoxicity. For these considerations, Merkx’s group proposed the first NLuc-derived BRET probe for tracking intracellular Zn2+ fluctuations [48]. As displayed in Fig. 6A, NLuc was attached onto a bright and pH-insensitive fluorescent protein Cerulean to ensure efficient BRET process (though both NLuc and Cerulean emit at around 460 nm), where Cerulean is further linked to another fluorescent protein citrine (λmax = ca. 530 nm). The energy transfer machinery begins with the first BRET process from NLuc to Cerulean, followed by a second FRET process from Cerulean to Citrine. Each fluorescent protein contains a supplementary Zn2+-binding domain, and the distance between Cerulean and Citrine is not favored for efficient FRET before binding with Zn2+. Upon reaction of the sensor with Zn2+, both the BRET and FRET processes are efficient, allowing ratiometric Zn2+ detection. The sensor performance was evaluated using the change in BRET ratio. Upon Zn2+ saturation, the BRET ratios increased significantly by 25%–50%. The sensor has been successfully applied for imaging of Zn2+ concentrations in living HeLa cells (Fig. 6B).
Figure 6
Figure 6.
(A) Schematic illustration of the bioluminescent Zn2+ sensor. (B) Bioluminescent microscopy of transfected HeLa cells without and with disturbances. Reproduced with permission [48]. Copyright 2016, American Chemical Society.
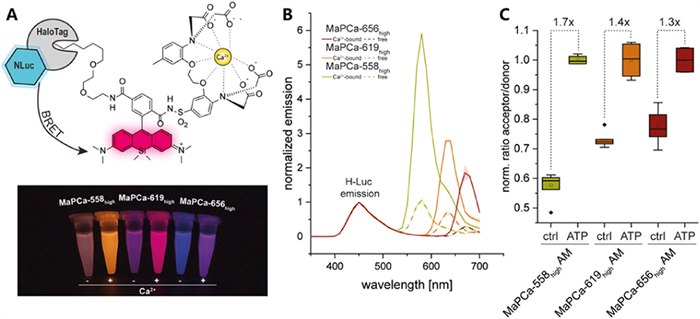
Protein tags capable of providing a reactive binding site on targeted proteins have received considerable research interest for biosensing and bioimaging applications [49]. HaloTag is one of the most prevailing labeling tools by virtue of its ability and selectivity to associate with a functional halogenated alkyl chain [50]. For monitoring intracellular Ca2+ levels, Johnsson and colleagues developed a novel class of bioluminescent Ca2+ indicators by conjugating a HaloTag-NanoLuc (H-Luc) fusion protein with a series of synthetic Ca2+-responsive fluorophores, designated as MaPCa dyes (Fig. 7A) [51]. These indicators function via a dual-turn-on mechanism: Binding to the HaloTag protein triggers ring-opening of the rhodamine spirolactam unit, activating fluorescence, while subsequent Ca2+ recognition disrupts photoinduced electron transfer (PET) from the chelator moiety, leading to drastic emission enhancement (Fig. 7A) [51]. The advantages of these bioluminescent fusion protein-derived indicators include: (1) Great flexibility offered by the HaloTag for the introduction of Ca2+-responsive fluorescent dyes with different emission wavelengths (Fig. 7B); (2) high signal-to-background ratios derived from the photoexcitation-free NLuc/furimazine pair and the subsequent BRET process. As demonstrated in Fig. 7C, when HaloTag-NLuc-expressing HEK293 cells were labeled with different Ca2+ indicators, the acceptor/donor emission ratios (BRET ratios) remained relatively low due to quenching effects caused by PET from the sensing unit to the rhodamine dye. However, upon stimulation of cytosolic Ca2+ levels using agents such as ATP and thapsigargin, the BRET emission ratios increased significantly. The far-red indicator H-Luc-MaPCa-656 exhibited a maximum ratio change of 6.5, representing the first bioluminescent calcium indicator operating in the far-red region (Figs. 7B and C). Notably, in addition to the HaloTag, other protein tags such as BromoCatch and SNAP tag have also been explored to construct fusion proteins with NLuc for bioluminescence-related applications [52–54]. With the assistance of a protein tag, the photophysicochemical properties of the bioluminescent sensors (emission wavelengths, stimuli-responsiveness, etc.) could be facilely modulated by corresponding synthetic ligands for these tags.
Figure 7
Figure 7.
(A) Schematic illustration of the HaloTag-NLuc-based bioluminescent Ca2+ sensor. (B) Normalized bioluminescence emission of the sensors in the absence and presence of Ca2+. (C) Normalized BRET signal ratios of living 293 cells transfected with HaloTag-NLuc, and then reacted with different Ca2+-responsive dyes (MaPCa). Reproduced with permission [51]. Copyright 2022, American Chemical Society.
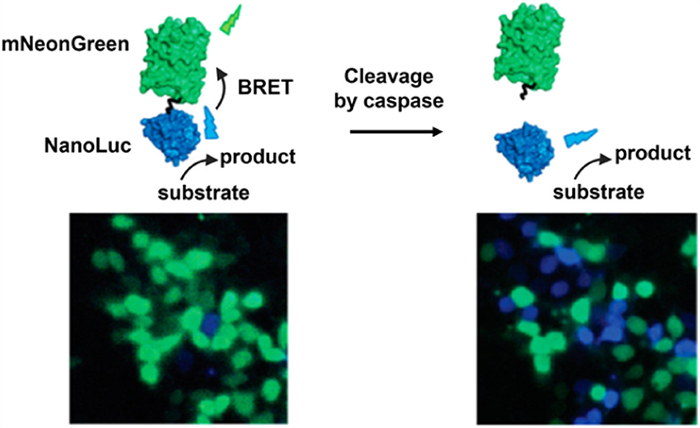
Caspase-3 was a well-known executioner for programmed cell death, and the evaluation of caspase-3 activity is of paramount significance [55–58]. Regarding that traditional FRET-based fluorescent caspase-3 bioprobes suffered from unfavorable heterogeneity between cells regarding their emission signals, Merkx’s group exploited the BRET techniques for sensing caspase-3 in living cells. In their design, the NLuc and a green fluorescent protein (mNeonGreen) were integrated with a caspase-3-cleavable peptide linker (Fig. 8) [59]. In a HeLa cell model that stably expressed the NLuc-mNeonGreen sensor, studies via bioluminescence microscopy revealed that strong acceptor emission was detected in most cells when incubated with staurosporine (an apoptosis inducer) for 2 h, indicative of effective BRET efficiency between NLuc and mNeonGreen and minimal caspase-3 activation (Fig. 8). In sharp contrast, about 50% of the cells exhibited blue NLuc emission when the cells were treated with an apoptosis inducer for 4 h, suggesting the block of the BRET process by the activated caspase-3. Significantly, owing to the brightness and effectiveness, the established BRET biosensors were applicable for longitudinal single-cell bioimaging, providing an unparalleled tool for investigating cell heterogeneity during drug-induced cell death.
Figure 8
Figure 8.
Schematic illustration of the NLuc-mNeonGreen bioconjugate-based sensor for caspase 3. Reproduced with permission [59]. Copyright 2017, American Chemical Society.
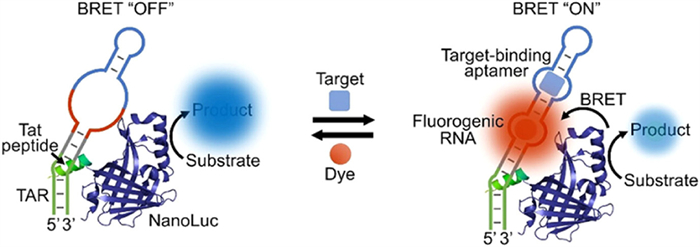
Fluorogenic aptamer sensors have found widespread applications in both bioanalytical and biomedical realms due to their robustness and selectivity towards various analytes [60–62]. In 2023, You, Ren, and coworkers validated the first examples of bioluminescent RNA aptamer-derived chemosensors (Fig. 9) [63]. An NLuc was introduced into a transactivation response RNA-Peptide complex (TAR-TAT). The RNA aptamer was able to selectively include a fluorogenic dye to generate “turn on” fluororescence signals when a certain target induced structural changes of the RNA sequence to form a superamolecular recognition cage. When conjugated with a bioluminogenic NLuc/furimazine pair, these bioluminescent aptamer sensors combine the advantages of bioluminescence imaging and fluorogenic RNA aptamers. For example, by measuring the BRET emission ratios, one of the reported sensors allowed bioluminescent detection of tetracycline antibiotic in a linear range of 0.1–100 µmol/L. This method can also be employed for evaluating tetracycline concentrations in cell lysates in vitro and inside living cells.
Figure 9
Figure 9.
Schematic illustration of the NLuc-RNA aptamer-based biosensor. Copied with permission [63]. Copyright 2023, American Chemical Society.
2.3
Tailoring NLuc for self-illuminated phototherapy
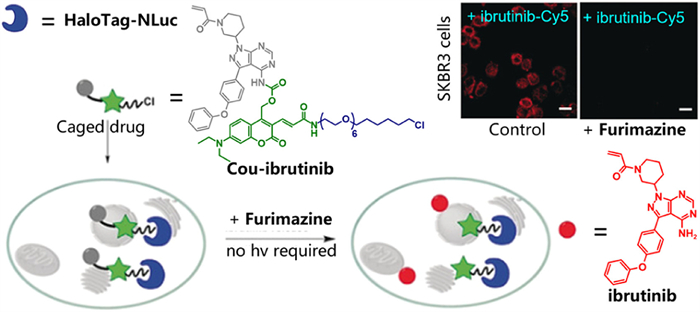
Photocages, which exploit light to control medical effector release, pose substantial advantages such as non-invasiveness, stimulus-responsiveness, and spatiotemporal precision and have become a prevailing tool in the biomedical fields [64–67]. Nonetheless, conventional photocages basically relied on external light sources to realize photouncaging, which may not be as effective in deep tissue as a consequence of tissue absorption and scattering effects. To solve this issue, Winssinger’s research group presents the first example of bioluminescence-driven drug release in cancer cells by installing a coumarin photocage into the HaloTag-NLuc fusion protein (Fig. 10) [68]. Regarding the absorption spectra of coumarin dyes are superimposed largely on the blue emission of the NLuc/furimazine pair, this chimeric photocage-HaloTag-NLuc complex would undergo efficient BRET, facilitating the process of photouncaging. An effective inhibitor for tyrosine kinases (ErbB2), ibrutinib, was chosen as an example to study the effectiveness of this bioluminescence-induced photouncaging system. As shown in Fig. 10, in the absence of bioluminescence substrate furimazine, the SKBR3 cells were lit up by a commercially available ibrutinib-Cy5 dye, indicative of minimal release of the ibrutinib and negligible inhibitory effects for ErbB2. Upon treatment with furimazine, the BRET is activated and bioluminolysis of the photocage proceeds, resulting in potent inhibition of ErbB2 and therefore ultraweak intracellular emission in the Cy5 channel. Compared to external blue light irradiation-induced photoreleasing (488 nm, ca. 20 mW), this BRET-triggered uncaging demonstrated comparable reaction kinetics (with a half-life of less than two minutes), offering a novel delivery approach for therapeutic antigens using internal bioluminescence as a trigger. Similarly, a work conducted by DeForest and coworkers applied a ruthenium(Ⅱ) complex as an alternative photocage for photoactivable release of proteins [69]. Considering that transition metal complexes are also good photocatalysts, another work from Winssinger’s group has explored the potentiality of BRET-driven photocatalytic releasing of therapeutic effector by inserting a ruthenium(Ⅱ) complex into the SNAP tag-NLuc conjugate [70]. Efficient photocatalytic performance as well as furimazine dose-dependent cytotoxicity was achieved, opening new paths for BRET-powered phototherapeutics. Although the total photon flux and resultant reactive oxygen species (ROS) yield in BRET systems are typically lower than those in conventional phototheranostics that employ continuous external photoirradiation, the therapeutic efficacy can be substantially boosted through consecutive substrate administration. This approach maintains sufficient excitation intensity, enabling prolonged ROS generation [10,68,71]. With sufficient substrate availability, BRET-activated photosensitizers can be repeatedly populated to generate enough cytotoxic ROS for inducing cell death [10,68,71].
Figure 10
Figure 10.
Schematic illustration of the bioluminolysis-induced drug release. Reproduced with permission [68]. Copyright 2019, Wiley-VCH GmbH under [CC BY-NC-ND 4.0] [http://creativecommons.org/licenses/by/4.0/].
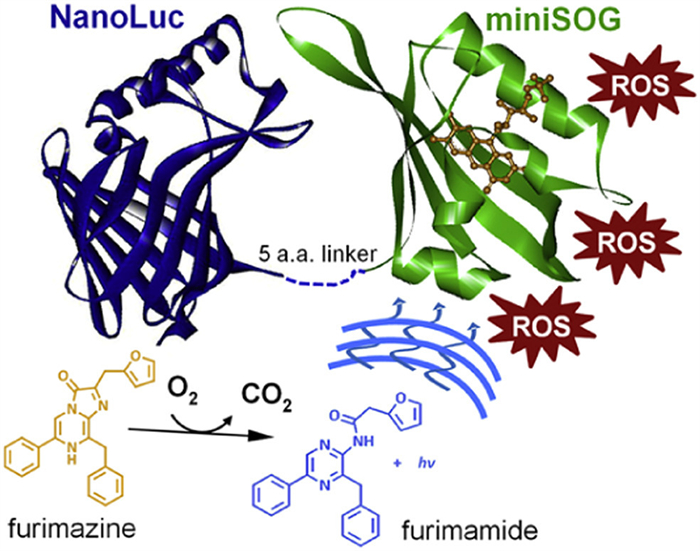
The speedy advancement of phototherapy has profoundly reshaped biomedical science, driving significant breakthroughs in oncology and other areas. A key progress in this field is PDT, a revolutionary modality that utilizes photosensitized ROS to selectively target and eradicate malignant cells [72–74]. However, as aforementioned, the unfavored tissue penetration prevents this treatment method from eliminating tumors located hiddenly in deep tissue and therefore impedes its potential clinical translations. To this end, Deyev, Ryabova, and coworkers proposed a new concept termed “genetically encoded BRET-activated PDT”, which integrates the internal bioluminescence excitation and a photocytotoxic photosensitizer into a protein fusion (Fig. 11) [71,75,76]. Initially, the NLuc was engineered to fuse with a photosensitive protein, and this fusion protein was stably transfected in cells and in tumors (BT-474/NanoLuc-miniSOG cells). It should be noted that the photosensitizing ability of miniSOG is dependent on its cofactor flavin. Subsequent observation of furimazine-dependent ROS generation and cytotoxicity verified the feasibility of the genetically encoded bioluminescent photosensitizers. An investigation on tumor growth demonstrated that only when transfected tumors are co-treated with furimazine and riboflavin did the BRET-PDT system display the most remarkable inhibitory effects. As tumors generally do not express NanoLuc-miniSOG fusion, the authors managed to establish an overexpressed receptor-targeted delivery vector for the transfection of this fusion protein in primary BT-474 tumors. The results have shown a 67% tumor inhibition, which was significantly higher than that of the un-transfected controls [71]. It is believed that this work possesses great translational potential.
Figure 11
Figure 11.
Schematic representation of NanoLuc-miniSOG genetically encoded system for BRET-mediated PDT. Reproduced with permission [75]. Copyright 2018, Elsevier.
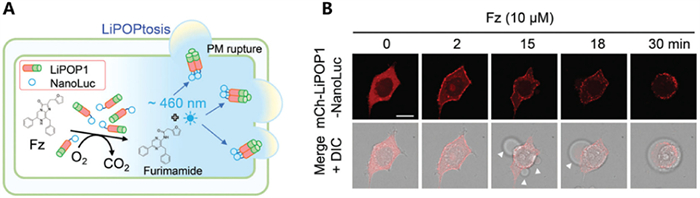
Cryptochromes are naturally occurring photosensitizers that have found broad applications in optogenetics and biomedical applications [77,78]. The Arabidopsis cryptochrome 2 (CRY2) represents one of the most studied cryptochromes, which was combined with NLuc by Jing and coworkers to explore its BRET-induced photocytotoxic potential (Fig. 12) [79]. Notably, CRY2 would undergo oligomerization and induce a set of downstream signaling transductions under blue light irradiation, implicating that the bioluminescent NLuc/furimazine might serve as an ideal internal trigger for this process. A fluorescent protein, mCherry, was attached to track the CRY2 oligomerization and translocation upon induction. Microscopic investigations displayed that cancer cells stably expressing mCh-NLuc-CRY2 hybrid exhibited an obvious translocation of the mCherry emission from cytoplasm to the plasma membrane and furimazine-dose-dependent necroptosis. The necroptotic cell death was further confirmed by cell morphology changes and flow cytometry results. This NLuc-CRY2 hybrid also displayed significant tumor inhibitory effects in vivo. Another study uncovered that genetically encoded CRY2 cryptochrome could be applied for self-illuminated optogenetic treatment of Retinoblastoma [80].
Figure 12
Figure 12.
Schematic illustration of the photocytotoxic effects of BRET-driven PDT using mChNLuc-CRY2 hybrid. Reproduced with permission [79]. Copyright 2021, Wiley-VCH GmbH.
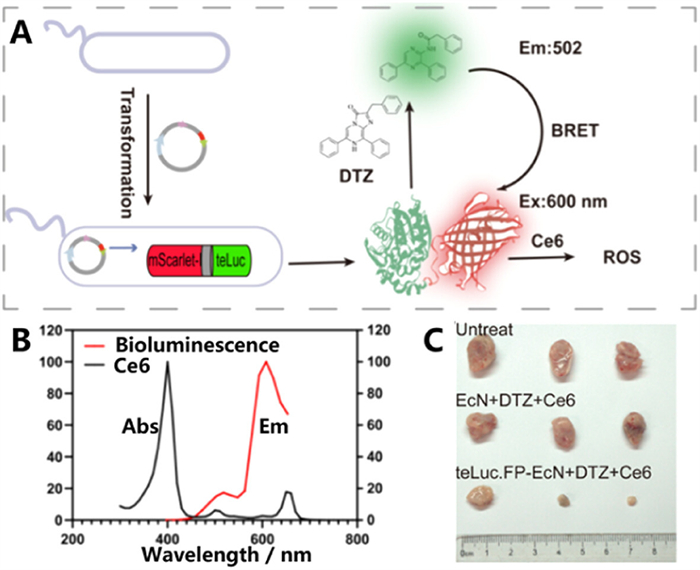
In supplementary to the protein-based macromolecular photosensitizers, synthetic organic photosensitizers have the advantages of small molecular size and tunable photosensitizing abilities [81–83]. A work by Lu’s team has employed the commercialized Chlorin e6 (Ce6) to construct BRET-driven photosensitizing bacteria and explored the PDT efficiency in 4T1 tumor models [84]. As depicted in Fig. 13A, the Escherichia coli bacteria were first engineered to express a luciferase-red fluorescent protein complex (teLuc.FP), which emits red fluorescence owing to the BRET process (Fig. 13B, ca. 600 nm). Further, the red emission would be subsequently transferred to Ce6 photosensitizers, leading to the vast generation of ROS and ultimately cell death. In vitro studies displayed that this PDT system is based on the BRET-driven singlet oxygen generation in the presence of bioluminescence substrates (DTZ, diphenylterazine) for an NLuc variant (teLuc). Without teLuc/DTZ or Ce6, this system displayed negligible photosensitizing capacity and minimal tumor-inhibitory effects both in vitro and in vivo (Fig. 13C). This study demonstrated that free photosensitizers (without binding to the NLuc/substrate) could still elicit obvious cytotoxic effects when incubated with NLuc-expressing cells, which simplifies the complicated BRET-driven PDT system, though the PDT performance remains to be improved.
Figure 13
Figure 13.
(A) Schematic illustration of the BRET-driven PDT using engineered bacteria. (B) Spectral overlap of bioluminescence emission and absorption of phosensitizer Ce6. (C) Tumor inhibitory effects. EcN: Escherichia coli Nissle 1917; DTZ: bioluminescence substrate; teLuc: NLuc variant. Reproduced with permission [84]. Copyright 2024, American Chemical Society.
Recent years have witnessed a series of groundbreaking achievements in luciferase-based bioluminescent theranostics, particularly those derived from NLuc and its variants, owing to their minimal molecular size and ATP-independent emission in living organisms. Engineered NLuc has been extensively exploited in bioimaging of organelles, tumor growth, neuron functions, gene transfections, as well as biosensing of a variety of analytes in cell culture and mouse models. Based on the NLuc-derived BRET, this versatile tool could be utilized not only for bioimaging and biosensing but also has found universal applications in different forms of phototherapy, such as photoreleasing of antigens, photocatalytic and optogenic therapy, as well as PDT. However, despite this progress achieved, there remain many challenges regarding clinical translations for the NLuc-based BRET-powered theranostic agents, which may include the following aspects: (1) Bioluminescence microscopy has not reached the same level of prevalence compared with fluorescence imaging, partially because of its relatively weak emission intensity, and the lack of the prevailing of sensitive yet affordable detectors, making it difficult to study of subcellular event. (2) The bioluminescent signal reporters are relatively limited yet complicated, usually necessitating the tedious transfection of a modified NLuc gene in cells or animals, which is not as convenient as adopting commercially available fluorescent dyes. (3) The emission wavelength of most NLuc-derived systems is restricted to the visible range or the first near-infrared window (NIR-Ⅰ) (700–1000 nm), which still faces the issue of light penetration. (4) Most of the BRET-driven bioimaging, biosensing, and phototherapy systems lack stimulus-responsiveness, which makes the targeting of specific scenarios difficult. (5) The clinical translation of the NLuc system is contingent upon its biocompatibility, immunogenicity, and stability under physiological conditions. Current empirical evidence indicates that NLuc-based fusion proteins generally exhibit favorable biocompatibility profiles, with negligible cytotoxicity reported across a range of mammalian cell lines and in vivo models [85–88]. Furthermore, NLuc has been shown to exhibit high in vivo stability, allowing for long-term bioluminescence production necessary for longitudinal studies [85–88]. However, as a protein of non-mammalian origin, NLuc has the potential to provoke immune reactions following systemic delivery, which could constrain its utility in therapeutic contexts requiring repeated administration [89].
Therefore, to address these challenges, future research may focus on: (1) The optimization of bioluminescent luciferase/substrate pair to obtain ultrabright emission (if applicable, using modern techniques such as AI-based algorithms) or exploration of ultra-sensitive photon detectors (such as the EMCCD [90], QIS [20], scientific complementary-metal-oxide-semiconductor (sCMOS) [91]) or optimization of anti-noise algorithms [87]. (2) The protein tag techniques have greatly expanded the scope of BRET-driven theranostics, as the performance of such systems can be adjusted by varying their corresponding complementary ligands [92–95]. In addition, the exploitation of direct delivery systems or site-specific chemo-modification [96–98] for NLuc with cell specificity and organ precision while guaranteeing long-term blood circulation and avoiding enzyme degradation will be appealing. (3) Developing NLuc systems that emit in the NIR-Ⅱ region (1000–3000 nm) [97–101]. (4) Organic or organometallic photosensitizers are potent alternatives to the fluorescent or photosensitizing proteins, whose chemical structures can be readily modified through synthetic chemistry to adapt to a variety of activatable theranostics [102–104]. (5) The rise of organoid technology offers a highly biomimetic and scalable platform for rigorously assessing NLuc biocompatibility before advancing to human trials, thereby accelerating the clinical translation of bioluminescence-based systems [105,106]. We believe that with the joint efforts of scientists in chemistry, chemical physics, and chemical biology, this self-illuminating theranostic tool will not only benefit the biomedical fields but also promote the development of other related realms, such as environmental analysis and plant growth regulation.
The authors declare that they have no known competing financial interests or personal relationships that could have appeared to influence the work reported in this paper.
Acknowledgments
This research was supported by GuangDong Basic and Applied Basic Research Foundation (No. 2023B1515120001) and Shenzhen University 2035 Program for Excellent Research (Nos. 00000208, 00000225). We also thank Shenzhen Science and Technology Program (No. RCBS20231211090515015) and the China Postdoctoral Science Foundation (No. 2024M752099).
[1]
A. Salehi Farid, J.E. Rowley, H.H. Allen, et al., Nature 639 (2025) 214–224. doi: 10.1038/s41586-024-08441-6
[2]
C. Xu, X. Qin, X. Wei, et al., Nat. Nanotechnol. 20 (2024) 286–295.
Figure 1
(A) The luciferin/luciferase reaction and the emission maxima of its reaction products. (B) The bioluminescent reaction between NanoLuc and furimazine. (C) Bioluminescence stability of the NanoLuc/furimazine reaction system. Bioluminescence microscopy of U2OS cells displaying whole-cell staining (D), mitochondrial (E), endoplasmic reticulum (F), cytosolic (G), plasmic membrane (H), and nuclear localization (I), respectively. (C–F): Reproduced with permission [30]. Copyright 2014, Wiley-VCH GmbH. (G–I): Reproduced with permission [31]. Copyright 2012, American Chemical Society. Scale bars: 100 µm (D), 20 µm (E, F), 40 µm (G–I).
Figure 2
(A) Schematic illustration of the NanoLuc-GFP conjugate (GpNLuc). Created with BioRender.com. (B) Bioluminescence imaging of the mouse brain with different luciferases. Reproduced with permission [35]. Copyright 2023, Nature Publishing Group.
Figure 3
(A) Schematic illustration of the NLuc-β2AR imaging system. Fluorescence (B) and bioluminescence (C) microscopy studies on the interaction of NLuc-β2AR with its antagonists (propranolol and ICI118551) using MDA-MB-231 cells that express NLuc-β2AR. (D, E) Bioluminescent tracking of tumor growth and metastasis. (F) Comparison of bioluminescence and fluorescence on interaction of NLuc-β2AR with ICI118551 in tumor-bearing living mice. Reproduced with permission [39]. Copyright 2018, Elsevier.
Figure 4
(A) Schematic illustration of the NLuc-derived NanoBRET system. (B) Optimized spectral separation. (C) Arginine vasopressin-induced interaction between β-arrestin 2 and vasopressin receptor 2 (AVPR2-HT). Reproduced with permission [40]. Copyright 2015, American Chemical Society.
Figure 6
(A) Schematic illustration of the bioluminescent Zn2+ sensor. (B) Bioluminescent microscopy of transfected HeLa cells without and with disturbances. Reproduced with permission [48]. Copyright 2016, American Chemical Society.
Figure 7
(A) Schematic illustration of the HaloTag-NLuc-based bioluminescent Ca2+ sensor. (B) Normalized bioluminescence emission of the sensors in the absence and presence of Ca2+. (C) Normalized BRET signal ratios of living 293 cells transfected with HaloTag-NLuc, and then reacted with different Ca2+-responsive dyes (MaPCa). Reproduced with permission [51]. Copyright 2022, American Chemical Society.
Figure 8
Schematic illustration of the NLuc-mNeonGreen bioconjugate-based sensor for caspase 3. Reproduced with permission [59]. Copyright 2017, American Chemical Society.
Figure 10
Schematic illustration of the bioluminolysis-induced drug release. Reproduced with permission [68]. Copyright 2019, Wiley-VCH GmbH under [CC BY-NC-ND 4.0] [http://creativecommons.org/licenses/by/4.0/].
Figure 11
Schematic representation of NanoLuc-miniSOG genetically encoded system for BRET-mediated PDT. Reproduced with permission [75]. Copyright 2018, Elsevier.
Figure 12
Schematic illustration of the photocytotoxic effects of BRET-driven PDT using mChNLuc-CRY2 hybrid. Reproduced with permission [79]. Copyright 2021, Wiley-VCH GmbH.


 DownLoad:

 下载:
下载:


 下载:
下载:

