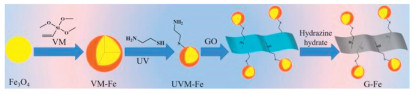
Figure 1.
Preparation process of composite materials.
Reduced graphene oxide/Fe3O4 composite material integrated with electromagnetic wave absorption, thermal conductivity and corrosion resistance
Chang-An Xu , Yue Yu , Yuanming Tan , Shuxi Gao , Hao Pang

The expansion of 5 G technology have brought the challenge of electromagnetic radiation pollution to the forefront [1]. Electromagnetic absorbing materials provide an effective means to attenuate incident waves [2]. Given this critical function, advancing the research on high-efficiency absorbing materials has become a highly prioritized research field. Graphene is considered a promising electromagnetic wave absorbing material due to its exceptional electrical conductivity, which enables it to cause significant conduction loss. However, excessive conductivity can lead to poor impedance matching, resulting in strong microwave reflection and thereby causing secondary electromagnetic pollution. Moreover, the loss mechanism of graphene is primarily limited to conduction loss, which restricts its absorption effectiveness.
A prevalent strategy to enhance graphene's wave-absorbing properties is compounding it with magnetic materials. Liu et al. synthesized reduced graphene oxide (rGO)/Fe3O4 nanocomposites, finding that a mass ratio of 2:1 yielded an RLmin of −48.6 dB at 14.4 GHz [3]. Xing et al. developed PEDOT/Fe3O4-modified rGO via "chemical one-step method". They demonstrated that the incorporation of PEDOT/Fe3O4 improved the impedance characteristics of rGO, with an RLmin of −52.4 dB at 1.46 mm [4]. These findings confirm that integrating magnetic materials with graphene is an effective route for developing high-efficiency electromagnetic wave absorbing material. However, previous studies have predominantly focused on the electromagnetic wave absorption performance, with little attention paid to other critical properties such as thermal conductivity and corrosion resistance. This narrow focus poses a significant limitation, as the lack of multifunctional compatibility makes it difficult for most microwave absorbing materials to withstand variable natural environments. Consequently, a comprehensive evaluation of these additional properties is crucial for assessing the material's potential in practical applications.
Inspired by previous work, this study developed a novel strategy to fabricate rGO/Fe3O4 composites (Fig. 1). The process began with silicified Fe3O4 with β-mercaptoethylamine via a click chemistry reaction, which was subsequently grafted onto GO through the reaction between amino groups and the carboxyl/epoxy groups on GO. The composite was obtained after a reduction step. This synthetic approach has been scarcely reported and the successful grafting of Fe3O4 to GO was confirmed by various techniques. By adjusting the mass ratio of modified Fe3O4 to GO, we achieved controllable modulation of the composite's properties. Owing to its unique molecular composition, the composite exhibited outstanding electromagnetic wave absorption, thermal conductivity, and corrosion resistance.
In Fig. S1a (Supporting information), for VM-Fe, the peaks at 3435 and 1600 cm-1 were hydroxyl and double bond groups. The peak at 1080 cm-1 was Si-O bond, and the peaks at 576 and 636 cm-1 were Fe-O bond. For UVM-Fe, no double bond and thiol peak peaks were detected, and a new peak appeared at 886 cm-1 (C-S bond). In Fig. S1b (Supporting information), there was a mass loss of 2.7 wt% in Fe3O4 before 200 ℃, which was caused by the escape of structural water and the physical adsorption of water on the surface of Fe3O4 [3]. For VM-Fe, its mass loss before 200 ℃ was reduced, and its residual carbon rate was 95.0 wt%, which was higher than 94.8 wt% of Fe3O4. For UVM-Fe, the mass loss after 200 ℃ was greater, and its residual carbon rate was reduced to 87.4 wt%, because of the poor heat resistance of β-mercaptoethylamine grafted on UVM-Fe. In Fig. S1c (Supporting information), all samples except for GO and RGO exhibited ferromagnetism. The saturation magnetization of Fe3O4 was 56.2 emu/g, and the saturation magnetization intensity of VM-Fe did not change much. For UVM-Fe, its saturation magnetization decreased to 50.0 emu/g. For RGO and GO, their magnetic saturation intensity was approximately 0 emu/g. The magnetic saturation intensity of G1-Fe, G2-Fe, G3-Fe showed an increasing trend, with values of 22.1, 30.0, and 41.7 emu/g. In Fig. S2a (Supporting information), C 1s, O 1s, Fe 2p peaks were observed at 284.0, 530.0, and 710.6 eV. The Si 2p peak appeared at 151.8 eV on VM-Fe and UVM-Fe. The peaks at 163.2 eV and 398.9 eV on UVM-Fe corresponded to S 2p and N 1s. Subsequently, peak fitting was performed on the carbon and iron elements in UVM-Fe. In Fig. S2b (Supporting information), there were C-S (286.5 eV), C—N (285.4 eV), C—C (284.6 eV) and C-Si (284.1 eV) bonds in UVM-Fe. In Fig. S2c (Supporting information), the peaks at 710.6 and 724.0 eV were attributed to Fe 2p3/2 and Fe 2p1/2. Each peak could be deconvolved into two spin orbit peaks, which were the peaks of Fe3+ (712.2 and 725.8 eV) and Fe2+ (710.3 and 723.8 eV) [3]. In Fig. S3a (Supporting information), Fe3O4 had a serious self-polymerization, but the dispersion of VM-Fe (Fig. S3b in Supporting information) and UVM-Fe (Fig. S3c in Supporting information) was improved, due to the insulating and barrier properties of the grafts material on its surface. In Fig. S4a (Supporting information), there were 43.2% iron, 54.4% oxygen, 2.4% carbon in Fe3O4, and 2.6% silicon was detected on VM-Fe. In UVM-Fe, 2.3% nitrogen and 1.8% sulfur were detected. The above analysis indicated that UVM-Fe had been successfully prepared.
In Fig. S4b (Supporting information), carbon and oxygen in GO were 69.01% and 30.99%, but the oxygen on RGO decreased to 11.23%, indicating that fewer oxygen-containing groups were retained. In Fig. S4c (Supporting information), the peaks at 1593.2 and 1346.0 cm-1 correspond to G and D band peaks. Among them, the ID/IG value of GO was 1.28, indicating that there were many defects on GO. The ID/IG value of RGO was 1.08, indicating that its surface defects were reduced. The fluctuation of ID/IG values of G-Fe was not large, which was consistent with the research findings of Liu et al. [3]. In addition, all samples exhibited characteristic peaks at 2685.6 and 2915.9 cm-1, indicating the presence of graphite structures in all samples. In Fig. S4d (Supporting information), the conductivity of RGO, G1-Fe, G2-Fe, G3-Fe were 26.65, 7.21, 3.80 and 1.29 S/cm. This indicated that the introduction of modified Fe3O4 was beneficial for reducing the electrical conductivity of the composite material. In Fig. S5a (Supporting information), GO had a distinct wrinkled structure, while the surface of RGO (Fig. S5b in Supporting information) became smooth. In Fig. S5c (Supporting information), there were many porous and damage defects on RGO. In Figs. S5d-f (Supporting information), there was a rough granular material adhering to the surface of G-Fe (G1-Fe < G2-Fe < G3-Fe), which were modified Fe3O4. Meanwhile, more hole defects were observed in them. The above analysis indicated that modified Fe3O4 was grafted onto GO.
The real parts (ε′, µ′) and imaginary parts (ε″, µ″) of complex permittivity and complex permeability represent the storage capacity and loss capacity of material for electric energy and magnetic energy [5]. In Figs. S6a and b (Supporting information), samples showed a degraded ε′ and ε″, due to the frequency dispersion phenomenon of carbon materials [6]. According to the free electron theory, a high ε" indicated a high electrical conductivity, and the ε" relationship of composites was consistent with the electrical conductivity. The order of ε′ and ε″ was RGO > G1-Fe > G2-Fe > G3-Fe. In Fig. S6c (Supporting information), the fluctuations of the curve were mainly due to the relaxation peaks caused by the polarization effect. With the grafting of modified Fe3O4 on GO, the dielectric properties of composites were reduced. In Fig. S6d (Supporting information), the µ′ change was similar to ε′ below 9 GHz. In Fig. S6e (Supporting information), RGO had a lower µ″ value, while G3-Fe had the highest µ″ value. In Fig. S6f (Supporting information), the tanδ µ change was consistent with µ″. The existence of a negative function in the imaginary part of the composite material was related to the direct current generated inside the composite material due to the migration of carriers caused by the external magnetic field. From this, it could be known that dielectric loss played a dominant role in the attenuation of electromagnetic waves.
In Figs. S6g-j (Supporting information), multiple Cole-Cole semicircles were discovered, indicating that there were multiple Debay relaxation process. The linear segments were related to the conduction loss. If magnetic loss of samples is mainly caused by eddy current losses, the µ″(µ′)-2 f-1 (C0) value does not change with the frequency. In Fig. S6k (Supporting information), the C0 of composites in the range of 8–18 GHz were basically constant, indicating that existence of eddy current loss. The curve also showed fluctuations in this frequency range, which was the result of exchange resonance. Attenuation constant is related to the attenuation ability of samples to the electromagnetic wave. In Fig. S6l (Supporting information), the attenuation constant (α) of composites increased with the increase of frequency, the relationship was RGO > G1-Fe > G2-Fe > G3-Fe. Although RGO had a good attenuation capacity for electromagnetic waves, its absorption performance was not the best, which was related to the impedance matching performanc.
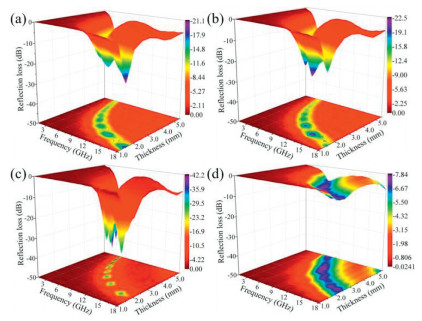
Reflection loss (RL) is a key indicator for evaluating the ability of samples to absorb electromagnetic waves [7]. In Fig. 2 and Fig. S7 (Supporting information), as the thickness increased, RLmin peak shifted towards the low frequency. In Fig. S8 (Supporting information), for RGO, the RLmin were all higher than −21.1 dB, which was related to the fact that its high electrical conductivity caused electromagnetic waves to be reflected. The RLmin of G-Fe composites showed a trend of first decreasing and then increasing, and the absorbing performance of G2-Fe was the best. When the thickness was 5.5 mm, its RLmin at 4.91 GHz was −42.0 dB. This was because G2-Fe not only had dielectric loss and magnetic loss, but also had a relatively appropriate impedance matching capability. Researchers use the quarter-wavelength model to study the relationship between the frequency and thickness at RLmin peak [8, 9]. In Figs. S7e-h, RLmin peak of composites was similar to the thickness falling on the fitting curve, indicating that the relationship between the thickness of composites and the peak frequency followed the quarter wavelength model. In Fig. S9 (Supporting information), the maximum effective absorption bandwidths (EAB) of RGO, G1-Fe, and G2-Fe all occured at 2 mm, they were 4.93, 5.70, and 4.85 GHz. With the introduction of modified Fe3O4, the maximum EAB of composites shifted towards Ku band. In Fig. S10 (Supporting information), the Z value of G2-Fe was generally closer to 1, indicating good impedance matching [10], while the impedance matching performance of other samples was relatively poor. Radar cross-section (RCS) is a very important simulation method for understanding electromagnetic phenomena [11]. In Figs. S11a-d (Supporting information), the scattering intensity of G2-Fe was the lowest, indicating that it had a strong ability to attenuate incident electromagnetic waves. In Fig. S11e (Supporting information), when the detection angle extended from 0° to ± 75°, the RCS value decreased and showed a fluctuating phenomenon. The result once again confirmed that G2-Fe had an outstanding ability to dissipate electromagnetic waves. In Fig. S11f (Supporting information), when the angle varied from 0 to 75°, the RCS value of G2-Fe decreased the most at 0°, which was 11.8 dB m2, demonstrating excellent radar wave attenuation capability.
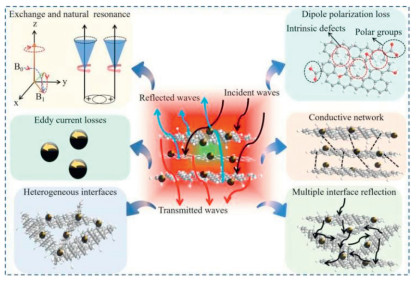
The loss mechanism (Fig. 3) of composites to electromagnetic waves was as follows: (1) Some oxygen-containing groups remained on the reduced GO, while the introduced modified Fe3O4 also contained heteroatoms sulfur and nitrogen. These functional groups and atoms would act as polarization centers, generating dipole polarization losses. In addition, there were local defects on the reduced GO, which also played a role in attenuating electromagnetic waves; (2) The composite material had a certain degree of electrical conductivity. Under the action of a magnetic field, it would induce current, resulting in transmission loss and the dissipation of electrical energy; (3) Many heterogeneous interfaces would be formed between the reduced GO and modified Fe3O4 in the composites as well as among themselves. When exposed to electromagnetic fields, charges accumulate at these uneven interfaces, converting electromagnetic energy into thermal energy through interface polarization. Furthermore, these heterogeneous interfaces and the network structures formed within them would reflect electromagnetic waves multiple times, thereby enhancing their ability to absorb and dissipate electromagnetic waves; (4) The magnetic ions in the composite material would enhance the loss capacity of electromagnetic waves through intrinsic natural resonance, exchange resonance and eddy current loss mechanisms.
In Fig. 4a, RGO had the highest thermal conductivity, with a value of 1.981 W m-1 K-1. After the modified Fe3O4 was introduced into GO, although the thermal conductivity of the composite material was reduced, its value was still above 1.486 W m-1 K-1. The reason for the decrease in the thermal conductivity of the material after the introduction of Fe3O4 was related to the fact that the thermal conductivity of Fe3O4 was lower than that of graphene on the one hand, and on the other hand, it was related to the mismatch of the interface between the two, which leaded to the enhanced scattering of phonons at the interface. Nevertheless, this value was not only superior to that of traditional epoxy resin (0.1–0.2 W m-1 K-1) and polyethylene (0.1–0.5 W m-1 K-1) polymers, but also higher than that of the GNS-AOBPO composite material (1.161 W m-1 K-1) prepared by Zong et al. [12] and the S-PDMS/m-CNT@rGO composite material (1.06 W m-1 K-1) prepared by Li et al. [13]. In Fig. 4b and Fig. S12 (Supporting information), when composites were placed on a constant temperature table at 80 ℃, they reached the maximum temperature within 20 s, and with extension of time, the temperature change was small. Within 20 s, RGO had the maximum heating rate, with the highest temperature reaching 72.1 ℃. For G1-Fe, G2-Fe and G3-Fe, their temperatures reached 70.7, 61.8 and 61.5 ℃. It indicated that composite materials had excellent heat transfer ability.
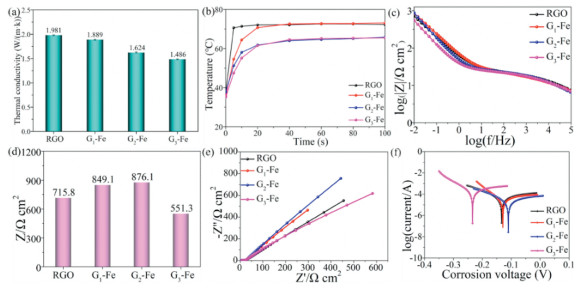
Generally speaking, materials with good anti-corrosion performance often have a large impedance modulus (at 0.01 Hz), corrosion voltage, impedance arc radius and a low corrosion current [14]. In Figs. 4c and d, the modulus value of RGO at 0.01 Hz was 715.8 Ω cm2. When modified Fe3O4 was introduced onto GO, its modulus value showed a trend of first increasing and then decreasing. The modulus value of G2-Fe was the largest, which was 876.1 Ω cm2. This was because introduction of Fe3O4 not only effectively filled the defects on the reduced GO, but also the nanomaterials of different nanoscales could play a synergistic role, resulting in an enhanced corrosion resistance performance of the material. However, excessive Fe3O4 could cause the composite material to agglomerate due to magnetic attraction, resulting in the composite material not being well laid on the metal surface and ultimately leading to a decline in its corrosion resistance performance. In Fig. 4e, G2-Fe had a large impedance arc radius, indicating that it had a strong charge transfer resistance ability and good corrosion resistance [15]. In Fig. 4f and Table S1 (Supporting information), RGO had a relatively large corrosion current (5.83 × 10– 5 A) and a relatively low corrosion voltage (−0.133 V), indicating that it had poor corrosion resistance performance. Similarly, the corrosion voltage of G1-Fe and G2-Fe increased, while the corrosion current decreased, and their corrosion resistance performance was enhanced. However, G3-Fe had the largest corrosion current (8.22 × 10– 5 A) and the smallest corrosion voltage (−0.234 V), and its corrosion resistance performance was the poorest.
In summary, a modified Fe3O4-grafted GO composite was synthesized via a three-step reaction. System characterization indicated that the introduction of Fe3O4 effectively regulated the microstructure, electrical conductivity and electromagnetic parameters of the composite material. When the mass ratio of GO to UVM-Fe was 1:1, the G2-Fe exhibited optimal impedance matching and the best microwave absorption performance. At a matching thickness of 5.5 mm, the RLmin reached −42.0 dB. Moreover, the thermal conductivity of composite materials was maintained above 1.486 W m-1 K-1, and the G2-Fe showed excellent corrosion resistance performance, with a corrosion current as low as 3.07 × 10– 5 A. The excellent comprehensive performance of G2-Fe was mainly related to the synergistic effect between reduced GO and Fe3O4 at different nanoscales. This composite material had broad application potential in fields such as electromagnetic protection of 5 G equipment, heat dissipation of high-power electronic devices, and coating protection in corrosive environments. In the future, efforts can be made to further optimize the dispersibility and interfacial bonding strength of Fe3O4. Additionally, attention should be paid to tracking the microscopic corrosion morphology and long-term corrosion resistance of the protected metal surface, in order to assess its usage requirements in practical application scenarios.
The authors declare that they have no known competing financial interests or personal relationships that could have appeared to influence the work reported in this paper.
Chang-An Xu: Writing – original draft, Software, Project administration, Investigation, Funding acquisition, Formal analysis, Data curation. Yue Yu: Methodology, Formal analysis, Data curation. Yuanming Tan: Visualization, Validation, Supervision. Shuxi Gao: Resources, Investigation, Conceptualization. Hao Pang: Writing – review & editing, Validation, Supervision, Project administration.
This work was supported by the Guangdong Basic and Applied Basic Research Foundation (No. 2023A1515110462), the GDAS' Project of Science and Technology Development (No. 2022GDASZH-2022010109), the Science and Technology Special Commissioner Program of Jiangmen (No. 2024760000450010128).
Supplementary material associated with this article can be found, in the online version, at doi:
J. Liu, X. Yang, W. Chen, et al., Chin. Chem. Lett. 36 (2025) 111293. doi: 10.1016/j.cclet.2025.111293
J. Luo, L. Wu, J. Yan, et al., Chin. Chem. Lett. 36 (2025) 111065. doi: 10.1016/j.cclet.2025.111065
X. Liu, Y. Huang, L. Ding, et al., J. Mater. Sci. Technol. 72 (2021) 93–103. doi: 10.1016/j.jmst.2020.09.012
C. Xing, A. Xia, W. Li, et al., Carbon 232 (2024) 119764.
Y. Shen, Z. Ma, F. Yan, et al., Adv. Funct. Mater. 35 (2025) 2423947. doi: 10.1002/adfm.202423947
Z. Wu, X. Tan, J. Wang, et al., Nano-Micro Lett. 16 (2024) 107. doi: 10.1007/s40820-024-01326-3
R.R. Henriques, L.F. Calheiros Souto, A.A. Silva, et al., MSEB 314 (2025) 117994. doi: 10.1016/j.mseb.2025.117994
Y. Cui, K. Yang, Y. Lyu, et al., Carbon 196 (2022) 49–58. doi: 10.1016/j.carbon.2022.04.044
Z. Wu, S. Xie, C. Ma, et al., Constr. Build. Mater. 463 (2025) 140095. doi: 10.1016/j.conbuildmat.2025.140095
H. Peng, Z. Xie, S. Lu, et al., Chin. Chem. Lett. 36 (2025) 110818. doi: 10.1016/j.cclet.2025.110818
L. Chen, J. Pan, T. Wang, et al., Adv. Funct. Mater. 35 (2024) 2409432.
Y. Zong, D. Gui, K. Niu, et al., Mater. Today Commun. 38 (2024) 108067. doi: 10.1016/j.mtcomm.2024.108067
J. Meng, J. Song, X. Zhang, et al., Compos. Commun. 42 (2023) 101693. doi: 10.1016/j.coco.2023.101693
C.A. Xu, W. Liang, P. Hong, et al., Microstructures 5 (2025) 2025037.
B. Zhan, Y. Qu, X. Qi, et al., Nano-Micro Lett. 16 (2024) 221. doi: 10.1109/iccia62557.2024.10719061

Figure 3 Diagram of the loss mechanism of composite materials to electromagnetic waves.

 扫一扫看文章

扫一扫关注我们
 DownLoad:

 下载:
下载:


 下载:
下载: