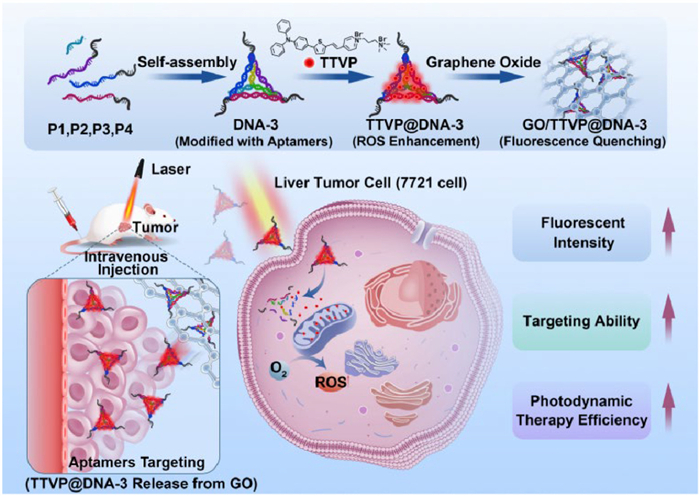
Scheme 1.
Illustration of the GO-based aptamer-guided DNA tetrahedron carrier as a high-targeted photosensitizer delivery system for liver tumor cells (7721 cells) with enhanced PDT.

Graphene oxide-based aptamer-guided DNA tetrahedron carrier as photosensitizer delivery system for potent photodynamic therapy of liver tumor
Ke Ma , Yuanwei Wang , Guihong Lu , Miaomiao Kang , Zhijun Zhang , Ziwei Ma , Dong Wang , Ben Zhong Tang , Hui Tan


Over the past decade, optical sense-and-treat systems relying on stimuli-responsive drug delivery carriers have attracted a great deal of attention in personalized tumor medicine due to their good susceptivity, controllability and biocompatibility [1–6]. The typical optical stimuli-responsive drugs are photosensitizers with photodynamic therapy (PDT) effect or photothermal therapy (PTT) effect [7–11]. Photosensitizers have been clinical applied as effective adjuvant drug to treat terminal cancer patients overseas [12–15]. However, the poor selectivity of those photosensitizers severely hampers their targeted therapeutic capability in oncology. Therefore, nano-carriers are crucial for targeted photosensitizer delivery, which can improve the target identification ability of photosensitizers in optical sense-and-treat systems [16–18].
Among lots of nano-carriers, DNA tetrahedra nanostructures have unique intrinsic advantages, such as regulable size, structural rigidity, rapid penetration, sustained drug release, and the programmability of specific sequences (e.g., DNA aptamers, RNA aptamers, peptides) modified to their tetrahedra structure corners [19–21]. These DNA tetrahedra have been used for rapid drug delivery, sense-and-treat, logic gate, functional scaffold, and dynamic network design [22–25]. The applications of DNA tetrahedra combined with photosensitizers in cancer sensing and treating also attract growing interests [26,27]. However, most photosensitizer-combined DNA tetrahedra systems presented low-selectivity or inadequate PDT effect, which were insufficient for both in vitro and in vivo cancer treatment [28–30]. There was only one reported high-targeted photosensitizer delivery system based on DNA tetrahedra carriers, but the high antitumor efficiency was achieved via synergistic therapy, not the enhanced PDT treatment [31]. To simply elevate the antitumor efficiency by the enhanced PDT treatment, more straightforward systems are required.
To enhance the PDT effect in the DNA tetrahedra-based photosensitizer delivery system, we have proved that DNA tetrahedra could effectively improve the PDT effect and luminous efficacy of aggregation-induced emission (AIE)-active photosensitizers, which could interact with DNA duplex mainly by intercalations [32]. To increase the target identification ability of aptamer-guided DNA tetrahedral carriers, our preceding study has developed a graphene oxide (GO)-based aptamer-guided DNA tetrahedral carrier, which presented high-selectivity by the aid of GO [33].
On the basis of our previous strategies, we design a GO-based three aptamers-guided DNA tetrahedron carrier as a high-targeted AIE-active photosensitizer delivery system with enhanced PDT effect. As illustrated in Scheme 1, a three hairpin switch aptamers-modified DNA tetrahedron (DNA-3) acts as a drug carrier, which can recognize the target liver cells [26,34]. TTVP photosensitizers [35], a kind of AIE-active drug, are loaded in the DNA-3 framework mainly through intercalations, resulting in the enhanced PDT effect and fluorescent amplification of TTVP. With the aid of GO, three aptamers-modified DNA-3 framework can be immobilized on GO surface to form a targeted photosensitizer delivery system (GO-based TTVP@DNA-3), which effectively inhibits the digestion of aptamers by nucleases and indirectly increases the selectivity of the system. Meanwhile, the loaded TTVP will be fluorescence quenched by GO. In the presence of liver tumor cells, the aptamer-guided DNA nanomaterials will be released from GO surface and rapidly identify the target tumor cells. This system has a great potential for both in vitro and in vivo high-targeted and enhanced PDT treatment.
This work aims to construct a high-targeted photosensitizer delivery system for enhanced PDT treatment, relying on the combination of aptamer-guided DNA tetrahedron, graphene-oxide and photosensitizer.
DNA-3 was constructed by the self-assembly of four single-stranded DNA (ss-DNA) sequences (P1, P2, P3, P4) according to our previous work [31]. The sequence details were shown in Table S1 (Supporting information). The interactions between DNA-3 and TTVP were investigated by both absorption spectrogram and circular dichroism (CD). As shown in Fig. S1 (Supporting information), TTVP had an intrinsic absorption peak at 478 nm (Fig. S1A). This characteristic absorption peak presented an absorbance reduction and a red-shift to 488 nm after the addition of increasing double-stranded DNA (ds-DNA), which was formed by P1 and its complementary chain. This apparent hypochromic effect revealed that TTVP could be intercalated in ds-DNA double helix. CD spectra further testified the intercalation between TTVP and ds-DNA. As shown in Fig. S1B, ds-DNA had two characteristic bands at 247 nm (negative band) and 277.3 nm (positive band). After the addition of TTVP, both negative band and positive band were blue-shifted, and the intensity of negative band was enhanced. This conformational change of ds-DNA also revealed the main intercalation between TTVP and ds-DNA. However, this conformational change was not a typical Z-form structure shift, implying that other interactions existed between TTVP and ds-DNA, such as electrostatic interaction and hydrophobic interaction.
To trace the optimal drug proportion, fluorescence spectrophotometer was applied to measure the content of TTVP in DNA-3. Fig. S2 (Supporting information) displayed the fluorescence spectra of pristine TTVP. Low concentration of TTVP (1–5 µmol/L) exhibited weak fluorescence in H2O solvent, which was beneficial in "turn-on" bioimaging. High concentration of TTVP (7–50 µmol/L) presented rather high fluorescence, a high background noise, which was not desirable for biosensing. Thus we chose 5 µmol/L as the optimal TTVP content loaded in DNA-3 carrier. Then the optimal TTVP/DNA-3 proportion was ensured by adding different amount of DNA-3 into TTVP (5 µmol/L) solution. As displayed in Fig. S1C, the highest emission appeared with the addition of 100 nmol/L DNA-3, however, further addition of DNA-3 resulted in a slight quenching phenomenon probably due to the cage effect of DNA-3. Therefore, the optimal TTVP/DNA-3 proportion was 5 µmol/L/100 nmol/L. To evaluate the TTVP loading capacity of DNA-3, different amounts of TTVP were added into DNA-3 (100 nmol/L) solution (Fig. S1D). In the DNA-3 (100 nmol/L) solution, the fluorescence gradually increased to the maximum with raising TTVP concentration from 1 µmol/L to 50 µmol/L. GO was further applied to immobilize DNA-3 carriers and quench the fluorescence of TTVP@DNA-3. As depicted in Fig. S1E, low content of GO (10 µg/mL) could effectively quench the emission of TTVP@DNA-3 to a low background. Further addition of GO continuously lowered the fluorescence of TTVP@DNA-3, but the decreased degree was restricted. Therefore, 10 µg/mL GO was sufficient to attach and quench the TTVP@DNA-3 mixture. The characteristics of GO/TTVP@DNA-3 were shown in Fig. S3 (Supporting information). The small particle size of DNA-3 (13.0 nm) was enlarged to 51.6 nm after loading with TTVP molecules (Fig. S3A), and the average zeta potential of DNA-3 (−5.40 mV) decreased to −7.80 mV (Table S2 in Supporting information), probably due to the enlarged surface area of DNA-3 presenting more negative surface potential. The particle size of naked GO was about 107.1 nm, and the average zeta potential was −25.33 mV. But the average diameter of GO/TTVP@DNA-3 greatly increased to 662.96 nm, along with the increased average zeta potential of −13.63 mV. It was because the aggregation occurred between GO and TTVP@DNA-3 decreased the exposed superficial area of GO, thus resulting in the increase of zeta potential. Despite the aggregation of GO, the particle size of TTVP@DNA-3 was about 51.6 nm, which was desirable for in vivo diagnosis and treatment. The morphology of DNA-3, GO and GO/TTVP@DNA-3 was also measured by atomic force microscopy (Fig. S3F) and transmission electronic microscopy (Figs. S3G and H), which presented similar results to their particle size distribution. To further ensure the exact TTVP-loading capacity of DNA-3, an ultrafiltration centrifuge tube (Mw 3000) was applied to remove the unloaded TTVP molecules. After ultrafiltration, the filtrate was measured by ultraviolet-visible (UV-vis) spectrometer, and the TTVP concentration in filtrate was calculated to be 0.0233 µmol/L (Fig. S3B). Therefore, the exact TTVP-loading capacity of DNA-3 carrier was 4.9767 µmol/L. To figure out the release ability of TTVP@DNA-3 from GO/TTVP@DNA-3 complex, the UV-vis spectra of TTVP@DNA-3 in phosphate buffer saline (PBS) buffer or in GO/TTVP@DNA-3 staining 7721 cells were tested. As shown in Fig. S3C, the absorbance of TTVP@DNA-3 in PBS buffer was 0.0547, but the absorbance of TTVP@DNA-3 in GO/TTVP@DNA-3 staining 7721 cells decreased to 0.0392. The TTVP concentration in GO/TTVP@DNA-3 staining 7721 cells was calculated to be 4.3978 µmol/L, indicating the release rate of TTVP@DNA-3 from GO/TTVP@DNA-3 complex was about 87.96%. The release kinetics of TTVP@DNA-3 (in 7721 cells) from GO/TTVP@DNA-3 complex was shown in Fig. S3D. The release rate of TTVP@DNA-3 gradually increased within continuous staining time. In addition, the generative capacity of reactive oxygen species (ROS) was measured by using 2, 7-dichlorodihydrofluorescein diacetate (DCFH-DA), a ROS indicator (Fig. S1F). TTVP (5 µmol/L) was added in DCFH-DA (3 µmol/L) solution and undergoes a white light irradiation for 30 min. The fluorescence of DCFH-DA gradually increased to 4.37-fold within 12.5 min irradiation, and further irradiation could not enhance the fluorescence of DCFH-DA. In comparison, After the white light irradiation of TTVP@DNA-3 in DCFH-DA (3 µmol/L) solution, the fluorescence of DCFH-DA reached a maximum (26.11-fold) within 40 min irradiation, indicating that the ROS generation capacity of TTVP@DNA-3 was 6 times higher than that of TTVP. To ensure the DNA-3 role in enhancing the ROS-generating ability of TTVP, the in-cell ROS generation ability of TTVP and TTVP@DNA-3 was analyzed. As shown in Fig. S4 (Supporting information), after 10 min irradiation, the DCFH-DA fluorescence of TTVP@DNA-3 staining 7721 cells was about 1.21 times that of TTVP staining 7721 cells, which was similar to the in-tube generative capacity of ROS. Therefore, DNA-3 can enhance the ROS generation capacity of TTVP, revealing the enhanced PDT effect based on DNA nano-carriers.
To testify the dark cytotoxicity and phototoxicity of this GO-based DNA nano-carrier system, one target cell line (7721 cell) and two non-target cell lines (LO2 cell and HepG2 cell) were used in the controlled trial. As shown in Fig. S5 (Supporting information), 100 nmol/L DNA-3 presented few dark cytotoxicity among three cell lines (Fig. S5A). After the addition of 5 µmol/L TTVP loaded into DNA-3 (100 nmol/L), the dark cytotoxicity had a slight increase, but the dark cytotoxicity of two non-target cell lines was low (LO2 cells: 0%; HepG2 cells: 5.32%), which could be negligible. Additional loading of TTVP (10–40 µmol/L) into DNA-3 (100 nmol/L) leaded to increasing dark cytotoxicity (LO2 cells: 51.71%; HepG2 cells: 57.88%; 7721 cells: 59.12%) among three cell lines, which could not be ignored, thus TTVP with high concentrations (≥10 µmol/L) was improper for DNA nano-carrier system. GO has been reported as a low cytotoxicity material for most cells. Its cytotoxicity among the three cell lines were measured. 100 µg/mL GO showed a rather low cytotoxicity, which could be neglectable (Fig. S5B). However, high concentration of GO (≥200 µg/mL) resulted in the increasing cytotoxicity, which was not desirable for bioimaging. To further confirm the cytotoxicity of GO in TTVP@DNA-3 system, different amounts of GO were added into TTVP@DNA-3 system. As depicted in Fig. S5C, even high concentration of GO (200 µg/mL) presented no dark cytotoxicity among three cell lines. Therefore, the optimal GO content (10 µg/mL) chosen in this GO-based DNA nano-carrier system was predicted to have no influence in dark cytotoxicity experiments. The phototoxicity of TTVP@DNA-3 and GO/TTVP@DNA-3 were measured to figure out their PDT effect for live cells. Figs. S5D–F presented the phototoxicity of TTVP@DNA-3 with the different irradiation time of white light (50 mW/cm2). Overall, the phototoxicity gradually increased with the growing concentration of TTVP and the extended irradiation time. Moreover, after the addition of 5 µmol/L TTVP loaded into DNA-3 (100 nmol/L), the phototoxicity of target cell line (7721 cells: 30.84%) was much higher than that of non-target cell lines (LO2 cells: 10.98%; HepG2 cells: 18.26%). Although the phototoxicity of non-target cell lines was lower, but the cell viability for both non-target cell lines was below 90%, probably due to the relatively lower target identification ability of TTVP@DNA-3 compared to GO/TTVP@DNA-3 system. In comparison, the phototoxicity of GO/TTVP@DNA-3 was high (7721 cells: 85.37%) for target cell line in the presence of 10 µg/mL GO under 10 min irradiation, but low (LO2 cells: 5.47%; HepG2 cells: 6.85%) for non-target cell lines (Figs. S5G–I). It indicated that GO/TTVP@DNA-3 system had an obviously enhanced PDT effect compared to TTVP@DNA-3. Interestingly, the phototoxicity gradually declined with the increasing amount of GO, possibly because more addition of GO could absorb the energy of white light, which weakened the energy absorbed by TTVP.
To compare the labeling capacity between TTVP@DNA-3 and GO/TTVP@DNA-3, three cell lines were stained within different staining time. As shown in Fig. S6 (Supporting information), after 120 min staining, the target cells (7721 cells) were completely labeled by TTVP@DNA-3 with a bright red color, yet the non-target cells (LO2 cells and HepG2 cells) could also be labeled by TTVP@DNA-3 with a relatively weak red color. However, the shorter staining time (15–60 min) made it no difference between target cells and non-target cells (Figs. 1A–D), which revealed the drawbacks by short-time TTVP@DNA-3 labeling. By contrast, GO/TTVP@DNA-3 presented great labeling capacity in both short-time and long-time target cells labeling, but no labeling for non-target cells (Figs. 1A–E). It indicated that GO/TTVP@DNA-3 had a stronger target labeling capacity compared with TTVP@DNA-3. Therefore, the target cells can be recognized by GO/TTVP@DNA-3 labeling in a short time (< 60 min). To further verify the specific binding of GO/TTVP@DNA-3 to target cells compared to non-target cells, we have done the flow cytometry test. As shown in Fig. S7 (Supporting information), all target cells and non-target cells showed the fluorescence signal of Hoechst 33342, but only target cells presented the fluorescence signal of TTVP, along with no fluorescence signal of TTVP for non-target cells, indicating great recognization of GO/TTVP@DNA-3 towards target cells.
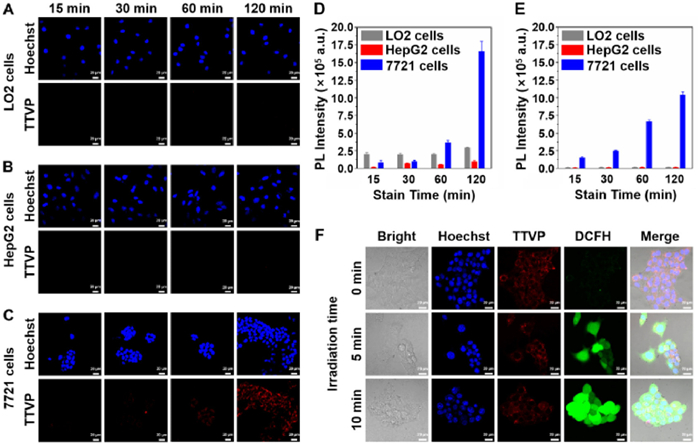
The in vitro ROS generation ability of GO/TTVP@DNA-3 has been measured. As illustrated in Fig. 1F, target cells were first labeled with GO/TTVP@DNA-3 for 60 min, then the superfluous dye was eliminated through PBS washing, followed by the Hoechst 33342 staining and DCFH-DA staining. After repetitive PBS washing, the labeled target cells were irradiated by white light (50 mW/cm2) for different irradiation time (0, 5, 10 min). It demonstrated that there was no DCFH-DA emission in the absence of irradiation, thus no ROS generated without white light irradiation. The fluorescence intensity of DCFH-DA enhanced with the extended irradiation time, indicating the increasing ROS generation ability under long-time irradiation. To figure out the main sites of ROS production in target cells, the co-localization experiment has been done by using MitoTracker Red CMXRos (mitochondria dye), BODIPY 493/503 (lysosome dye) and GO/TTVP@DNA-3 (Figs. S8A and B in Supporting information). It indicated that the localization of TTVP@DNA-3 was mitochondria, not lysosome. Therefore, the main sites of ROS production from TTVP@DNA-3 should be mitochondria. Another co-localization test has been done by using MitoTracker Red CMXRos, DCFH-DA and GO/TTVP@DNA-3 (Fig. S8C in Supporting information). After 10 min irradiation, all 7721 cells were stained with DCFH-DA, indicating that the produced ROS could spread throughout the entire cell. To further certify the PDT effect caused by ROS generation, PI and FDA dyes were applied for cell dead and alive staining. Fig. S9 (Supporting information) presented the target cells alive and dead state after stained with GO/TTVP@DNA-3 for 60 min and undergoing different irradiation time. With no irradiation, the target cells exhibited strong green emission and no red emission, and the cells growth was great. It suggested that there was no PDT effect in the absence of irradiation. With 5 min irradiation, partial target cells were dead (red color) and others remained alive (green color). As the irradiation time prolonged to 10 min, almost all target cells were dead, revealing that 10 min irradiation leaded to intense PDT effect due to the generation of massive ROS. Therefore, the optimal white light irradiation time was 10 min. In addition, the non-target cells (LO2 cells and HepG2 cells) growth situations were also explored to see the PDT effect of GO/TTVP@DNA-3 on non-targeted treatment (Fig. S10 in Supporting information). First, we eliminated the influence of 10 min irradiation on three cell lines by checking the cell growth in the absence and presence of irradiation. Then, three cell lines were stained with GO/TTVP@DNA-3 for 30 min and irradiated for 10 min. There was no charge for non-target cells growth, but a certain degree of inhibition for target cells growth. After further stained by 60 min, non-target cells remained well-grown, yet target cells stayed in apoptosis. It indicated that GO/TTVP@DNA-3 had great PDT effect on target cells, yet few PDT effect on non-target cells, which was ideal for high-targeted PDT treatment.
Finally, we investigated the in vivo imaging and PDT therapy of GO-based TTVP@DNA-3 system. All the animal procedures were performed and approved according to the guidelines of the Institutional Animal Care and Use Committee at Second People’s Hospital of Shenzhen. The in vivo imaging effect of GO/TTVP@DNA-3 was depicted in Fig. 2A. After the intravenous injection of 50 µL GO/TTVP@DNA-3, the tumor tissues were gradually labeled within prolonged time. The best dyes accumulation time in tumor region appeared at 9 h, which presented a strongest fluorescence signal. After 9 h, the fluorescence signal slowly faded through metabolism, but remained visible in 24 h. To further figure out the fluorescence signal of internal organs, the drug-treated mice were dissected after 24 h staining. As shown in Fig. 2B, the tumor tissue had a prominent fluorescence signal, indicating that the tumor site could be efficiently identified by GO/TTVP@DNA-3. Besides tumor tissue, the kidney and liver also had the fluorescence signals, revealing that the main metabolic pathways were through kidney and liver sites. Curiously, the lung presented a weak fluorescence signal, which was unpredicted for high-targeted imaging. The relative mean fluorescence intensity of tumor and organ tissues was shown in Fig. S11 (Supporting information). The fluorescence intensity of tumor is 2.296 times that of liver, 1.914 times that of kidney, and 5.312 times that of lung, which verified the high targeting ability of GO/TTVP@DNA-3 towards tumor tissue. After confirming the optimal staining time (9 h), in vivo PDT treatment experiments have been done by the intravenous injection of both control groups and test group, along with the phototherapy. The mice undergo twice drug-injections with twice phototherapy processes (Fig. 2C). The first drug-injection happened at 0 h (day 0), and the tumor regions were irradiated by xenon lamp for 30 min at 9 h (day 0), which was the best dyes accumulation time in tumor region. Similarly, the second drug-injection occurred at 24 h (0 h of day 1), and the tumor regions were irradiated by xenon lamp for 30 min at 33 h (9 h of day 1). The whole treatment ended on day 20. As displayed in Fig. 2D, the drug-treatments of both control groups (PBS, TTVP, GO and TTVP@DNA-3) and test group (GO/TTVP@DNA-3) made few influence on the mouse weight, which showed a slight increase during 20-day treatment. The tumor volume showed an obvious distinction between control groups and test group. The tumor volume of test group was totally restricted under the twice PDT treatment of GO/TTVP@DNA-3, while the tumor volumes of control groups rapidly increased to a significative degree. Even the TTVP@DNA-3 group could not sufficiently inhibit the tumor growth compared to the GO/TTVP@DNA-3 group, which indicated the high-targeted and enhanced PDT treatment of GO/TTVP@DNA-3. With no doubt, TTVP@DNA-3 also had a certain extent of targeted and PDT treatment, because the tumor volume of TTVP@DNA-3 group was much smaller than that of PBS group. In contrast, TTVP group and GO group had mild influence on tumor growth. After 20-day treatment, the tumor tissues of control groups and test group were extracted, and the tumor images were shown in Fig. 2G. The tumor sizes were in accordance with the results in Fig. 2E. Moreover, the immunohistochemical studies were investigated after PDT treatment (Fig. 2F). For the control groups, terminal-deoxynucleotidyl transferase mediated nick end labeling (TUNEL) immumo-fluorescence staining of tumor slices verified that few cell apoptosis appeared in the PBS group, TTVP group or GO group, comparing with the certain extent of apoptosis in the TTVP@DNA-3 group. By comparison, high-density of dead tumor cells occurred after treated with GO/TTVP@DNA-3 group, which presented a much higher degree than TTVP@DNA-3 group. The KI67 immuno-fluorescence staining further testified the cell proliferation for both control groups and test group. There were few proliferating tumor cells after treated with GO/TTVP@DNA-3, but excess proliferating tumor cells in the control groups. Compared with PBS group and GO group, TTVP group presented a lower density of proliferating tumor cells, indicating that TTVP had a slight inhibition on tumor growth. Combining cell proliferation with cell apoptosis, TTVP@DNA-3 did have an inhibition effect on tumor growth and PDT effect for cell apoptosis, but could not completely stop the cell proliferation. In contrast, GO/TTVP@DNA-3 could totally stop the tumor cell proliferation by high-targeted and enhanced PDT effect. These results illustrated that GO/TTVP@DNA-3 could be applied as a highly versatile theranostic agent in high-targeted and enhanced PDT treatment.
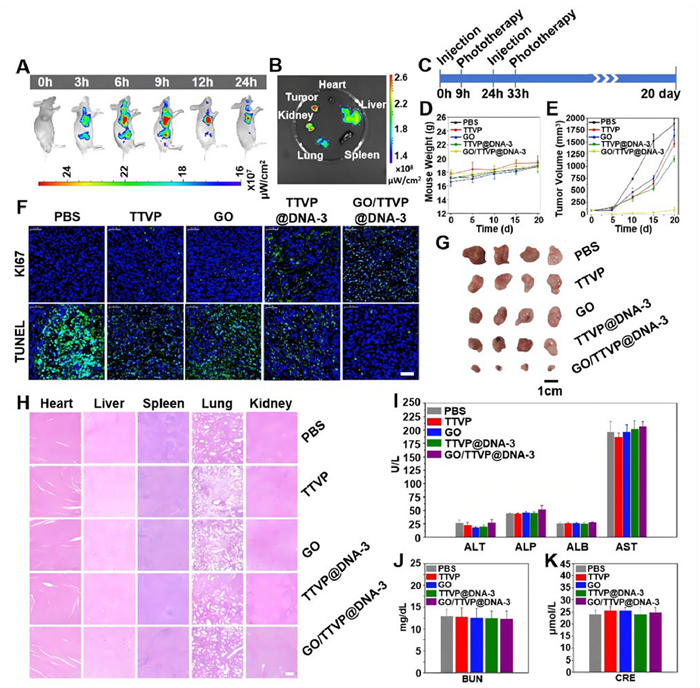
Considering the importance of therapeutic safety on nano-carriers, the systemic cytotoxicity of both control groups and test group was analyzed. The body weights of drug-treated mice in Fig. 2D indicated that there was no significant weight change, thus the therapeutic agent safety of both control groups and test group was excellent. Additionally, histological and hematological analyses have been studied, reflecting the conditions of liver damage, kidney damage and blood disease. The major organs hematoxylin and eosin staining (H&E) images (Fig. 2H) looked similar on both control groups and test group, as well as the blood biochemistry indexes (Figs. 2I–K). It verified that GO/TTVP@DNA-3 had great biocompatibility, along with high-targeted imaging effect and enhanced PDT effect for in vivo applications. To further analyze the long-term biotoxicity of GO/TTVP@DNA-3, the organ accumulation effect and immune response were measured. Considering the immune deficiency of BALB/c mice, the non-immunodeficient BALB mice were included in the long-term biotoxicity experiments. As shown in Fig. S12 (Supporting information), after intravenous injection of GO/TTVP@DNA-3, the organ coefficient presented few change during 14 days (Fig. S12C). Only liver and kidney tissues contained drugs on day 1, which presented strong fluorescence (Figs. S12A and B). The accurate TTVP concentration in main organ tissues was also analyzed through the absorbance spectra (Fig. S12D). Compared to kidney, liver tissues contained more drugs (liver/kidney drug accumulation rate of BALB mice: 2.54; liver/kidney drug accumulation rate of BALB/c mice: 4.47) on day 1, and these accumulated drugs were totally metabolized on day 7. The immune response of BALB/c mice presented few change during 14 days due to the immune deficiency (Fig. S12E). For BALB mice, IL-12p70 level had an obvious decline on day 1, indicating that the Th1 immune response was suppressed. Meanwhile, the increasing IL-6 level revealed that the inflammatory response was activated. However, these cytokines level returned to normal on day 7, indicating that GO/TTVP@DNA-3 had few long-term biotoxicity.
In summary, we developed a GO-based aptamer-guided DNA tetrahedron carrier as a high-targeted photosensitizer delivery system for in vivo liver tumor diagnosis and therapy. Benefiting from the intercalation between TTVP and DNA-3, the PDT effect of TTVP was largely improved in TTVP@DNA-3. And the target identification ability of TTVP@DNA-3 was also elevated by its attachment on GO surface via hydrogen bonds and π-stacking interactions. Therefore, this system has high detection specificity to target tumor cells, as well as enhanced PDT treatment for in vivo antitumor, revealing that GO/TTVP@DNA-3 is a promising agent for cancer theranostics with good biocompatibility. This study provides a fresh pathway for in vivo high-targeted and enhanced PDT treatment based on DNA nano-carriers.
Ke Ma: Writing – original draft, Conceptualization. Yuanwei Wang: Data curation. Guihong Lu: Formal analysis. Miaomiao Kang: Formal analysis. Zhijun Zhang: Formal analysis. Ziwei Ma: Data curation. Dong Wang: Writing – review & editing. Ben Zhong Tang: Writing – review & editing. Hui Tan: Writing – review & editing, Project administration, Funding acquisition.
The authors declare that they have no known competing financial interests or personal relationships that could have appeared to influence the work reported in this paper.
This work was financially supported by Shenzhen Science and Technology Program (No. JCYJ20220818102804009), and Basic and Applied Basic Research Foundation of Guangdong Province (Nos. 2024A1515010775, 2023A1515220031).
Supplementary material associated with this article can be found, in the online version, at doi:
C. Battistella, Y.F. Liang, N.C. Gianneschi, Adv. Mater. 33 (2021) 2007504. doi: 10.1002/adma.202007504
M. Vazquez-Gonzalez, I. Willner, ACS Appl. Mater. Inter. 13 (2021) 9520–9541. doi: 10.1021/acsami.0c17121
H. He, L. Du, H. Xue, et al., Acta Biomater. 149 (2022) 297–306. doi: 10.1016/j.actbio.2022.07.003
Z. Li, J. Huang, T. Du, et al., Chin. Chem. Lett. 33 (2022) 2496–2500. doi: 10.1016/j.cclet.2021.11.078
J. Xie, Y. Lu, B. Yu, J. Wu, et al., Chin. Chem. Lett. 31 (2020) 1173–1177. doi: 10.1016/j.cclet.2019.10.030
L. Zhang, L. Lei, Z. Zhao, et al., Chin. Chem. Lett. 36 (2025) 110316. doi: 10.1016/j.cclet.2024.110316
L.P. Zhao, R.R. Zheng, H.Q. Chen, et al., Nano Lett. 20 (2020) 2062–2071. doi: 10.1021/acs.nanolett.0c00047
X. Zhou, R.J. Kong, F. Deng, et al., Chem. Eng. J. 453 (2023) 139887. doi: 10.1016/j.cej.2022.139887
L. Rao, L.L. Bu, L. Ma, et al., Angew. Chem. Int. Ed. 57 (2018) 986–991. doi: 10.1002/anie.201709457
Y. Xu, X. Da, L. Wang, et al., Chin. Chem. Lett. 36 (2025) 110168. doi: 10.1016/j.cclet.2024.110168
Z. Li, J. Song, X. Gao, et al., Chin. Chem. Lett. 36 (2025) 110073. doi: 10.1016/j.cclet.2024.110073
R. Baskaran, J. Lee, S.G. Yang, Biomater. Res. 22 (2018) 25. doi: 10.1186/s40824-018-0140-z
D. Hinger, F. Navarro, A. Kach, et al., J. Nanobiotechnol. 14 (2016) 68. doi: 10.1186/s12951-016-0221-x
G. Xu, C.W. Li, C. Chi, et al., Nat. Commun. 13 (2022) 3064. doi: 10.1038/s41467-022-30721-w
M. Chudy, K. Tokarska, E. Jastrzqbska, et al., Biosens. Bioelectron. 101 (2018) 37–51. doi: 10.1016/j.bios.2017.10.013
J. Sun, X.W. He, Aggregate 3 (2022) e282. doi: 10.1002/agt2.282
Y. Qu, W.J. Jin, Y.C. Wan, et al., Chin. Chem. Lett. 35 (2024) 108493. doi: 10.1016/j.cclet.2023.108493
J.Q. Feng, X. Tian, R.G. Cao, et al., Chin. Chem. Lett. 35 (2024) 109657. doi: 10.1016/j.cclet.2024.109657
T.R. Tian, T. Zhang, S.R. Shi, et al., Nat. Protoc. 18 (2023) 1028–1055. doi: 10.1038/s41596-022-00791-7
Q.P. Long, X.C. Tian, H.C. Wang, et al., Nanotechnol. Rev. 12 (2023) 20220553. doi: 10.1515/ntrev-2022-0553
T.T. Wu, Y. Fu, S. Guo, et al., Aggregate 5 (2024) e402. doi: 10.1002/agt2.402
R. Schlapak, J. Danzberger, D. Armitage, et al., Small 8 (2012) 89–97. doi: 10.1002/smll.201101576
H.S. Gong, Q. Dai, P. Peng, ACS Appl. Mater. Inter. 14 (2022) 43026–43034. doi: 10.1021/acsami.2c13735
A. Kumar, A. Ahmad, M.M. Ansari, et al., Semin. Cancer Biol. 86 (2022) 54–68. doi: 10.1016/j.semcancer.2022.09.003
F. Lapenta, J. Aupic, Z. Strmsek, et al., Chem. Soc. Rev. 47 (2018) 3530–3542. doi: 10.1039/c7cs00822h
N.D. Chen, S.Y. Qin, X.H. Yang, et al., ACS Appl. Mater. Inter. 8 (2016) 26552–26558. doi: 10.1021/acsami.6b08695
G.M. Han, B. Liu, D.M. Kong, et al., Mater. Chem. Front. 7 (2023) 6345–6365. doi: 10.1039/d3qm00395g
K.R. Kim, D. Bang, D.R. Ahn, et al., Biomater. Sci. 4 (2016) 605–609. doi: 10.1039/C5BM00467E
L.X. Meng, W.J. Ma, M. Zhang, et al., Appl. Mater. Today 23 (2021) 101010. doi: 10.1016/j.apmt.2021.101010
P. Zhang, A. Fischer, Y. Ouyang, et al., Chem. Sci. 12 (2021) 14473–14483. doi: 10.1039/d1sc04229g
Y.Y. Guo, Q.S. Zhang, Q.W. Zhu, et al., Sci. Adv. 8 (2022) eabn2941. doi: 10.1126/sciadv.abn2941
W. Zhu, K. Ma, Z.C. Yan, et al., Mater. Chem. Front. 5 (2021) 5410–5417. doi: 10.1039/d1qm00420d
K. Ma, W. Xie, W. Liu, et al., Adv. Funct. Mater. 31 (2021) 2102645. doi: 10.1002/adfm.202102645
N. Chen, X. Yang, Q. Wang, et al., Chem. Commun. 52 (2016) 6789–6792. doi: 10.1039/C6CC02374F
D. Wang, H.F. Su, R.T.K. Kwok, et al., Chem. Sci. 9 (2018) 3685–3693. doi: 10.1039/c7sc04963c

Scheme 1 Illustration of the GO-based aptamer-guided DNA tetrahedron carrier as a high-targeted photosensitizer delivery system for liver tumor cells (7721 cells) with enhanced PDT.

Figure 1 Confocal images of (A) LO2 cells, (B) HepG2 cells and (C) 7721 cells after stained with Hoechst 33342 (10 µg/mL) and GO/TTVP@DNA-3, respectively. Hoechst 33342 stain time: 20 min. GO/TTVP@DNA-3: 5 µmol/L TTVP, 100 nmol/L DNA-3, 10 µg/mL GO. Stain time: 15–120 min. Channel 1: Excitation: 405 nm, Hoechst 33342 emission (blue): 410–509 nm; Channel 2: Excitation: 488 nm, TTVP (red): 610–754 nm. Relative mean fluorescence intensity of TTVP for LO2, HepG2 and 7721 cells after stained with (D) TTVP@DNA-3 or (E) GO/TTVP@DNA-3 for different stain time (15, 30, 60, 120 min). Data are presented as mean ± standard deviation (SD) (n = 3). (F) Confocal images of 7721 cells after stained with Hoechst 33342 (10 µg/mL), GO/TTVP@DNA-3 and DCFH-DA (10 µmol/L), respectively, under different irradiation time (0, 5, 10 min). Hoechst 33342 stain time: 20 min. GO/TTVP@DNA-3: 5 µmol/L TTVP, 100 nmol/L DNA-3, 10 µg/mL GO, 60 min stain time. DCFH-DA stain time: 30 min. Channel 1: Excitation: 405 nm, Hoechst 33342 emission (blue): 410–509 nm. Channel 2: Excitation: 488 nm, TTVP (red): 610–754 nm. Channel 3: Excitation: 488 nm, DCFH-DA (green): 510–550 nm. White light: 50 mW/cm2. Scale bar: 20 µm.

Figure 2 (A) In vivo imaging of mice after the injection with GO/TTVP@DNA-3 for 0–24 h. GO/TTVP@DNA-3: 50 µL, 250 µmol/L TTVP, 5 µmol/L DNA-3, 500 µg/mL GO. (B) Organ tissues images after the injection with GO/TTVP@DNA-3 for 24 h. (C) Schematic diagram of treatment process. (D) Mouse weigh and (E) tumor volune changes of mice after the treatment by control groups and test groups for 20 days. PBS group: 50 µL. TTVP group: 50 µL, 5 µmol/L. GO group: 50 µL, 10 µg/mL. TTVP@DNA-3 group: 50 µL, 5 µmol/L TTVP, 100 nmol/L DNA-3. GO/TTVP@DNA-3: 50 µL, 5 µmol/L TTVP, 100 nmol/L DNA-3, 10 µg/mL GO. (F) TUNEL and KI67 staining assays of tumor tissues after the treatment by control groups and test groups. Scale bar: 50 µm. (G) The tumor images of mice after the 20-day treatment by control groups and test groups. Scale bar: 1 cm. (H) H&E-stained slice images of major organs after different drug-treatment for 20 days. Scale bar: 200 µm. Drug volume: 50 µL. TTVP: 5 µmol/L. DNA-3: 100 nmol/L. GO: 10 µg/mL. Blood biochemistry indexes including hepatic function markers (I) and renal function markers (J, K) of mice on day 20 after drug-treatment. ALT: alanine aminotransferase. ALP: alkaline phosphatase. ALB: albumin. AST: aspartate aminotransferase. BUN: blood urea nitrogen. CRE: creatinine. Data are presented as mean ± SD (n = 3).

 扫一扫看文章


扫一扫关注我们
 DownLoad:
 下载:
下载:
 下载:
下载: