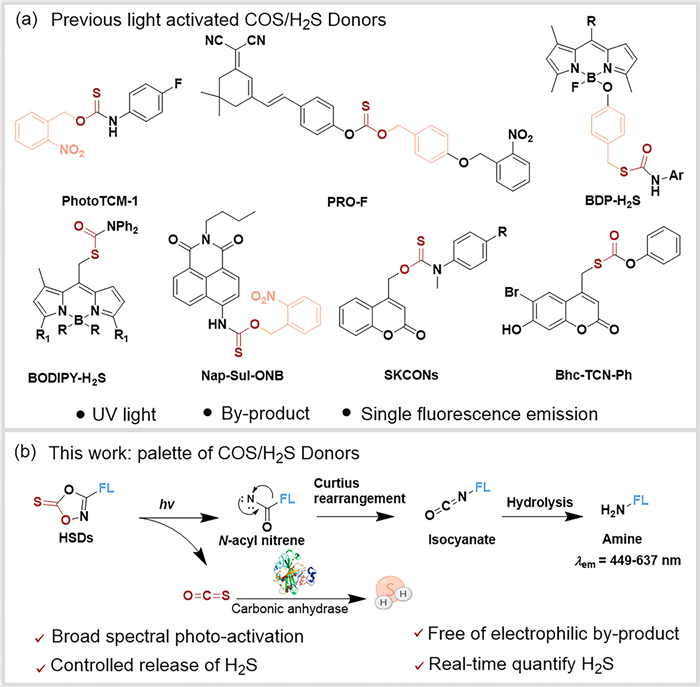
Scheme 1.
(a) Representative examples of existing photoactive H2S donors. (b) Mechanism for the activation of COS/H2S and fluorophore from donors HSD1-HSD3.

Photoactivatable hydrogen sulfide donors for visualizing H2S controlled release in accelerated chronic wound healing
Jia Lin , Le Ding , Yingting Wu , Haoyang Li , Yi Wu , Chen Li , Quangang Zhu , Zhongjian Chen , Xiaoyan Cui , Ting Wang


Hydrogen sulfide (H2S), one of the most essential gasotransmitters [1], is primarily generated by the metabolic pathways-regulated enzymatic processes [2]. Endogenous H2S participates in important activities and plays an important role in many physiological regulatory systems [3], such as resisting inflammation [4], reducing oxidative stress [5], increasing cell proliferation [6], and promoting angiogenesis [7]. Particularly in the skin, programmed H2S generation have been implicated in the pathogenesis of several skin diseases [2], including diabetic wound healing [7–10], psoriasis [11], and melanoma [12]. In diabetic wound, the healing process is significantly impaired, leading to substantial side-effects in patients [13,14]. The impaired wound healing in diabetes is related to sustained inflammation, excessive oxidative stress, and impaired angiogenesis due to chronic hyperglycemia [3,15–17]. Thus, antioxidants, reactive nitrogen species (RNS) scavengers, and their promoters are promising in improving diabetic wound healing. As an efficient scavenger for reactive oxygen species (ROS) and RNS in biological systems, H2S has great potential in improve diabetic wound healing [18]. Beyond that, H2S can significantly inhibit tumor necrosis factor-α (TNF-α)-induced up-regulation of inducible nitric oxide synthase (iNOS), interleukin-6 (IL-6), and IL-8 in a dose dependent manner, via suppression of p38 mitogen-activated protein kinase (p38 MAPK), extracellular signal-regulated kinase (ERK), and nuclear factor kappa-B (NF-κB) pathways [2,19,20]. Moreover, NETosis, induced by diabetes and impairs wound healing, can be inhibited by H2S [21,22], meanwhile, H2S synthase expression and H2S content are significantly reduced in diabetic wounds [23]. Thus, H2S is an ideal therapeutic agent for diabetic wounds with the combined effects of anti-inflammatory and pro-healing. However, the biological effects of H2S follow a dose-dependent pattern: low concentrations have cytoprotective effects, and high concentrations are cytotoxic [24]. Thus, precisely controlled release and accurately monitor of H2S is vital in promoting the related therapeutic efficacy.
H2S donors offer an effective way to deliver prolonged H2S with desired therapeutic concentration [25]. Controlled releasing strategies for H2S are generally based on polymers, hydrogels, nanoparticles and organic H2S donors [26–34]. Organic H2S donors that can trigger the release of H2S by desire have attracted growing interest, owing to their feasibly tuned structures and robust biocompatibility. Carbonyl sulfide (COS), which can be efficiently hydrolyzed to H2S by carbonic anhydrase (CA), has been widely used as an H2S donor [35]. Recently, a series of COS-based H2S donors that can be triggered by biothiols [36–40], enzymes [41,42], ROS [43–45], pH [34], and light [46–50] have been developed for controlled release of H2S. Among them, photo-triggered donors have distinct advantages for robust spatiotemporal resolution, on-demand therapeutic modulation, non-invasive operation, programmability, etc․ [48]. However, the photo-triggers are usually UV-sensitive, including o-nitrobenzyl (ONB) [46], ketoprofanate [51], or xanthone [52]. Moreover, many triggers may produce by-products after photolysis, such as nitrosobenzaldehyde, the by-product of ONB (Scheme 1), limiting their application in vivo [53,54]. Furthermore, some photo-activated H2S donors typically undergo a 1,6-elimination, leading to the production of 1,4-quinone methide, a highly toxic pro-oxidant that may negate the antioxidative effects of H2S [25]. Therefore, novel photo-triggered H2S donors with precise spatiotemporal photo-sensitivity and robust efficiency are essential in the controlled releasing of H2S for therapeutic interventions of many related diseases.
For active species like H2S donors, monitoring the release of H2S in vivo by non-destructive methods are crucial in their dose-sensitive therapeutical process. Fluorescence imaging is one of the most feasible approaches for tracking biomolecules in vivo. However, tracking H2S by fluorescence always requires reactive fluorescent probes that consumes H2S [55]. Moreover, the potential interference from other reactive sulfur species may lead to the depletion of these fluorescent probes [48]. Thus, H2S donors that can simultaneously release H2S and a fluorescent marker in a quantitative manner offer an efficient photo-triggered release of H2S with accurate indicator for reaction progress in the complex biological environments [25,55].
Herein, we proposed a novel strategy for visible light-triggered releasing of H2S based on 1,4,2-dioxazole-5-thione donors, a group of novel donors, to simultaneously release COS and bright fluorescence quantitatively. In the designed strategy, 1,4,2-dioxazole-5-thione undergoes photo-induced decomposition for COS (Scheme 1), leading to highly reactive N-acyl nitrene intermediates via the elimination of COS, followed by N-acyl nitrene rearranges to isocyanates [56–58]. Readily hydrolysis of isocyanate to amine triggered the release of fluorescence from the attached fluorescent scaffolds [59,60]. A series of photo-triggered H2S donors, HSDs (HSD1, HSD2, and HSD3), were designed by connecting 1,4,2-dioxazole-5-thione and fluorophores with tuned spectra (Fig. 1). The electron-withdrawing group, 1,4,2-dioxazole-5-thione, acts as both the sulfur source and the fluorescence caging group, locking the fluorescence. Through density functional theory (DFT) calculations, it is possible that the HSD1 molecule may cause fluorescence quenching through the photo-induced electron transfer (PET) effect (Fig. S18 in Supporting information). Upon photo-irradiation, the H2S donor undergoes an efficient cleavage to COS and amine without by-products, accompanied by strong turn-on fluorescence, ensuring precise monitoring of the concentration of H2S in real time. The probes exhibited efficient H2S delivery and ROS scavenging in vitro and in vivo. Furthermore, the promoted wound healing by HSD3 has been validated in diabetic wound, demonstrating the great potential of photo-controlled release with precise tracking in therapeutic application. Overall, our H2S donors HSDs possess the remarkable advantages of visible-light activation, no electrophilic by-products, and real-time visualization of H2S release.
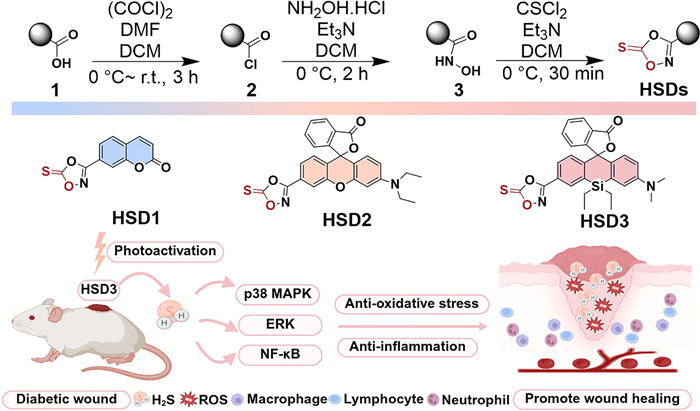
To confirm the photo-activities of 1,4,2-dioxazole-5-thione as COS/H2S donors, we prepared HSD1, HSD2, and HSD3 by treating the corresponding N-hydroxybenzamide with thiophosgene (Fig. 1). Carboxylic acid derivatives were prepared following the reported procedures in literature [61]. Briefly, carboxylic acid derivatives (1) undergo acylation reactions with oxalyl chloride to the crude acyl chloride (2). Further, the acyl chloride was added to a solution of triethylamine and hydroxylamine hydrochloride in dichloromethane to N-hydroxybenzamide (3). Finally, the COS/H2S donor was obtained by introducing thiophosgene and triethylamine to the reaction mixture. The H2S donors with coumarin (HSD1), rhodamine (HSD2), and Si-substituted rhodamine (HSD3) as fluorophores are synthesized by this method (~5% yield). The structures of intermediates and final products were confirmed by 1H nuclear magnetic resonance spectroscopy (NMR), 13C NMR, and high-resolution mass spectrometry (HR-MS) analysis (Supporting information).
Photolysis of the probes was evaluated in phosphate buffer (PBS, 20 µmol/L, pH 7.4). Exposure of HSD3 to 365 nm light emitting diode (LED) leading to gradual decreases of absorption with λabs = 300 nm and reciprocal increase at λabs = 615 nm (Fig. 2a). The absorption at 615 nm increased linearly with the irradiation duration in the first 240 s, followed with a gradually level off, likely due to consumption of HSD3. The corresponding fluorescence (λem = 637 nm) significantly increased ~58 times in 360 s (Fig. 2b), and the kinetics for absorption and emission are similar (insets in Figs. 2a and b). The absorption/emission spectra resembled that of rhodamine derivative, which was confirmed to be Si-rhodamine by high performance liquid chromatography (HPLC) and HR-MS (Figs. 2d and h). Photo-irradiation triggers the conversion of HSD3 (HPLC retention time, TR = 24 min) to Si-rhodamine (TR = 14.5 min, Fig. 2d). When solution of HSD1 was exposed to 365 nm irradiation, the maximum of the absorption spectra (λabs) bathochromically shifted from 290 nm to 341 nm (Fig. S1 in Supporting information). Meanwhile, the fluorescence spectra with a maximum (λem) at 449 nm has strikingly increased to about 75 folds (Fig. S1). HPLC analysis confirmed that 365 nm-light triggers the conversion of HSD1 (TR = 19.0 min) to coumarin (TR = 10.4 min, Fig. S4 in Supporting information). Upon 365 nm-irradiation of HSD2 solution, sharp absorption and fluorescence appeared (λabs = 529 nm; λem = 555 nm), with approximate 73-fold enhancement in fluorescence within 360 s (Fig. S2 in Supporting information). HPLC analysis proves the photo-triggered conversion of HSD2 (TR = 26.0 min) to N, N-diethylrhodamine (TR = 11.8 min, Fig. S5 in Supporting information), as confirmed by HR-MS (Supporting information).

Specially, HSD2 can be photolysis by irradiation of broad spectra range. LED of different wavelengths, including 405, 500, and 600 nm, can efficiently trigger the conversion of HSD2 (Fig. S2). The 405 nm LED was particularly efficient with a photolysis quantum yield of 9.57% (Table S1 in Supporting information). HSD2 with fast photolysis that can be triggered by 500 nm (t1/2 = 240 s, Fig. S2) was used in the analysis in vitro. Photolysis of HSD1 can also be mediated by LED of 405 nm (Fig. S1), and the quantum yield of photolysis is 1.80% (Table S1). Photolysis of HSD3 can be facilely mediated by irradiation of a broad range, e.g., 405, 500, 600, and 650 nm (Fig. 2c and Fig. S3 in Supporting information). Although the absorption of HSD3 is low in the visible range (ɛ: ~2275 L mol−1 cm−1 at 600 nm), its photolysis is fast (t1/2 = 270 s, Fig. 2c), and the quantum yield of photolysis is 6.37% in 405 nm (Table S1). It is noteworthy that the low-molar absorptivity does not necessarily preclude photochemical activity of HSD3 [62]. The potential interference in the photo-triggered releasing of fluorescence in HSDs were extensively analyzed. Different bioactive species, including metal ions, endogenous amino acids, ROS, etc. have demonstrated unnoticeable interference to the designed HSDs, in comparison with photo-triggered robust fluorescence (Fig. 2g and Figs. S15–S17 in Supporting information). Moreover, the photolysis of HSDs is adaptative to broad ranges of pH within 5.0–10.0, demonstrating robust stability and suitability for bioimaging in vivo (Fig. 2e and Figs. S12–S14 in Supporting information).
To evaluate the photo-activated H2S delivery from the donors, colorimetric methylene blue (MB) assay was employed to monitor the H2S production of HSDs (20 µmol/L) under 365 nm-photo-irradiation in PBS containing CA (25 µg/mL). Two obvious absorption bands at 670 and 745 nm indicate the H2S-triggered formation of MB (Fig. S7 in Supporting information). The absorption at 670 nm was used to quantify H2S by calibration curve. For HSDs, 7.43 µmol/L (37.1% release efficiency, HSD1), 8.38 µmol/L (41.9%, HSD2), 7.96 µmol/L (39.8%, HSD3) H2S were released, respectively (Figs. S8–S10 in Supporting information). Compared with existing H2S donors, HSDs achieve a higher H2S release efficiency (39.8%) than most photo-triggered donors, whose efficiencies typically range from 10% to 30% [46,47,49–51,54]. The HSD3 reached maximum H2S releasing in 330 s-irradiation before decreasing with extended irradiation, likely due to the volatilization and oxidation of H2S (Fig. 2f) [50]. Thus, we have confirmed that 1,4,2-dioxazole-5-thione can be an effective photocage group for photo-triggered releasing of H2S donor and fluorescence in sensitively and quantitatively tracking the photo-triggered releasing of H2S.
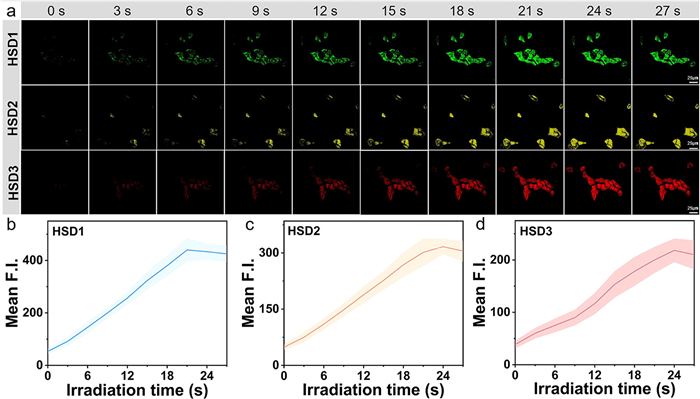
HSDs have demonstrated great advantage for application in vivo with clean and efficient photolysis. The photoactivable releasing and real-time visualization of H2S were evaluated in immortalized human keratinocytes cell line, HaCaT Upon photo-irradiation at 405 nm, strong fluorescence was released in HSD1. Similarly, photo-irradiation at 500 and 600 nm triggered strong fluorescence in HSD2 and HSD3, respectively (Fig. 3a). The averaged cellular fluorescence intensities from cells stained by probes were proportional to the duration of photo-exposure until the consumption of probes (Figs. 3b–d).
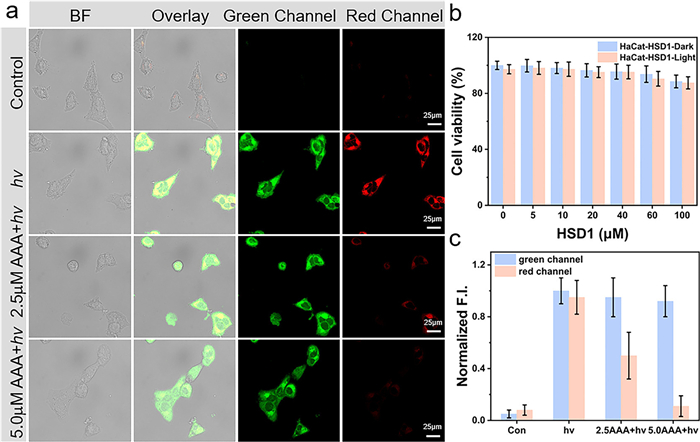
H2S delivery was subsequently explored in vivo. We firstly investigated the H2S delivery of HSD1 in PBS, and observed significantly enhanced fluorescence after coincubation with 3′–methoxy–3-oxo-3H-spiro[isobenzofuran-1,9′-xanthen]−6′-yl 2-(pyridin-2-yldisulfanyl) benzoate (WSP-1), a commercial probe for H2S (Fig. S11 in Supporting information). Next, the ability of HSD1 to deliver H2S in HaCaT cells and Human nasal epithelial cells (HNEpCs) were evaluated. Both types of cells were incubated with HSD1 and WSP-1 without photo-activation, negligible fluorescence was detected in the red or green channels (Fig. 4a, top panel and Fig. S25 in Supporting information). Strong fluorescence was observed in both channels after photo-activation, validating the H2S delivery by HSD1 in live cells (Fig. 4a, second panel and Fig. S25). After pre-incubation with acetazolamid (AAA, 2.5 µmol/L), an indiscriminate CA inhibitor [63], green fluorescence remained unchanged, while the red channel was significantly reduced (Fig. 4a, third panel, Fig. 4c and Fig. S25), increased the concentration of inhibitor to 5.0 µmol/L, and the fluorescence of red channel was nearly fully quenched compared to hv group (Fig. 4a, lower panel and Fig. 4c), indicating the H2S production through the hydrolysis of COS by CA.
H2S can attenuate cellular oxidative stress by scavenging ROS. Based on the capability of H2S-delivery and admirable results of cytotoxicity and stability of HSDs (Fig. 4b and Figs. S22–S24 in Supporting information), the ROS scavenging was further evaluated. Phorbol 12-myristate 13-acetate (PMA) is widely used to stimulate endogenous ROS [44]. Intracellular ROS levels were evaluated by a commercial ROS probe, 2′,7′-dichlorodihydrofluorescein diacetate (DCFH-DA) [64]. The ability of HSD1 to scavenge ROS in HaCaT and HNEpC cells were evaluated. Both types of cells pre-incubated with PMA yielded strong green fluorescence compared to the control group, demonstrating that PMA significantly increased ROS levels. However, for cells pre-incubated with PMA, incubation with photoactivated HSD1 (20 µmol/L, 30 min) led to profoundly reduced green fluorescence (Fig. 5a and Fig. S26 in Supporting information), confirming the ROS scavenging of HSD1. HSD1 without photoactivation had unnoticeable effect on the resulted ROS levels. To assess whether light exposure itself affects ROS levels, we irradiated cells after a 30 min PMA incubation. The resulting green fluorescence intensity showed minimal change, indicating that ROS generation is independent of light exposure (Figs. 5a and b). To further confirm that the antioxidant effect of HSD1 is mediated by H2S release, we treated cells with CA inhibitor, PMA and HSD1, followed by light irradiation. This group exhibited significantly stronger green fluorescence than the "HSD1 + hv" group, indicating the antioxidant effect of HSD1 is indeed mediated by the release of H2S. These results revealed that photoactivated HSD1 can attenuate cellular oxidative stress, likely by scavenging ROS.
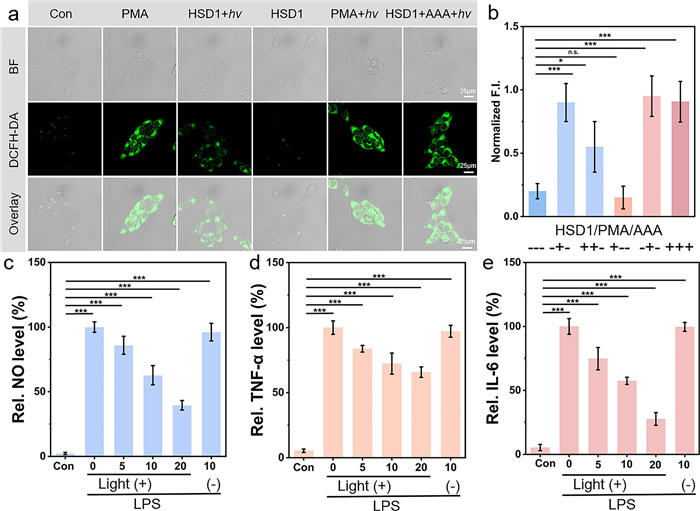
We also investigated the anti-inflammation of HSDs. Macrophage RAW 264.7 cells were incubation with lipopolysaccharide (LPS, 1.0 µg/mL) to trigger the inflammation. The inflammatory process activates the NF-κB pathway, resulting in the increased production of nitrite (NO), TNF-α, and IL-6 [32,48]. Given that the red emission of HSD3, featuring enhanced tissue penetration capability and lower biological background interference, it was chosen as the model donor for anti-inflammatory assays. Then, different concentration of HSD3 (0, 5, 10, 20 µmol/L) were added before photo-activation. Ultra-high concentrations of HSD3 over 20 µmol/L was not employed due to the potential of cytotoxicity. The HSD3 treated groups showed a dose-dependent inhibition of NO, TNF-α, and IL-6 (Figs. 5c–e and Figs. S27–S29 in Supporting information). Overall, we confirmed that HSD3 releases COS/H2S in complex cellular environment and exhibits promising anti-inflammatory effect.
We further investigated the anti-inflammatory and antioxidant effects of HSDs in the wound healing process in vivo (Fig. 6). C57BL/6J mice were administered streptozotocin (STZ) by intraperitoneal injection to selectively damage the pancreatic β cells irreversibly. All animal experiments were approved by the Animal Ethics Committee of East China Normal University. After continuous injection of STZ for 3 days, the blood glucose elevation in the treated mice were ≥16.7 mmol/L [65], and the diabetic model was successfully constructed (Fig. 6d). Then, a 5 mm diametral full-thickness wound was created on the back of diabetic mice (Fig. 6a), following the previously described method [48]. HSD3 with robust NIR fluorescent response was selected for analysis in vivo. Since HSD3 can be efficiently activated by light of 365 and 600 nm, we selected 365 and 600 nm LEDs to activate HSD3 and evaluate the wound healing process. An aqueous solution of sodium alginate (SA) gel containing HSD3 (100 µmol/L) was applied to the wound in the working group. Simvastatin was used as the positive control for improving angiogenesis in wound healing [66]. The wound healing progress was analyzed during the 9-day treatment.
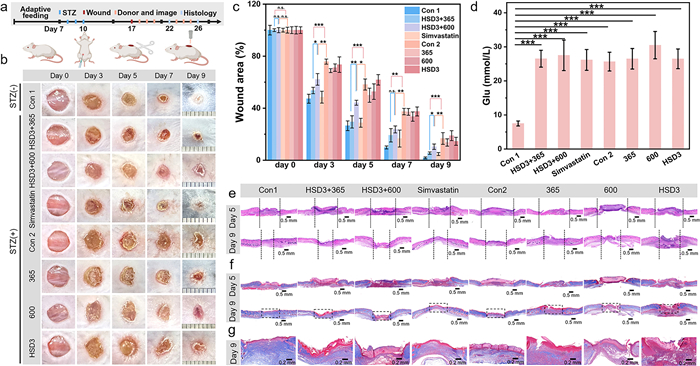
We monitored the wound-healing processes in non-diabetic mice (Con 1), diabetic mice with wound treated with SA gel (Con 2), HSD3@SA gel with 365 or 600 nm photo-irradiation (HSD3+365, HSD3+600), simvastatin, photo-irradiation only (365 or 600 nm LED, 365, 600), and HSD3@SA gel without photo-irradiation (HSD3), respectively. Compared to mice in control group (Con 1), diabetic mice (Con 2) showed a delayed wound healing process with the SA gel treatment, also confirmed the success establishment of diabetic chronic wound model. Compared with diabetic mice (Con 2), the working group (HSD3+365, HSD3+600) of HSD3@SA gel with 365 or 600 nm LED irradiation showed accelerated wound healing, and the promoted healing was comparable to the simvastatin group (Figs. 6b and c, Figs. S34 and S35 in Supporting information). The LED-treated group (365, 600) or HSD3@SA gel without photo-irradiation (HSD3) has no obviously promoting effect, proving that the promoted wound healing is the result of photo-triggered reaction rather than the photo itself. These phenomena confirmed the efficient wound healing by a broad range of light-activated HSD3 in live animals.
On the 5th and 9th days, wound tissues were harvested from each group before histological analysis by hematoxylin-eosin (H&E) and Masson staining for the illustration of epidermal wound margins. Re-epithelialization and granulation tissue formation are the most important indicators of wound healing [67]. On the 5th day, H&E staining of the tissue showed that the fibroblast proliferation, granulation tissue formation, and keratinocytes migrate from the shoulder of the wound into the wound bed to promote the re-epithelialization. The wound areas of both the photoactivated HSD3 and the simvastatin groups were smaller than that of the control group, but larger than that of the normal mice, consistent with the pictures of wound in Fig. 6b and Fig. S34 (Supporting information). On the 9th day, photoactivated HSD3 and simvastatin treatment exhibited a rather continuous and thick epithelial layer, but incomplete and thin epithelial layer was found in other diabetic wounds (Fig. 6e and Fig. S36 in Supporting information). During the wound healing process, a large amount of collagen is produced and deposited in granulation tissue, providing a good indicator for wound healing [68]. The collagen deposition was evaluated by Masson staining (Fig. 6f). The detailed enlarged picture showed that massive collagen deposition in the photoactivated HSD3 and the simvastatin treated wounds, indicating recovery and maturation from damaged tissues (Fig. 6g). In general, both visual observation and histological examination confirmed that photo-activated HSD3 expedited the healing of infected diabetic wounds by enhancing granulation tissue formation, facilitating the formation of epidermis, and increasing collagen deposition. Further, the in vivo fluorescence imaging of wounds with photo-triggered fluorescence have confirmed the capability of monitoring H2S in live animals by the developed HSDs. The quantitative results of fluorescence intensity over time showed the fluorescence basically reaching a plateau within 10 min, indicating the H2S released completely (Figs. S30-S33 in Supporting information). These results suggest that HSDs have great potential therapeutic application prospects in accelerating the healing of chronic wounds in the future.
We proposed a robust strategy for designing HSDs, turn-on COS/H2S donors, with efficient photo-triggered release of H2S while quantitatively monitoring the amount of H2S by fluorescence across a broad palette of spectra in vivo. The photo-triggered release of H2S is fast and electrophilic by-product free, and can be accurately detected and visualized in vitro and in vivo. Furthermore, the anti-inflammatory and antioxidant effects of controlled release of H2S can be applied in different therapeutic processes. We have confirmed that HSDs can efficiently promote wound healing by controlled release of H2S in diabetic wounds. Our design strategy has provided novel insights into precisely controlling and monitoring the release of reactive species, while leveraging the advantage of photo-triggered release, holding promising potential for advanced treatments in many diseases.
Jia Lin: Writing – original draft, Visualization, Data curation. Le Ding: Methodology. Yingting Wu: Investigation. Haoyang Li: Methodology. Yi Wu: Methodology. Chen Li: Investigation, Funding acquisition. Quangang Zhu: Methodology, Investigation. Zhongjian Chen: Methodology, Funding acquisition. Xiaoyan Cui: Writing – review & editing, Writing – original draft, Supervision, Investigation, Funding acquisition. Ting Wang: Writing – review & editing, Writing – original draft, Investigation, Funding acquisition.
The authors declare that they have no known competing financial interests or personal relationships that could have appeared to influence the work reported in this paper.
This work was supported by the National Natural Science Foundation of China (Nos. 22178377, 22274056, 22374163) This work was also supported by the China Postdoctoral Science Foundation General Program (No. 2024M750918), Shanghai Post-doctoral Excellence Program (No. 2024165). We thank the Material Characterization Center at East China Normal University.
Supplementary material associated with this article can be found, in the online version, at doi:
B. Lv, S. Chen, C. Tang, et al., J. Adv. Res. 27 (2021) 85–97. doi: 10.1016/j.jare.2020.05.007
S.A. Coavoy-Sánchez, S.K.P. Costa, M.N. Muscará, Br. J. Pharmacol. 177 (2019) 857–865.
M. Xu, L. Zhang, S. Song, et al., J. Adv. Res. 27 (2021) 11–17. doi: 10.3390/jmmp5010011
J.L. Wallace, J.G.P. Ferraz, M.N. Muscara, Antioxid. Redox Signaling 17 (2012) 58–67. doi: 10.1089/ars.2011.4351
J.J. Scammahorn, I.T.N. Nguyen, E.M. Bos, H. Van Goor, J.A. Joles, Antioxidants 10 (2021) 373. doi: 10.3390/antiox10030373
C. Szabo, C. Coletta, C. Chao, K. Módis, B. Szczesny, Proc. Natl. Acad. Sci. U. S. A. 110 (2013) 12474–12479. doi: 10.1073/pnas.1306241110
W.J. Cai, M.J. Wang, P.K. Moore, et al., Cardiovasc. Res. 76 (2007) 29–40. doi: 10.1016/j.cardiores.2007.05.026
A. Papapetropoulos, A. Pyriochou, Z. Altaany, et al., Proc. Natl. Acad. Sci. U. S. A. 106 (2009) 21972–21977. doi: 10.1073/pnas.0908047106
C. Coletta, A. Papapetropoulos, K. Erdelyi, et al., Proc. Natl. Acad. Sci. U. S. A. 109 (2012) 9161–9166. doi: 10.1073/pnas.1202916109
W.C. Lin, C.C. Huang, S.J. Lin, et al., Biomaterials 145 (2017) 1–8.
P. Mirandola, G. Gobbi, C. Micheloni, et al., Lab. Invest. 91 (2011) 1188–1194. doi: 10.1038/labinvest.2011.76
P. De Cicco, E. Panza, G. Ercolano, et al., Pharmacol. Res. 114 (2016) 67–73. doi: 10.1016/j.phrs.2016.10.019
M. Chang, T.T. Nguyen, Acc. Chem. Res. 54 (2021) 1080–1093. doi: 10.1021/acs.accounts.0c00864
Y. Sun, Y. Zhu, J. Si, et al., Chin. Chem. Lett. 36 (2025) 110012. doi: 10.1016/j.cclet.2024.110012
H. Ding, J. Yang, Y. Shuai, et al., Chin. Chem. Lett. 36 (2025) 110286. doi: 10.1016/j.cclet.2024.110286
J. Wang, X. Ge, Y. Xiang, et al., Chin. Chem. Lett. 36 (2025) 109819. doi: 10.1016/j.cclet.2024.109819
M.K. Sarangi, L.D. Patel, G. Rath, S.S. Nanda, D.K. Yi, Chin. Chem. Lett. 35 (2024) 109381. doi: 10.1016/j.cclet.2023.109381
B. Murphy, R. Bhattacharya, P. Mukherjee, FASEB J. 33 (2019) 13098–13125. doi: 10.1096/fj.201901304r
C. Yang, L. Chen, W. Chen, et al., Mol. Cell Endocrinol. 480 (2019) 74–82. doi: 10.1016/j.mce.2018.10.013
A.K.H. Alshorafa, Q. Guo, F. Zeng, et al., Tohoku J. Exp. Med. 228 (2012) 325–332. doi: 10.1620/tjem.228.325
S.L. Wong, M. Demers, K. Martinod, et al., Nat. Med. 21 (2015) 815–819. doi: 10.1038/nm.3887
G.P. Fadini, L. Menegazzo, M. Rigato, et al., Diabetes 65 (2016) 1061–1071. doi: 10.2337/db15-0863
Z. Cheng, R. Kishore, Redox. Biol. 37 (2020) 101704. doi: 10.1016/j.redox.2020.101704
W. Guo, Z. Cheng, Y. Zhu, Acta Pharmacol. Sin. 34 (2013) 1284–1291. doi: 10.1038/aps.2013.127
Q. Hu, C. Zhu, R.A. Hankins, et al., J. Am. Chem. Soc. 145 (2023) 25486–25494. doi: 10.1021/jacs.3c10446
Q. Zong, J. Li, Q. Xu, et al., Nat. Commun. 15 (2024) 7558. doi: 10.1038/s41467-024-52006-0
W. Liang, J. Chen, L. Li, et al., ACS Appl. Mater. Interfaces 11 (2019) 14619–14629. doi: 10.1021/acsami.9b01886
P. Shan, J. Liao, J. Li, et al., Chin. Chem. Lett. 35 (2024) 108545. doi: 10.1016/j.cclet.2023.108545
K. Yang, B. Yu, W. Liu, et al., Chin. Chem. Lett. 34 (2023) 107889. doi: 10.1016/j.cclet.2022.107889
X.F. Lv, X.Y. Ran, Y. Zhao, et al., Chin. Chem. Lett. 36 (2025) 110027. doi: 10.1016/j.cclet.2024.110027
Z. Li, Q. Feng, J. Shen, Chin. Chem. Lett. 35 (2024) 109602. doi: 10.1016/j.cclet.2024.109602
Y. Ge, F. Rong, Y. Lu, et al., Nano Lett. 23 (2023) 6610–6618. doi: 10.1021/acs.nanolett.3c01771
W. Zhou, D. He, N. Liu, et al., Chin. Chem. Lett. 36 (2025) 110854. doi: 10.1016/j.cclet.2025.110854
A.K. Gilbert, Y. Zhao, C.E. Otteson, M.D. Pluth, J. Org. Chem. 84 (2019) 14469–14475. doi: 10.1021/acs.joc.9b01873
M. Tanc, F. Carta, A. Scozzafava, C.T. Supuran, ACS Med. Chem. Lett. 6 (2015) 292–295. doi: 10.1021/ml500470b
C.R. Powell, J.C. Foster, B. Okyere, et al., J. Am. Chem. Soc. 138 (2016) 13477–13480. doi: 10.1021/jacs.6b07204
X. Zhao, L. Ning, X. Zhou, et al., Anal. Chem. 93 (2021) 4894–4901. doi: 10.1021/acs.analchem.0c05081
Y. Zhao, M.M. Cerda, M.D. Pluth, Chem. Sci. 10 (2019) 1873–1878. doi: 10.1039/c8sc05200j
X. Zhao, M. Ding, L. Ning, et al., Acta Mater. Med. 1 (2022) 476–485.
Y. Zhao, A.K. Steiger, M.D. Pluth, J. Am, Chem. Soc. 141 (2019) 13610–13618. doi: 10.1021/jacs.9b06319
P. Chauhan, P. Bora, G. Ravikumar, et al., Org. Lett. 19 (2016) 62–65.
C.M. Levinn, A.K. Steiger, M.D. Pluth, ACS Chem. Biol. 14 (2019) 170–175. doi: 10.1021/acschembio.8b00981
Y. Hu, X. Li, Y. Fang, et al., Chem. Sci. 10 (2019) 7690–7694. doi: 10.1039/c9sc02323b
Y. Zhao, M.D. Pluth, Angew. Chem. Int. Ed. 55 (2016) 14638–14642. doi: 10.1002/anie.201608052
H. Lu, H. Zeng, W. Wei, et al., Theranostics 14 (2024) 7589–7603. doi: 10.7150/thno.100930
Y. Zhao, S.G. Bolton, M.D. Pluth, Org. Lett. 19 (2017) 2278–2281. doi: 10.1021/acs.orglett.7b00808
A.K. Sharma, M. Nair, P. Chauhan, et al., Org. Lett. 19 (2017) 4822–4825. doi: 10.1021/acs.orglett.7b02259
F. Yuan, X. He, Y. Lu, et al., Anal. Chem. 95 (2023) 6931–6939. doi: 10.1021/acs.analchem.3c00230
F. Yuan, A. Guo, L. Wang, et al., Angew. Chem. Int. Ed. 64 (2025) e202501685. doi: 10.1002/anie.202501685
N. Wang, Y. Fang, X. Wang, et al., Chem. Commun. 59 (2023) 8949–8952. doi: 10.1039/d3cc02053c
N. Fukushima, N. Ieda, K. Sasakura, et al., Chem. Commun. 50 (2014) 587–589. doi: 10.1039/C3CC47421F
N. Fukushima, N. Ieda, M. Kawaguchi, et al., Bioorg. Med. Chem. Lett. 25 (2015) 175–178. doi: 10.1016/j.bmcl.2014.11.084
N. Fomina, C.L. McFearin, M. Sermsakdi, J.M. Morachis, Macromolecules 44 (2011) 8590–8597. doi: 10.1021/ma201850q
W. Hua, J. Zhao, S. Gou, Analyst 145 (2020) 3878. doi: 10.1039/d0an00371a
K.G. Fosnacht, J. Dorogin, P.M. Jefferis, et al., Angew. Chem. Int. Ed. 63 (2024) e202402353. doi: 10.1002/anie.202402353
J. Sauer, K.K. Mayer, Tetrahedron Lett. 9 (1968) 319–324. doi: 10.1016/S0040-4039(01)98753-2
V. Bizet, L. Buglioni, C. Bolm, Angew. Chem. Int. Ed. 53 (2014) 5639–5642. doi: 10.1002/anie.201310790
V. Bizet, C. Bolm, Eur. J. Org. Chem. 2015 (2015) 2854–2860. doi: 10.1002/ejoc.201500220
C. Bousch, B. Vreulz, K. Kansal, et al., Angew. Chem. Int. Ed. 62 (2023) e202314248. doi: 10.1002/anie.202314248
S. Han, Z. Xue, Z. Wang, T.B. Wen, Chem. Commun. 46 (2010) 8413–8415. doi: 10.1039/c0cc02881a
A. Podder, S. Koo, J. Lee, et al., Chem. Commun. 55 (2019) 537–540. doi: 10.1039/c8cc08991d
L. Yin, B. Zhao, J. Zhou, et al., Angew. Chem. Int. Ed. 63 (2024) e202402949. doi: 10.1002/anie.202402949
A.K. Steiger, S. Pardue, C.G. Kevil, M.D. Pluth, J. Am. Chem. Soc. 138 (2016) 7256–7259. doi: 10.1021/jacs.6b03780
Y. Luo, Y.X. Xu, Q.G. Bao, et al., Chin. Chem. Lett. 23 (2012) 1193–1196. doi: 10.1016/j.cclet.2012.08.002
Y. Zhang, S. Ai, Z. Yu, et al., Adv. Funct. Mater. 34 (2024) 2314607. doi: 10.1002/adfm.202314607
A.P. Veith, K. Henderson, A. Spencer, et al., Adv. Drug Deliv. Rev. 146 (2019) 97–125.
X. Zhao, L. Liu, T. An, et al., Acta Biomater. 104 (2020) 85–94. doi: 10.1016/j.actbio.2019.12.032
H.P. Ehrlich, T.K. Hunt, Adv. Wound Care 1 (2012) 3–9. doi: 10.1089/wound.2011.0311

Scheme 1 (a) Representative examples of existing photoactive H2S donors. (b) Mechanism for the activation of COS/H2S and fluorophore from donors HSD1-HSD3.

Figure 1 Synthetic strategy for HSD1, HSD2, HSD3 and the mechanism of H2S donor in accelerate wound healing.

Figure 2 (a) UV–vis absorption and (b, c) fluorescence of HSD3 (20 µmol/L, PBS, pH 7.4) upon irradiation (λLED = 365, 600 nm, LED: 30 mW/cm2). (d) HPLC of HSD3 without photo-activation (lower panel) or with photo-activation for 1, 3 and 5 min (middle three panels) and HPLC of Si-rhodamine (top panel). (e) Fluorescence response for the photolysis of HSD3 (20 µmol/L) with a 365 nm LED at various pH. (f) H2S detected by MB assay, HSD3 (20 µmol/L) was irradiation with a 365 nm LED in PBS (pH 7.4) containing CA (25 µg/mL). (g) Fluorescence of HSD3 (20 µmol/L) with potential interferences including metal ions (200 µmol/L), amino acids (200 µmol/L), ROS (100 µmol/L), H2S (100 µmol/L), hv (365 nm, 30 mW/cm2). (h) HR-MS of HSD3 in PBS after 5 min-photo-irradiation at 365 nm. Data are presented as mean ± standard deviation (SD) (n = 3).

Figure 3 (a) Confocal micrographs of HaCaT cells incubated with HSDs (20 µmol/L) for 30 min, and then continuously exposed to a laser at wavelengths of 405, 500, and 600 nm for 27 s respectively, a photo was taken every 3 s. Scale bar: 25 µm. (b–d) Fluorescence intensities for images in (a), the results are expressed as mean ± SD (n = 10).

Figure 4 (a) Confocal micrographs of H2S delivery in HaCaT cells. Cells treated with HSD1 (20 µmol/L, green channel) and WSP-1 (10 µmol/L, red channel) for 30 min (top panel) without photo-activation and (second panel) with photo-activation (365 nm, 50 mW/cm2, 5 min); third panel: cells pre-treated with AAA (2.5 µmol/L, 1 h), then with HSD1 (20 µmol/L) and WSP-1 (10 µmol/L) before photo-activation; lower panel: cells pre-treated with AAA (5.0 µmol/L, 1 h), then with HSD1 (20 µmol/L) and WSP-1 (10 µmol/L) before photo-activation. Scale bar: 25 µm. (b) Cytotoxicity of HSD1 in HaCaT cells evaluated by MTT (3-(4,5-dimethylthiazol-2-yl)-2,5-diphenyl tetrazolium bromide) assay (n = 6). (c) Extracted normalized fluorescence intensities in each group in (a) (n = 3). Results are expressed as mean ± SD.

Figure 5 The antioxidant stress and anti-inflammatory effects of HSDs. (a) DCFH-DA (10 µmol/L) staining followed different pre-treatments of HaCaT cells: control group, (first column), pre-treated with PMA (0.50 µg/mL, 30 min, second column), pre-treated with PMA (0.50 µg/mL, 30 min), then light activated HSD1 (20 µmol/L, 365 nm, 50 mW/cm2, 5 min, third column), cells were incubated with inactivated HSD1 (20 µmol/L, fourth column), pre-treated with PMA (0.50 µg/mL, 30 min), then under 365 nm LED light irradiation (50 mW/cm2, 5 min, fifth column), cells pre-treated with AAA (5.0 µmol/L, 1 h), then incubated with PMA (0.50 µg/mL, 30 min), and finally light activated HSD1 (20 µmol/L, 365 nm, 50 mW/cm2, 5 min, sixth column). λex = 488 nm, λem = 510–580 nm. Scale bar: 25 µm. (b) Normalized fluorescence intensities of DCFH-DA were determined by ImageJ (n = 3). (c–e) Impact of HSD3 (0, 5.0, 10, 20 µmol/L) on the levels of inflammatory factors in Raw264.7 cells: (c) nitrite, (d) TNF-α, and (e) IL-6 (n = 6). Results are expressed as mean ± SD. *P < 0.05, **P < 0.01, ***P < 0.001.

Figure 6 (a) Illustration for the diabetic wound model. (b) Photographs of diabetic wounds of each group on days 0, 3, 5, 7, and 9 after treatments. (c) Quantitative analysis of wound areas in non-diabetic mice treated with SA gel (Con 1, 1.0 w/v%), HSD3@SA gel with 365 nm or 600 nm photo-irradiation (HSD3+365, HSD3+600, 100 µmol/L in SA), simvastatin (50 µg in SA), diabetic mice with wound treated with SA gel (Con 2, 1.0 w/v%), 365 nm or 600 nm LED photo-irradiation only (365, 600), and HSD3@SA gel without photo-irradiation (HSD3, 100 µmol/L in SA). Photo-irradiation: 30 mW/cm2, a total of 5 min per day, once every 1 min, with an interval of 30 min (n = 6). (d) Blood glucose levels of mice (n = 6). (e) H&E staining and (f) Masson’s staining of tissue sections on 5th and 9th days. The black dashed boxes highlight wound edges. Scale bar: 0.5 mm. (g) Enlarged images on day 9 in (f) showed collagen deposition of wounds. Scale bar: 0.2 mm. Data are presented as mean ± SD. *P < 0.05, **P < 0.01, ***P < 0.001.

 扫一扫看文章


扫一扫关注我们
 DownLoad:
 下载:
下载:
 下载:
下载: