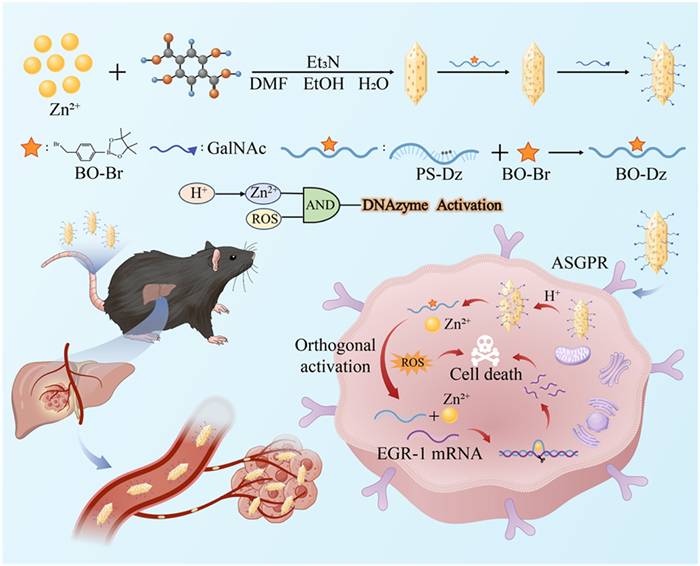
Scheme 1.
Schematic illustration of the preparation of triple-stimuli-responsive nanoplatform and the activating processes of DNAzyme for cancer therapy.

Logic-gated, triple-responsive DNAzyme nanoplatform for precise hepatocellular carcinoma treatment
Xiuyan Wan , Xincheng Qiao , Yu Zhang , Wei Pan , Na Li , Bo Tang


Hepatocellular carcinoma (HCC) is a highly lethal cancer with a 5-year survival rate of only 18% [1]. Most cases are diagnosed at intermediate or advanced stages, where curative treatments like surgery or ablation are no longer viable [2]. Current therapies, including transarterial chemoembolization, multi-kinase inhibitors, and immune checkpoint inhibitors [3], offer limited benefits due to drug resistance, tumor heterogeneity, and systemic toxicity [4]. Therefore, there is an urgent need for novel therapeutic strategies that selectively target tumor cells while minimizing off-target effects and improving treatment outcomes.
DNAzymes are single-stranded DNA molecules capable of cleaving specific RNA sequences, enabling precise gene silencing [5,6]. Due to their programmability, chemical stability, and ease of synthesis, DNAzymes have emerged as promising anticancer agents targeting oncogenic mRNAs [7,8]. Studies have shown their effectiveness in inhibiting tumor growth across various cancer models [5,9,10]. However, traditional DNAzymes are constitutively active, cleaving targets upon contact without regard for biological context [11], raising concerns about off-target effects and biosafety [12]. To improve spatiotemporal control, researchers have developed stimuli-responsive DNAzymes that remain inactive under normal conditions and are activated by tumor-specific cues, such as acidic pH or hypoxia [13,14]. These "on-demand" systems enhance biosafety by confining activity to the tumor microenvironment [15]. Nevertheless, most of these strategies rely on a single stimulus, which may also be present in non-tumor tissues, limiting their specificity. Therefore, despite progress, there remains a need for more precise, multi-responsive platforms that can ensure tumor-selective activation and minimize unintended effects on healthy tissues.
To improve specificity, multi-responsive DNAzyme systems need to be developed to function as logical "AND" gates, requiring multiple tumor-associated signals for activation [16]. This strategy enhances selectivity by ensuring activation only within the unique conditions of the tumor microenvironment. Designing such systems necessitates a robust delivery vehicle capable of integrating and responding to diverse cues. Nano-scale metal-organic frameworks (nano-MOFs) offer a promising solution due to their high surface area, tunable porosity, and modular functionality [17–19]. In gene therapy, nano-MOFs protect DNAzymes from degradation, enable high loading capacity, and can be engineered to respond to stimuli such as pH, redox states, or enzymes [20–22]. Additionally, MOFs with biocompatible metal ions can act as catalytic cofactor reservoirs: releasing metal ions upon degradation to activate metal-dependent DNAzymes [23,24]. These properties make nano-MOFs ideal platforms for constructing multi-stimuli-responsive DNAzyme systems, allowing for precise and tumor-specific therapeutic activation.
In this study, a logic-gated, triple-stimuli-responsive nanoplatform was developed by embedding a reactive oxygen species (ROS)-activated DNAzyme into N-acetylgalactosamine (GalNAc)-modified Zn-MOFs for precise and safe HCC therapy (Scheme 1). Zn-MOF protects DNAzyme and releases Zn2+ in response to tumor acidity. Zn2+ generates ROS to remove protective boronate groups and activates the DNAzyme, which cleaves oncogenic early growth response protein 1 (EGR-1) mRNA. This logic-gated activation, via pH, ROS, and Zn2+, ensures tumor-specific activity. Additionally, ROS induces apoptosis through chemodynamic therapy (CDT). This strategy combines CDT and gene therapy to achieve high specificity, improved efficacy, and minimal off-target effects, overcoming the limitations of conventional "always-on" DNAzyme systems. Compared to single- or dual-responsive DNAzymes that are activated by only one stimulus, this logic gate offers an extra layer of stringency, greatly reducing the chance of activation in normal tissues.
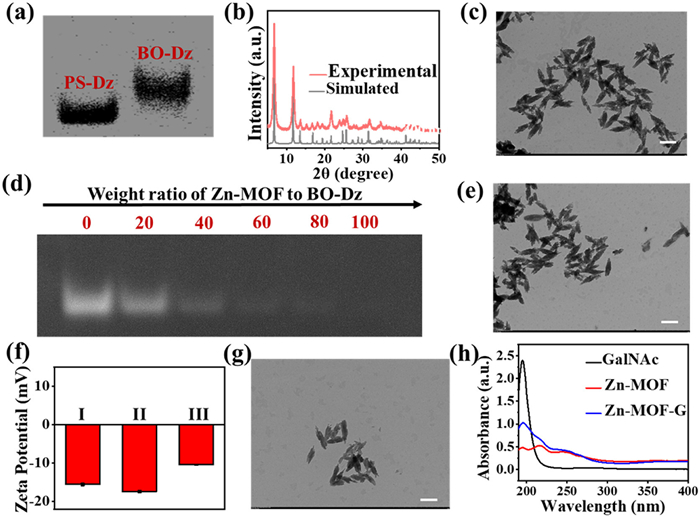
A phosphorothioate (PS)-modified DNAzyme, referred to as PS-Dz for simplicity, contains three PS linkages in the catalytic core and exhibits catalytic efficiency and cleavage behavior that are nearly identical to those of unmodified DNAzyme. This modification allows for the covalent attachment of phenylboronic acid (BO) groups. Subsequently, the Zn2+ and ROS-activated DNAzyme (referred to as BO-Dz) was developed by incorporating BO with the PS groups on the DNAzyme that targets EGR-1 mRNA [25]. BO modification was confirmed by polyacrylamide gel electrophoresis (PAGE) (Fig. 1a and Fig. S1 in Supporting information). After BO decoration, the band appeared higher on the gel, indicating an increased molecular weight and confirming the successful attachment of BO to the PS-Dz. A nanoscale Zn-MOF with a MOF-74 structure was synthesized according to a reported method [26]. The powder X-ray diffraction (PXRD) patterns demonstrate that the synthesized Zn-MOF sample exhibits a high degree of crystallinity, with diffraction peaks that correlate with the simulated patterns from Zn-MOF-74 (Fig. 1b), which confirms the structural integrity of the synthesized MOF as well as its high purity [27]. Transmission electron microscopy (TEM) images revealed a shuttle-like morphology of Zn-MOF nanoparticles (~300 nm in length and 75 nm in width; Fig. 1c), and dynamic light scattering (DLS) data showed a hydrodynamic size of 301.6 ± 2.94 nm (Fig. S2 in Supporting information). BO-Dz was then loaded into Zn-MOF to form BO-Dz@Zn-MOF. PAGE analysis (Fig. 1d and Fig. S3 in Supporting information) demonstrated concentration-dependent loading, with an optimal BO-Dz: Zn-MOF ratio of 1:80. TEM images confirmed that the morphology of the MOF remained unchanged post-loading (Fig. 1e). Zeta potential changed from −15.57 ± 0.29 mV (Zn-MOF) to −17.43 ± 0.31 mV (BO-Dz@Zn-MOF), indicating successful loading (Fig. 1f). For HCC targeting, GalNAc was conjugated to BO-Dz@Zn-MOF by forming amide bonds between residual carboxyl groups on MOF and GalNAc-NH2 to get BO-Dz@Zn-MOF-G. TEM (Fig. 1g) showed slightly reduced dispersity after GalNAc modification, and the zeta potential increased upon GalNAc conjugation (Fig. 1f). UV–vis spectra of Zn-MOF-G exhibited a new peak around 195 nm (Fig. 1h), consistent with GalNAc absorption. Fourier transform infrared (FT-IR) spectra further supported GalNAc attachment, showing characteristic -OH stretching bands around 3300 cm−1 (Fig. S4 in Supporting information). These results confirmed the successful decoration of GalNAc.
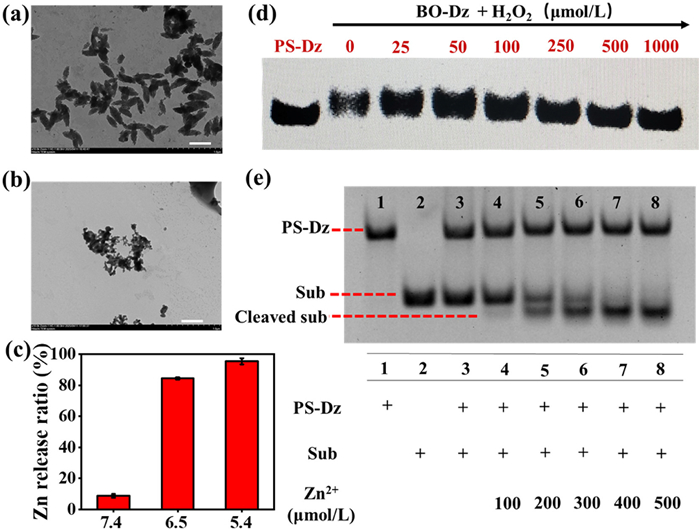
An important feature of the Zn-MOF is its pH-sensitive degradation [28]. In the mildly acidic conditions of tumor microenvironments, Zn-MOF is expected to dissolve, releasing Zn2+ ions and BO-Dz. We assessed the structural collapse and Zn2+ release by incubating Zn-MOF in buffers with pH levels of 7.4 and 6.5. As illustrated in Figs. 2a and b, the morphology of the Zn-MOF was well preserved at pH 7.4. However, 24 h after incubation at a pH 6.5, almost no morphology of the Zn-MOF was observed, indicating that its structure had completely degraded. The Zn release experiment showed that negligible Zn2+ was released at pH 7.4, whereas a substantially higher Zn2+ release ratio was detected at pH 6.5 (> 95%) and even more at pH 5.4 (Fig. 2c). The Zn2+ released at pH 6.5 was ~9 times higher than at pH 7.4. This confirms that Zn-MOF is stable under blood/neutral pH but undergoes degradation in acidic environments, which is a desirable trait for a drug carrier. The BO-Dz was specifically designed for activation by ROS. To verify this critical step, we treated BO-Dz with varying concentrations of H2O2 and analyzed the resulting products using PAGE. As the concentration of H2O2 increased, a corresponding reduction in the intensity of the BO-Dz band was observed, which is indicative of the cleavage of the BO group and the subsequent conversion to the smaller, active PS-Dz (Fig. 2d and Fig. S5 in Supporting information). Densitometric analysis of the bands (Fig. S6 in Supporting information) indicates that significant activation occurred at 250 µmol/L H2O2, while > 70% of BO-Dz was activated at 1000 µmol/L H2O2. We further examined the catalytic activity of BO-Dz before and after H2O2 activation. An RNA substrate that represents a conserved region of EGR-1 mRNA was incubated with BO-Dz or with PS-Dz, in the presence of Zn2+ cofactor. The BO-Dz did not show cleavage of the substrate nor form a cleavage product band, even in the presence of Zn2+, confirming that caged BO-Dz is catalytically inactive (Figs. S7 and S8 in Supporting information). In contrast, the H2O2-activated PS-Dz readily cleaved the substrate in a Zn2+-dependent manner (Fig. 2e and Fig. S9 in Supporting information), as evidenced by the disappearance of the substrate band and appearance of a shorter cleavage fragment on the gel. These results prove that the PS-Dz’s catalytic function can be toggled "off" and "on" through BO caging and H2O2 trigger.
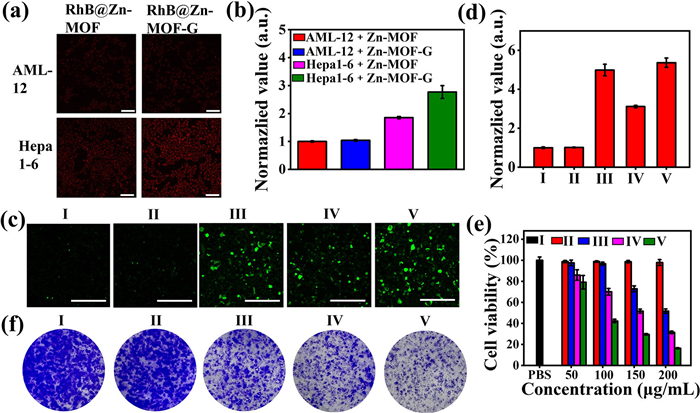
For visualization of cellular uptake, a fluorescent dye (RhB) was loaded into Zn-MOF and Zn-MOF-G as the probe, since the DNAzyme has no intrinsic fluorescence. Confocal laser scanning microscopy (CLSM) revealed moderate fluorescence in Hepa 1–6 cells (high asialoglycoprotein (ASGPR) expression) treated with RhB@Zn-MOF, while RhB@Zn-MOF-G produced significantly stronger intracellular fluorescence (Fig. 3a). Quantitative analysis confirmed a ~1.5-fold increase in fluorescence intensity for the GalNAc-modified group (Fig. 3b). AML-12 cells (low ASGPR expression) showed low uptake regardless of treatment, suggesting that GalNAc promotes ASGPR-mediated endocytosis specifically in HCC cells. Intracellular ROS levels were evaluated using the 2′,7′-dichlorofluorescein diacetate (DCFH-DA) as the probe (Figs. 3c and d). Minimal green fluorescence was observed in the control and BO-Dz groups, while treatment with Zn-MOF-G induced strong fluorescence, indicating the generation of ROS through Zn2+ release. BO-Dz@Zn-MOF-G further increased fluorescence compared to BO-Dz@Zn-MOF, confirming enhanced uptake and ROS production through GalNAc targeting. Importantly, BO-Dz loading did not interfere with ROS generation. The elevated Zn levels can disrupt mitochondrial electron transport and attenuate antioxidant systems (e.g., glutathione), which leads to the generation of abundant ROS [29–31]. To confirm that Zn2+-triggered mitochondrial dysfunction, we assessed mitochondrial membrane potential using Rhodamine 123 (Rh123) as a fluorescent probe. As shown in Fig. S10 (Supporting information), cells treated with Zn-MOF-G exhibited a pronounced decrease in Rh123 fluorescence compared with the control group, indicative of mitochondrial dysfunction. This establishes a feedback mechanism: Enhanced uptake → more Zn2+ → more ROS → faster BO-Dz activation → increased gene silencing and cell killing. MTT assay showed that BO-Dz alone showed no toxicity, confirming its inertness without activation (Fig. 3e). Zn-MOF-G caused ~50% cell death at 200 µg/mL due to ROS generation. BO-Dz@Zn-MOF-G was the most potent, reducing viability to ~20%, indicating the added impact of DNAzyme-mediated EGR-1 mRNA silencing. BO-Dz@Zn-MOF showed intermediate efficacy, highlighting the benefit of GalNAc targeting. Live/dead staining showed that phosphate buffered saline (PBS) and BO-Dz groups showed mostly green (viable) cells, while Zn-MOF induced moderate cell death (red staining). BO-Dz@Zn-MOF further reduced viability, and BO-Dz@Zn-MOF-G caused nearly complete cell death (Fig. S11 in Supporting information). PBS and BO-Dz groups formed many colonies. Zn-MOF-G reduced colony formation, while BO-Dz@Zn-MOF resulted in fewer, smaller colonies. BO-Dz@Zn-MOF-G showed the greatest inhibition, indicating potent, sustained cytotoxicity due to the synergistic combination of GalNAc targeting, ROS generation, and DNAzyme activation (Fig. 3f).
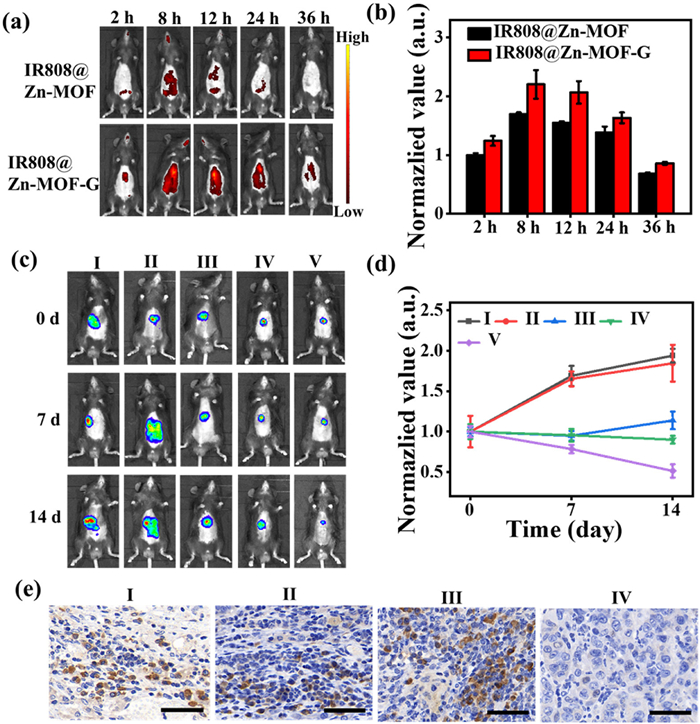
The HCC-targeting ability of Zn-MOF-G carrier in vivo was then confirmed. All animal experiments were approved by the Ethics Committee of Shandong Normal University (approval No. AEECSDNU2024098). HCC tumor-bearing mice intravenously (i.v.) injected via the tail vein with IR808@Zn-MOF-G exhibited significantly higher fluorescence signal in liver area than those receiving unmodified IR808@Zn-MOF, with a fluorescence signal ~1.4 times greater at 8 h post-injection (Figs. 4a and b). Although overall fluorescence decreased by 24–36 h due to particle clearance, IR808@Zn-MOF-G consistently demonstrated enhanced liver localization, confirming successful ASGPR-mediated targeting, a critical feature for HCC therapy. The anti-tumor efficacy revealed that the PBS and BO-Dz groups exhibited rapid tumor growth (Figs. 4c and d), indicating that BO-Dz alone had negligible therapeutic effect. Zn-MOF-G treatment slowed tumor progression by ~50% on day 14, attributed to Zn2+-induced ROS generation. BO-Dz@Zn-MOF achieved further inhibition, highlighting the added impact of gene silencing. Notably, BO-Dz@Zn-MOF-G showed the most potent effect, with tumor luminescence reduced to ~20% of PBS controls by day 14. The marked difference between BO-Dz@Zn-MOF and BO-Dz@Zn-MOF-G underscores the importance of GalNAc-mediated targeting in vivo. This synergy between targeted delivery, ROS generation, and DNAzyme activation results in superior therapeutic efficacy. Histological analysis via hematoxylin and eosin (H&E) staining (Fig. S12 in Supporting information) supported these findings. Tumors from PBS and BO-Dz groups displayed densely packed, atypical cells with little necrosis. Zn-MOF-G and BO-Dz@Zn-MOF treatments caused moderate cellular disruption. In contrast, BO-Dz@Zn-MOF-G induced extensive necrosis, significant loss of viable tumor cells, and structural disintegration. To confirm the therapeutic mechanism, EGR-1 protein expression in tumor tissues was evaluated by immunohistochemistry (Fig. 4e). Strong EGR-1 staining was observed in PBS, BO-Dz, and Zn-MOF-G groups, indicating ineffective treatment. In contrast, tumors treated with BO-Dz@Zn-MOF-G showed markedly reduced EGR-1 expression, consistent with effective gene silencing and tumor suppression. All groups exhibited similar weight trends with no significant weight loss (Fig. S13 in Supporting information). Blood tests and serum biochemistry showed normal values across groups (Figs. S14 and S15 in Supporting information), and histological analysis of major organs (Fig. S16 in Supporting information) revealed no pathological changes. The results showed the triple-stimuli-responsive platform exhibited potent and selective antitumor activity without detectable off-target cytotoxicity. In contrast, a single-stimulus DNAzyme system would likely suffer from compromised specificity. The AND-gated design therefore provides an optimal balance between activation stringency and therapeutic efficacy, ensuring that DNAzyme activation occurs exclusively within the tumor microenvironment where all triggering conditions coexist.
In summary, we have developed a logic-gated, triple-stimuli-responsive DNAzyme nanoplatform for precise HCC therapy. By integrating GalNAc-mediated targeting with a Zn-MOF carrier, this system responds sequentially to tumor-associated acidic pH, Zn2+ release, and ROS generation, constructing an AND logic gate to tightly regulate DNAzyme activation. Such a triple-triggered mechanism ensures that the DNAzyme remains inert in normal tissues and becomes catalytically active only within the tumor microenvironment, significantly enhancing specificity and biosafety. The combination of ROS-mediated CDT and EGR-1-targeted gene silencing achieves synergistic antitumor effects both in vitro and in vivo.
This study provides a proof-of-concept for multi-layered, stimuli-responsive nanotherapeutics, offering a generalizable strategy for safe and precise gene regulation in cancer treatment. The logic-gated platform presented here is highly versatile and generalizable. Any metal-dependent DNAzyme or ribozyme (e.g., Zn2+-, Mg2+-dependent) could, in principle, be caged and delivered using the same strategy. The anti-EGR-1 DNAzyme could be replaced by sequences targeting other oncogenic mRNAs (such as c-Myc or VEGF), while the GalNAc ligand may be substituted with alternative tumor-specific moieties (e.g., folate or RGD peptides) to target different cancer types. Owing to the high porosity and tunable surface chemistry of the MOF carrier, a wide range of therapeutic nucleic acids can be incorporated. Therefore, this triple-stimuli activation framework provides a modular blueprint for developing next-generation multi-responsive nucleic acid therapeutics beyond hepatocellular carcinoma.
Xiuyan Wan: Writing – review & editing, Writing – original draft, Methodology, Funding acquisition, Formal analysis, Conceptualization. Xincheng Qiao: Writing – original draft, Methodology, Formal analysis, Data curation. Yu Zhang: Validation, Methodology, Data curation. Wei Pan: Writing – review & editing, Validation, Funding acquisition. Na Li: Writing – review & editing, Supervision, Funding acquisition. Bo Tang: Supervision, Conceptualization.
The authors declare that they have no known competing financial interests or personal relationships that could have appeared to influence the work reported in this paper.
This work was supported by the Natural Science Foundation of Shandong Province (Major Basic Research Project) (No. ZR2023ZD44), the National Natural Science Foundation of China (No. 22274089), Natural Science Foundation of Shandong Province (Nos. ZR2022YQ10, ZR2024MB022), the Project of Shandong Provincial Center for Fundamental Science Research (No. YDZX2024150).
Supplementary material associated with this article can be found, in the online version, at doi:
Y. Shen, X. Bai, Q. Zhang, et al., Nature 641 (2025) 503–511. doi: 10.1038/s41586-025-08717-5
C.T.J. Magyar, L. Rajendran, Z. Li, et al., Lancet Gastroenterol. Hepatol. 10 (2025) 350–368. doi: 10.1016/S2468-1253(24)00434-5
D. Moris, A. Martinino, S. Schiltz, et al., CA Cancer J. Clin. 75 (2025) 498–527. doi: 10.3322/caac.70018
Y. Drew, F.T. Zenke, N.J. Curtin, Nat. Rev. Drug Discov. 24 (2025) 19–39. doi: 10.1038/s41573-024-01060-w
R. Wang, W. He, X. Yi, et al., J. Am. Chem. Soc. 145 (2023) 17926–17935. doi: 10.1021/jacs.3c05413
N. Wang, Y. Jiang, K. Nie, et al., Chin. Chem. Lett. 34 (2023) 107906. doi: 10.1016/j.cclet.2022.107906
J. Shang, S. Yu, R. Li, et al., Nano Lett. 23 (2023) 1386–1394. doi: 10.1021/acs.nanolett.2c04658
M. Hu, T. Xie, Y. Hu, et al., Chin. Chem. Lett. 35 (2024) 109232. doi: 10.1016/j.cclet.2023.109232
X. Tang, Y. Chen, B. Wang, et al., ACS Nano 18 (2024) 13950–13965. doi: 10.1021/acsnano.4c04147
J. Yan, R. Bhadane, M. Ran, et al., Nat. Commun. 15 (2024) 3684. doi: 10.1038/s41467-024-48149-9
P. Sun, H. Gou, X. Che, et al., Chem. Commun. 60 (2024) 10805–10821. doi: 10.1039/d4cc03774j
X. Zhu, J. Xu, G. Ling, et al., Chem. Soc. Rev. 52 (2023) 7549–7578. doi: 10.1039/d3cs00386h
S. Wang, Y. Liu, J. Shang, et al., Anal. Sens. 3 (2022) e202200065.
S. Lu, J. Shen, C. Fan, et al., Adv. Sci. 8 (2021) 2100328. doi: 10.1002/advs.202100328
D. Wang, J. Duan, J. Liu, et al., Adv. Healthc. Mater. 12 (2023) e2203031. doi: 10.1002/adhm.202203031
Y. Li, K. Tang, X. Zhang, et al., Chem. Commun. 58 (2022) 8754–8765. doi: 10.1039/d2cc02759c
Y. Li, X. Zhang, S. Liu, et al., Chin. Chem. Lett. 36 (2025) 110501. doi: 10.1016/j.cclet.2024.110501
H.Y. Li, X.J. Kong, S.D. Han, et al., Chem. Soc. Rev. 53 (2024) 5626–5676. doi: 10.1039/d3cs00873h
M.K. Sarangi, L.D. Patel, G. Rath, et al., Chin. Chem. Lett. 35 (2024) 109381.
X. Wang, N. Gao, J. Zhao, et al., Coord. Chem. Rev. 517 (2024) 216040.
N. Rabiee, P. Makvandi, Logic for metal-organic framework selection: mOFs for biomedical applications, in: H. Ehtesabi (Ed.), Metal-organic Frameworks in Dermal and Oral Wound Healing, American Chemical Society, Washington D. C, 2024, pp. 181–200.
M.H. Teplensky, M. Fantham, C. Poudel, et al., Chem 5 (2019) 2926–2941. doi: 10.1016/j.chempr.2019.08.015
Z. Wang, J. Niu, C. Zhao, et al., Angew. Chem. Int. Ed. 60 (2021) 12431–12437. doi: 10.1002/anie.202016442
J. Guo, P. Liu, B. Wei, et al., Nano Today 48 (2023) 101722. doi: 10.1016/j.nantod.2022.101722
L. Xiao, C. Gu, Y. Xiang, Angew. Chem. Int. Ed. 58 (2019) 14167–14172. doi: 10.1002/anie.201908105
B.J. Abu Tarboush, A. Chouman, A. Jonderian, et al., ACS Appl. Nano Mater. 1 (2018) 3283–3292. doi: 10.1021/acsanm.8b00501
W. Wong-Ng, J.A. Kaduk, H. Wu, et al., Powder Diffr. 27 (2012) 256–262. doi: 10.1017/S0885715612000863
J. Schnabel, R. Ettlinger, H. Bunzen, et al., ChemNanoMat 6 (2020) 1229–1236. doi: 10.1002/cnma.202000221
K.E. Dineley, L.L. Richards, T.V. Votyakova, et al., Mitochondrion 5 (2005) 55–65. doi: 10.1016/j.mito.2004.11.001
G. Salazar, J. Huang, R.G. Feresin, et al., Free Radic. Biol. Med. 108 (2017) 225–235.
S.A. Dabravolski, N.K. Sadykhov, A.G. Kartuesov, et al., Int. J. Mol. Sci. 23 (2022) 6890 doi: 10.3390/ijms23136890

Scheme 1 Schematic illustration of the preparation of triple-stimuli-responsive nanoplatform and the activating processes of DNAzyme for cancer therapy.

Figure 1 (a) PAGE analysis of PS-Dz before and after BO caging. (b) PXRD pattern simulated from the Zn-MOF-74 structure and experimental PXRD patterns of the prepared Zn-MOF. (c) Representative TEM image of prepared MOF. (d) PAGE analysis of supernatants after incubating BO-Dz with increasing amounts of Zn-MOF. (e) Representative TEM image of BO-Dz@Zn-MOF. (f) Zeta potential of Zn-MOF, BO-Dz@Zn-MOF, and BO-Dz@Zn-MOF-G. Data are presented as mean ± standard deviation (SD) (n = 3). (g) Representative TEM image of BO-Dz@Zn-MOF-G. (h) UV–vis absorbance spectra of GalNAc, Zn-MOF, and Zn-MOF-G. Scale bar: 300 nm.

Figure 2 (a) Representative TEM image of MOF incubated in buffer with pH 7.4 for 24 h. (b) Representative TEM image of MOF incubated in buffer with pH 6.5 for 24 h. (c) Released Zn2+ percentage from Zn-MOF after incubation in buffers with different pH values. Data are presented as mean ± SD (n = 3). (d) PAGE analysis of BO-Dz treated with different concentrations of H2O2. (e) Catalytic activity assay of PS-Dz toward the RNA substrate (Sub) in the presence of Zn2+. Scale bar: 400 nm.

Figure 3 (a) CLSM images of AML-12 and Hepa 1–6 cells after treatment with RhB@Zn-MOF (200 µg/mL, in terms of Zn-MOF weight and containing 15 µg/mL RhB) or RhB@Zn-MOF-G (200 µg/mL, in terms of Zn-MOF weight and containing 15 µg/mL RhB). Scale bar: 100 µm. λex = 561 nm, λem = 570–590 nm. (b) Quantification of cellular fluorescence intensity from (a). (c) CLSM images indicating the intracellular ROS generation in Hepa 1–6 cells after treatment with various formulations (Ⅰ: PBS, Ⅱ: BO-Dz, Ⅲ: Zn-MOF-G, Ⅳ: BO-Dz@Zn-MOF, Ⅴ: BO-Dz@Zn-MOF-G. BO-Dz: 10 µg/mL; Zn-MOF-G, BO-Dz@Zn-MOF, and BO-Dz@Zn-MOF-G: 200 µg/mL, in terms of Zn-MOF amount, with a loading ratio of BO-Dz at 1.25% (w/w)). Scale bar: 250 µm. λex = 488 nm, λem = 520–540 nm. (d) Quantified ROS fluorescence intensity for each group (Ⅰ: PBS, Ⅱ: BO-Dz, Ⅲ: Zn-MOF-G, Ⅳ: BO-Dz@Zn-MOF, Ⅴ: BO-Dz@Zn-MOF-G). (e) MTT cell viability assay for Hepa 1–6 cells treated with different formulations at various concentrations (Ⅰ: PBS, Ⅱ: BO-Dz, Ⅲ: Zn-MOF-G, Ⅳ: BO-Dz@Zn-MOF, Ⅴ: BO-Dz@Zn-MOF-G. The concentrations of Zn-MOF-G, BO-Dz@Zn-MOF, and BO-Dz@Zn-MOF-G are in terms of Zn-MOF weight and the concentration of BO-Dz was maintained at 10 µg/mL). (f) Colony formation assay of Hepa 1–6 after various treatments (Ⅰ: PBS, Ⅱ: BO-Dz, Ⅲ: Zn-MOF-G, Ⅳ: BO-Dz@Zn-MOF, Ⅴ: BO-Dz@Zn-MOF-G. BO-Dz: 10 µg/mL; Zn-MOF-G, BO-Dz@Zn-MOF, and BO-Dz@Zn-MOF-G: 200 µg/mL, in terms of Zn-MOF amount, with a loading ratio of BO-Dz at 1.25% (w/w)). Data are presented as mean ± SD (n = 3).

Figure 4 (a) Fluorescence images of mice post-injection (i.v.) of IR808@Zn-MOF (top row, 50 µL of 4 mg/mL, in terms of Zn-MOF weight and containing 16 µg/mL IR808) or IR808@Zn-MOF-G (bottom row, 50 µL of 4 mg/mL, in terms of Zn-MOF weight and containing 16 µg/mL IR808) at different time points, λex = 780 nm, λem = 845 nm. (b) Quantification of liver fluorescence intensity in Fig. 4a at different time points after injection. (c) Bioluminescence images of representative mice bearing luciferase-expressing Hepa 1-6 tumors from each treatment group on days 0, 7, 14 (Ⅰ: PBS, Ⅱ: BO-Dz, Ⅲ: Zn-MOF-G, Ⅳ: BO-Dz@Zn-MOF, and Ⅴ: BO-Dz@Zn-MOF-G, the formulations were injected at the concentration of 10 mg/kg in terms of Zn-MOF, with a loading ratio of BO-Dz at 1.25% (w/w)). (d) Quantified tumor luminescence vs. time in (c) (Ⅰ: PBS, Ⅱ: BO-Dz, Ⅲ: Zn-MOF-G, Ⅳ: BO-Dz@Zn-MOF, and Ⅴ: BO-Dz@Zn-MOF-G). (e) Immunohistochemical staining of EGR-1 protein in tumor tissues with different treatments (Ⅰ: PBS, Ⅱ: BO-Dz, Ⅲ: Zn-MOF-G, and Ⅳ: BO-Dz@Zn-MOF-G). Scale bar: 50 µm. Data are presented as mean ± SD (n = 3).

 扫一扫看文章


扫一扫关注我们
 DownLoad:
 下载:
下载:
 下载:
下载: