Figure 1.
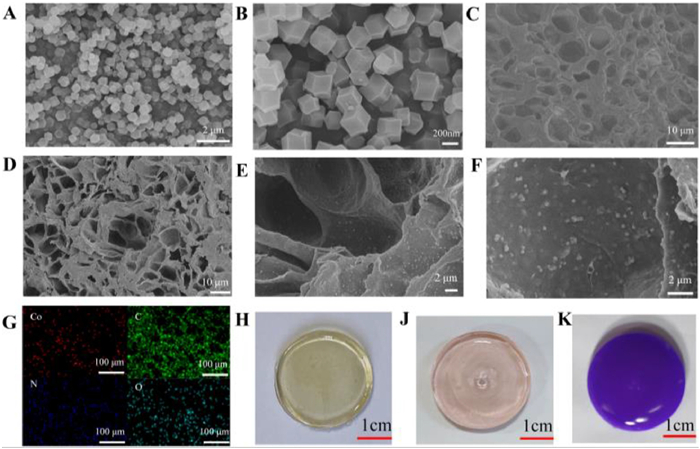
SEM images of ZIF-67 (A, B), CPH (C), and CPZH (D-F), spectral element mapping (G) of CPZH. Macroscopic optical images of CPH (H), CPH/Co2+ (J), and CPZH (K).
Flexible hydrogels with in-situ grown cobalt-based metal-organic frameworks for high-performance electrochemical detection of 2,4,6-trichloropshenol
Xiang Huang , Na Wang , Junyan Liu , Wang Sun , Guorong Sun , Zhou Zhang , Shun Lu , Yang Wang

In the contemporary era, when environmental and food safety concerns are mounting, trichlorophenol (2,4,6-trichlorophenol, TCP) represents a significant environmental pollutant. The World Health Organization has identified it as a priority pollutant and potential carcinogen, citing its hepatotoxicity, developmental toxicity, and endocrine-disrupting properties as primary concerns [1–3]. In light of the potential risks associated with TCP, the detection and monitoring of this compound have become crucial aspects of environmental and public health research. It is important to note that, in comparison with conventional detection methodologies (which include chemiluminescence, high-performance liquid chromatography, fluorescence method), electrochemical sensing technology possesses the advantageous qualities of rapid response speed, high sensitivity, straightforward operation, and minimal cost [4–7]. Consequently, it has garnered increased attention in the domains of detection and analysis. In the process of constructing an electrochemical sensor, the selection of an appropriate material for modification of the working electrode is a pivotal step in enhancing the electrochemical performance of TCP detection.
In recent years, metal-organic frame materials (MOFs) have attracted considerable attention in the field of electrochemical sensing due to their high specific surface area, controllable pore structure and excellent chemical stability [8,9]. Among them, ZIF-67 (zeolite imidazolate frame-67), a cobalt-based MOF material, exhibits good electrical conductivity and catalytic activity, and is considered to be an ideal material for constructing high-performance electrochemical sensors [10]. However, challenges remain in terms of achieving optimal functionality, including instances of agglomeration of particles and inadequate binding strength with the substrate, consequently diminishing the full potential of the material [11]. It is important to note that hydrogel materials have significant potential for application in the field of electrochemical sensing due to their unique three-dimensional network structure, high water content and excellent biocompatibility [12,13]. In particular, chitosan (CS) and polyacrylamide (PAM) hydrogels are ideal substrates for loaded functional materials due to their controllable mechanical properties, good film formation and environmental friendliness [14–16]. Theunique three-dimensional network structure of hydrogels has the potential to increase the effective electrochemical area, as well as to provide high-speed channels for analyte transport and electron transfer [17]. However, the application of traditional hydrogel materials in electrochemical sensing is often limited by their low electrical conductivity and limited active sites [18]. Most of the current studies on the integration of MOF and hydrogel have adopted the method of directly integrating pure MOF powder into hydrogel. However, this approach is often accompanied by issues such as uneven distribution of MOF powder, internal agglomeration, and decreased catalytic activity [19,20]. Consequently, a significant challenge for researchers is the combination of the flexible matrix of hydrogel with the superior performance of MOF functional materials to create high-performance composite sensing materials.
In light of the aforementioned background, a novel strategy was devised in this study: The in-situ growth of ZIF-67 in a composite of chitosan-polyacrylamide hydrogel, the construction of a flexible composite with high electrical conductivity, excellent catalytic activity and good mechanical properties, and its utilization for highly sensitive electrochemical detection of TCP. The agglomeration of ZIF-67 particles is effectively prevented by growing ZIF-67 in situ growth of the hydrogel network, and the binding force between ZIF-67 and the substrate is enhanced, which significantly improves the stability and electrochemical performance of the composite. The use of the flexible three-dimensional network structure and high ion conductivity of the chitosan-polyacrylamide hydrogel is pivotal. The uniform dispersion environment thus provided is conducive to the effective growth of ZIF-67, thereby enhancing the electrochemical response performance of the composite. The construction of an electrochemical sensing platform with high sensitivity, excellent selectivity and good stability is thus achieved, providing a novel method for the rapid detection of TCP. It is noteworthy that there are no reports of the detection of TCP using an electrochemical sensing platform for signal amplification using CPZH.
The microstructures of the prepared materials were visualized by scanning electron microscope (SEM). In Figs. 1A and B, ZIF-67 displays regular dodecahedral crystals with a consistent particle size and well-defined crystal structure [21], with an average diameter of approximately 200 nm. As illustrated in Fig. 1C, CPH displays a distinctive three-dimensional network configuration, characterized by smooth surfaces and uniform channels. It is noteworthy that the SEM image of CPZH (Fig. 1D) displays 3D network structure comparable to that of CPH, yet the surface is uneven. Furthermore, the CPZH magnification in Figs. 1E and F demonstrates that the nanoparticles are embedded on the wall of the hydrogel pore [22]. Energy dispersive X-ray spectroscopy (EDS) spectrum was subsequently employed to analyze the elements present on CPZH. In Fig. 1G, the elements C, N, O and Co were observed to be distributed uniformly across the hydrogel, detailed element content can be seen in Table S1 and Fig. S1 (Supporting information). The distribution of ZIF-67 nanocrystals on the hydrogel is uniform. Compared with the pure ZIF-67 in Fig. 1A, the ZIF-67 grown in situ on CPH (Fig. 1F) has better dispersion. Figs. 1H-K illustrates the macroscopic diagram of pure CPH, CPH/Co2+ and CPZH. Because of the fixation of metal ions, the hydrogel undergoes a change in color from light yellow to pink. Under the influence of organic ligands, the hydrogel assumes a purple hue, akin to that of ZIF-67. The combination of macroscopic and microscopic characterization preliminarily proves the successful preparation of composites.
The crystallinity of ZIF-67, CPH and CPZH was characterized by X-ray diffraction (XRD). Fig. 2A illustrates that CPH exhibits a broad curve, which aligns with the amorphous nature of hydrogels. As anticipated, ZIF-67 exhibits a high degree of crystallinity, with characteristic peaks at 7.28, 10.35, 12.62, 14.71, 16.44, 18.11, 22.18, 24.53, and 26.67, corresponding to (011), (002), (112), (022), (013), (222), (114), (233), and (134) crystal planes. These coincide with the diffraction peak positions of the characteristic peaks [23], indicating that the ZIF-67 nanocrystals have been successfully synthesized. It is noteworthy that the characteristic peaks of ZIF-67 at (002), (112), (222), (114) and (233) are discernible in the XRD pattern of CPZH. However, the characteristic peak at 7.28 is barely perceptible and exhibit lower crystallinity than pure ZIF-67. It is conceivable that the ZIF-67 synthesized locally in the CPH matrix is influenced by the amorphous state of CPH, resulting in a distinct crystal orientation compared to that of pure ZIF-67. Nevertheless, this phenomenon provides further confirmation of the successful synthesis of CPZH.
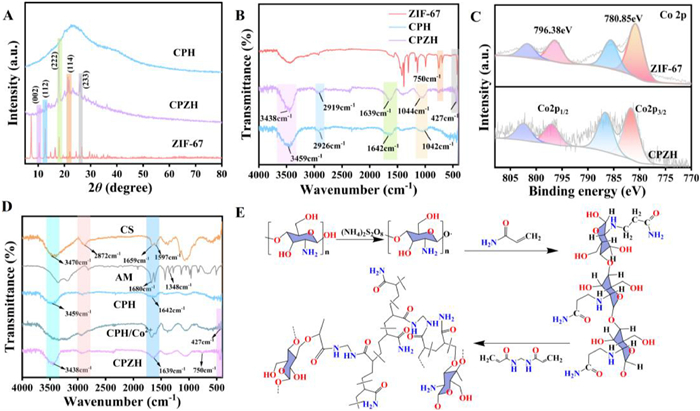
To further validate the successful preparation of CPZH, the chemical bonds and functional groups of the prepared materials were studied by FTIR. FTIR spectra of the samples in the range of 400–4000 cm-1 are presented in Fig. 2B. For the pristine ZIF-67, the IR peak at 427 cm-1 is attributed to the stretching vibration of the Co-N band [24]. The IR peaks at 996.4, 1145.7, and 1175.3 cm-1 are associated with the vibrational absorption of the C—N band, while the stretching vibration of the C—H band is observed at 951.3, 1307.8 and 1422.2 cm-1 [25]. The characteristic peaks of ZIF-67 and CPH were retained in the spectra of CPZH. A comparison of the IR spectra of CPH with that of CPZH revealed the presence of Co-N IR absorption peaks at 427 cm-1 and 750 cm-1, as well as a C=C IR absorption peak. These findings provide evidence that the synthesis of ZIF-67 crystals in the CPZH system was successful. In comparison to CPH, the stretching vibration of the O-H and N-H bonds of CPZH exhibited a red shift to 3438 cm-1, while the stretching vibration peak of the amide group C=O demonstrated a red shift to 1639 cm-1. This indicated the presence of a hydrogen bond between the hydroxyl group and the amide group within the hydrogel. Subsequently, the elemental compositions and valence states of the ZIF-67 regular dodecahedron, CPH and CPZH composite hydrogels were subjected to further analysis by X-ray photoelectron spectroscopy (XPS). The calibration standard is C 1s (284.8 eV). The total spectra of the ZIF-67, CPH and CPZH composite hydrogels are presented in the Fig. S2A (Supporting information). It can be observed that the characteristic peaks of the elements Co, C, N and O are present in CPZH, which indicates that the preparation of the composite hydrogels was successful. Fig. 2C illustrates the XPS spectrum of Co 2p, which exhibits peaks at 781.33 eV and 786.52 eV, ascribed to Co 2p3/2, and peaks at 796.79 eV and 802.67 eV, ascribed to Co 2p1/2. The Co peaks are indicative of Co2+ in Co(OH)2, thereby suggesting that Co is present in the sample in an ortho-bivalent capacity [26]. Two signals, at 287.38 eV and 284.78 eV, are observed in the C 1s spectrum (Fig. S2B in Supporting information). These are attributed to the C-C and C-O bonds in the composite hydrogel [27], respectively. The spectra of N 1s at 399.18, 400.13 and 406.78 eV are characteristic peaks attributed to the N-H bond, the N-C bond and the oxidized-N [28,29], respectively (Fig. S2C in Supporting information). The presence of these chemical bonds provides compelling evidence that the hydrogels have been successfully prepared.
In the pursuit of elucidating the formation mechanism of hydrogels, a meticulous selection of samples at disparate preparation stages was subjected to rigorous infrared testing. Fig. 2D shows the CS characteristic peak at 3470 cm-1 corresponds to the O-H and N-H stretching vibration, and the 2872 cm-1 peak corresponds to the C-H stretching vibration [30]. The peaks at 1659 and 1597 cm-1 correspond to the stretching vibration of C=O and the bending vibration of N-H in the amide group, respectively. In the AM infrared spectrum, the peaks at 3341 cm-1 correspond to the tensile vibrations of N-H, and the absorption bands at 1682 and 1347 cm-1 correspond to the tensile vibrations of C=O and C-N [31]. In comparison with CS, the composite hydrogel (CPH and CPZH) exhibited a shift in the characteristic peaks of -OH and N-H towards higher frequencies, accompanied by the emergence of amide groups within the red shift spectrum. This observation signifies that the amide groups and hydroxyl groups within the hydrogel are engaged in hydrogen bonding, a process that has been demonstrated to enhance the stability of the chain network within the hydrogels [32]. The characteristic peaks of the Co-N bond appear at 427 cm-1 of CPH/Co2+, indicating that Co2+ is fixed on the hydrogel through coordination bonds. The characteristic peaks at 427 cm-1 and 750 cm-1 of CPZH are attributed to the Co-N bond and C=C bond, respectively. Furthermore, an increase in both the stretching and bending patterns of imidazole rings in 2-methylimidazole ligands, and the intensity of the characteristic peaks, is also observed. These results indicate that organic ligands coordinate with metal ions to form ZIF-67, suggesting that the formation of hydrogels may be related to multiple interactions between hydrogen bonds and coordination bonds.
The formation process of hydrogels is as follows: Ammonium persulfate under the action of catalyst TEMED at hot, in aqueous solution into ammonium persulfate free radicals, hydroxyl by ammonium persulfate free radicals on the CS extract H atoms, resulting in a CS free radicals, and then attached on AM monomer, AM monomer polymerization, form polyacrylamide, lead to the chain trigger at the same time, the graft chains were coupled together to form the graft polymer and prepared into chitosan/polyacrylamide hydrogel (Fig. 2E). APS acts synergistically with TEMED, and TEMED acts as a catalyst to accelerate the release of free radicals from APS [33]. Further, the amine group on the chitosan/polyacrylamide hydrogel acts as a weak ligand to bind Co2+ to the hydrogel chain through coordination bonds, providing the nucleation site of MOF. After the addition of the organic ligand 2-methylimidazole, ZIF-67 grows in situ on the hydrogel. CPZH hydrogel was successfully formed. Moreover, Fig. S3 (Supporting information) studies the water content, swelling rate and rheological properties of hydrogels, indicating that CPZH hydrogels have stable physical properties.
Electrochemical impedance spectroscopy (EIS) was employed to investigate the electron transfer process at varying electrodes in a 5 mmol/L [Fe(CN)6]3-/4- solution (containing 0.1 mmol/L KCl) [34]. As Fig. 3A demonstrated, Rct (GCE) > Rct (CPH/GCE) > Rct (ZIF-67/GCE) > Rct (CPZH/GCE), respectively. The reduction in Rct suggests that the CPZH/GCE composites can facilitate the diffusion of potential barriers, promote electron transfer and significantly enhance the electrochemical performance. In Fig. 3B, the CV diagram shows the irreversible oxidation characteristic peaks of different modified electrodes. Moreover, the oxidation peak current value of CPZH/GCE has enhanced peak anode current compared with that of bare GCE, CPH/GCE, and ZIF-67/GCE. This indicates that CPZH/GCE has the highest electrocatalytic activity and has good electrocatalytic activity, which can be attributed to the higher catalytic activity provided by ZIF-67 growing inside CPZH, and the uniform pore of hydrogel provides a high density catalytic active site for TCP, which is conducive to the diffusion of electrochemical processes. The combined effect of charge transfer of ZIF-67 and better adsorption of TCP by hydrogel leads to the enhancement of the peak anode current. In the differential pulse voltammetry (DPV) test in Fig. S4A (Supporting information), the trend of peak current of different electrodes is consistent with CV results.
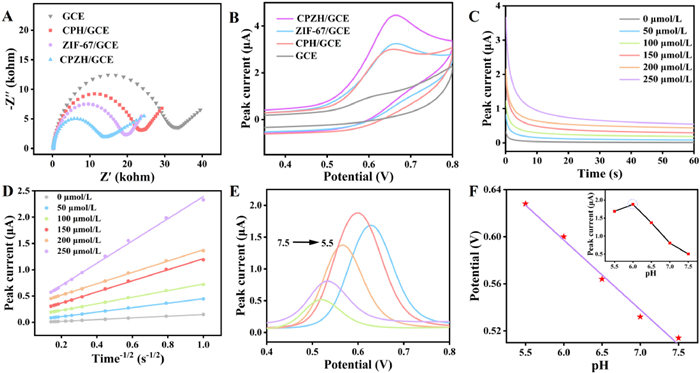
The electrochemically active surface area (ECSA) is closely related to the characteristics of the electrical analysis, and the chronocoulometry (CC) was employed to ascertain the ECSA dimensions of diverse sensing interfaces. In 10 mL of a 5 mmol/L [Fe(CN)6]3-/4- solution (containing 1.0 mol/L KCl), the total charge (Q) of each modified electrode was found to be linearly related to the square root of time (t1/2), as illustrated in Figs. S4B and C. According to the Anson equation (Eq. 1) [35]:
|
|
(1) |
The ECSA of the CPH /GCE, ZIF-67/GCE and CPZH/GCE were calculated to be 0.163, 0.156 and 0.217 cm2, respectively. The CPZH/GCE exhibited the highest ECSA, indicating that it can provide a greater number of active sites for TCP catalysis, thereby accelerating the chemical reaction rate on the electrode surface and improving the sensitivity of detection. The data results of CV and DPV were also verified. In addition, the diffusion coefficient (D) represents a pivotal parameter in the characterization of the diffusion behavior of an analyte in solution. The diffusion coefficient of TCP in the electrochemical system was investigated by the timed-current method, based on the data in Figs. 3C and D and the Cottrell equation (Eq. 2) [36]:
|
|
(2) |
The diffusion coefficients of TCP at different concentrations (50, 100, 150, 200, and 250 μmol/L) were calculated to be 6.682 × 10⁻⁷, 5.864 × 10⁻⁷, 5.108 × 10⁻⁷, 4.385 × 10⁻⁷, and 2.639 × 10⁻⁷ cm2/s, respectively. It has been demonstrated that elevated concentrations can enhance mass transfer resistance, thereby impacting the diffusion rate of the analyte to the electrode surface. pH value can affect the key parameter of sensing performance. When the pH is lower than the isoelectric point, the surface is positively charged and is prone to adsorb negatively charged analytes. Conversely, it repels anions [37]. The electrostatic effect changes the analyte's concentration near the electrode, affecting the detection signal strength. 100 μmol/L TCP was studied in PBS with different pH values. The DPV response of CPZH/GCE at different pH values (5.5, 6.0, 6.5, 7.0, 7.5) is shown in the Fig. 3E. Obviously, when the pH drops from 7.5 to 5.5, the anode peak potential of TCP positively shifts, indicating that protons participate in the oxidation reaction of TCP and proton transfer occurs. Moreover, the oxidation peak current value also varies with pH, indicating that the oxidation process of TCP is dependent on pH. It is worth noting that when pH is 6.0, the DPV current value of TCP is the largest, so PBS with pH of 6.0 is selected for subsequent experiments. There is also literature showing that TCP is medium acid, weakly acidic or neutral pH environment is more conducive to the catalytic reaction of TCP [38]. The illustration in Fig. 3F shows the linear relationship between potential and pH.
The regression equation is Epa (V) = −0.0592 pH + 0.9524 (R2 = 0.9825), and the slope of the equation is 59.2 mV/pH, which is close to the Nernstian value of 59 mV/pH. According to the Nernst equation (Eq. 3) [39]:
|
|
(3) |
Indicating that the number of electrons (n) and protons (m) involved in TCP oxidation is equal [40].
Fig. 4A shows the electrochemical behavior of TCP on CPZH/GCE electrodes. The peak oxidation current (Ipa) value increases with the increase of the scanning rate. The relationship between the peak current and the scan rate is shown in Fig. 4B. In the range of 50–300 mV/s, Ipa increases linearly with the scanning rate, and the linear relationship can be expressed as: Ipa (μA) = 0.0152v + 1.904 (R2 = 0.9928); meanwhile, the oxidation peak potential (Epa) shifts slightly positively with the increase of the scanning rate, indicating that the oxidation of TCP on CPZH/GCE is a typical adsorption control process. Furthermore, Epa and the logarithm of the scanning rate also shows a linear relationship (inset in Fig. 4B): Epa (V)= 0.01386lnν + 0.60617 (R2 = 0.9942); According to the Laviron equation [41], the number of electron transfers of TCP in the electrocatalysis process is approximately 2. In the irreversible reaction process, 2,4,6-TCP loses two protons and two electrons on the electrode surface and then is converted to 2,5-dichlorobenzene quinone (DBQ). The reaction mechanism is shown in Fig. S5 (Supporting information).
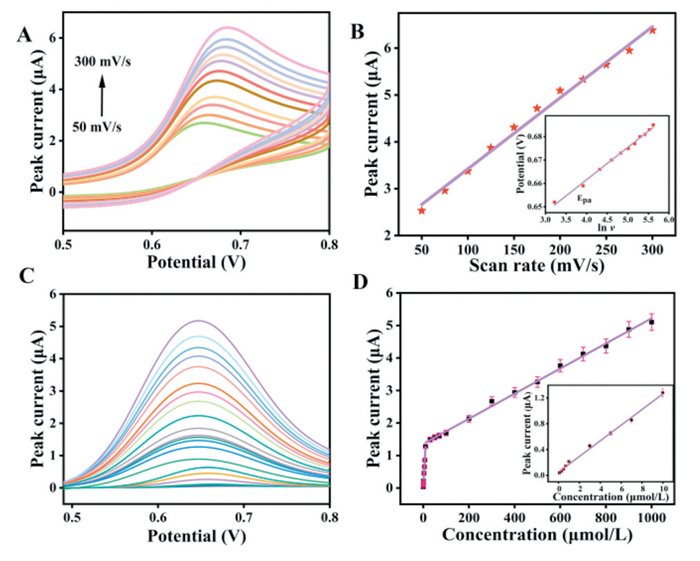
Under the best conditions (Fig. S6 in Supporting information), DPV was used to evaluate the performance of the prepared sensor for TCP (Fig. 4C), the peak current and concentration presented a linear relationship in the range of 0.01–10 μmol/L and 10–1000 μmol/L, respectively. The standard curve is drawn based on the direct proportional relationship between the peak current value and TCP concentration (Fig. 4D), and the following linear regression equation is obtained:
|
|
(4) |
|
|
(5) |
The calculated detection limit of CPZH/GCE sensor for TCP is 0.003 μmol/L. The main reason for the two-stage linear range is the multilayer adsorption after the formation of a single molecular layer on the sensor surface [42]. Compared to most other reported methods for detecting TCP (Table S2 in Supporting information), the analytical performance of the constructed sensor is superior in terms of linear range or detection limits. The excellent performance of the CPZH/GCE electrochemical sensing platform may be due to the high biocompatibility of the hydrogel, which makes the analyte more easily adsorbed, and the large surface area of ZIF-67 constructed by Co2+ and 2-methylimidazole as the precursor, and the more uniform distribution of ZIF-67 grown in situ on the hydrogel. With abundant catalytic active sites, the double-layer network structure of hydrogel and the microporous structure of ZIF-67 cooperate to promote TCP transport and electron transfer, ensuring the efficient TCP catalytic reaction.
In addition, we performed repeatability, reproducibility, stability and selectivity tests on the sensor (Fig. S7 in Supporting information), as well as recovery tests on actual samples (Table S3 in Supporting information), and the results showed that the CPZH/GCE sensor has excellent repeatability and stability. Also demonstrated high recovery rates (97%−102%), (more details are shown in the Support information).
In this work, CPZH was prepared by in-situ growth method using ZIF-67 as MOF model and CPH as gel matrix. By using the advantages of flexibility and high porosity of the hydrogel matrix, the agglomeration problem of MOF powder is solved and the charge transport efficiency of the electroactive site provided by ZIF-67 is improved. The synergistic effect of composite gels plays an important role in the construction of TCP sensors, and excellent electrochemical properties are obtained. Notably, this new electrochemical sensor has a wider linear range (0.01–10 and 10–1000 μmol/L) and a lower detection limit (0.003 μmol/L), with excellent selectivity, repeatability and reproducibility. At the same time, a satisfactory recovery rate has been obtained by testing the actual samples with standard addition method. In summary, CPZH sensor has great potential in the analysis of TCP diagnosis in environmental sewage.
The authors declare that they have no known competing financial interests or personal relationships that could have appeared to influence the work reported in this paper.
Xiang Huang: Investigation, Conceptualization. Na Wang: Validation, Methodology. Junyan Liu: Software. Wang Sun: Data curation. Guorong Sun: Formal analysis. Zhou Zhang: Validation. Shun Lu: Writing – review & editing, Conceptualization. Yang Wang: Supervision, Project administration, Funding acquisition.
This work was supported by the National Natural Science Foundation of China (No. 22174124), and the Fundamental Research Funds for the Central Universities (No. KLSB2024KF-04).
Supplementary material associated with this article can be found, in the online version, at doi:
M. Zhang, Z.Y. Luo, Y.W. Luo, et al., Environ. Technol. Innov. 23 (2021) 101683. doi: 10.1016/j.eti.2021.101683
J. Zhang, C. Wang, M.H. Xiang, et al., Chem. Eng. J. 428 (2022) 131779. doi: 10.1016/j.cej.2021.131779
Q.H. Zeng, S. Peng, M. Liu, et al., Chem. Eng. J. 230 (2013) 202–209. doi: 10.1016/j.cej.2013.06.058
Y. Zhang, H.J. Wang, L. Jiao, et al., Chem. Eng. J. 466 (2023) 143075. doi: 10.1016/j.cej.2023.143075
S. Han, X. Li, Y. Wang, et al., RSC Adv. 5 (2015) 2129–2136. doi: 10.1039/C4RA11029C
J.Q. Feng, Y.Y. Zheng, T. Luo, et al., RSC Adv. 14 (2024) 28976–28983. doi: 10.1039/d4ra03623a
T. Xue, L. Zhou, F.J. Wang, et al., Carbohydr. Polym. 329 (2024) 121758. doi: 10.1016/j.carbpol.2023.121758
Y. Shu, T. Su, Q. Lu, et al., Anal. Chem. 93 (2021) 16222–16230. doi: 10.1021/acs.analchem.1c04106
T. Hou, N.N. Xu, X. Song, et al., Chin. Chem. Lett. 34 (2023) 107907. doi: 10.1016/j.cclet.2022.107907
C.L. Liu, W.B. Feng, Y. Bai, et al., Inorg. Chem. Front. 9 (2022) 5463–5468. doi: 10.1039/d2qi01641a
J. Zou, L. He, W.H. Jin, et al., Ind. Crops Prod. 221 (2024) 119327. doi: 10.1016/j.indcrop.2024.119327
Z.J. Zhao, X. Fan, S.X. Wang, et al., Chin. Chem. Lett. 34 (2023) 107892. doi: 10.1016/j.cclet.2022.107892
Y.J. Gao, J.M. Wang, Y.T. Du, et al., Microchim. Acta 189 (2022) 5. doi: 10.1007/s00604-021-05049-9
L. Bargnesi, A. Rozzarin, G. Lacarbonara, et al., ChemElectroChem 10 (2023) e202201080. doi: 10.1002/celc.202201080
M.S. Hashem, H.S. Magar, Int. J. Biol. Macromol. 280 (2024) 136022. doi: 10.1016/j.ijbiomac.2024.136022
Q. Gao, Y. Zang, J. Xie, et al., RSC Adv. 11 (2021) 36769–36776. doi: 10.1039/d1ra04924k
A. Garai, W. Shepherd, J. Huo, et al., J. Mater. Chem. B 1 (2013) 3678–3684. doi: 10.1039/c3tb20814a
H.Z. Liu, H. Peng, Y.M. Xin, et al., Polym. Chem. 10 (2019) 2263–2272. doi: 10.1039/C9PY00085B
K.Q. Qin, X.Y. Huang, S.F. Wang, et al., Adv. Healthc. Mater. 14 (2025) 2403840. doi: 10.1002/adhm.202403840
Z.Y. Chen, S. Song, H.J. Zeng, et al., Chem. Eng. J. 471 (2023) 144649. doi: 10.1016/j.cej.2023.144649
Q.Y. Li, L. Zhang, Y.X. Xu, et al., ACS Sustainable Chem. Eng. 7 (2019) 5027–5033. doi: 10.1021/acssuschemeng.8b05744
Z. Li, X. Li, Y.Z. Yang, et al., Int. J. Biol. Macromol. 261 (2024) 129929. doi: 10.1016/j.ijbiomac.2024.129929
X.Y. Wu, Q.L. Jing, F.C. Sun, et al., Inorg. Chem. Front. 10 (2023) 78–84. doi: 10.1039/d2qi01966c
S. Ren Q. Yang, Q. Zhao, et al., Chem. Eng. J. 333 (2018) 49–57. doi: 10.1016/j.cej.2017.09.099
W.L. Yao, F.H. Qin, Z.J. Zhao, et al., Ind. Crops Prod. 206 (2023) 117687. doi: 10.1016/j.indcrop.2023.117687
X.X. Sun, W.W. Xu, X.Q. Zhang, et al., J. Energy Chem. 52 (2021) 170–180. doi: 10.1016/j.jechem.2020.04.057
A. Oladipo, B. Kpomah, O. Ejeromedoghene, et al., J. Biol. Macromol. 255 (2024) 128194. doi: 10.1016/j.ijbiomac.2023.128194
B.Y. Lu, X. Han, D. Zou, et al., Mater. Today Bio 16 (2022) 100392. doi: 10.1016/j.mtbio.2022.100392
M. Ullah, L.X. Zheng, V. Tirth, J. Mater. Sci. Mater. 35 (2024) 1633.
G.R. Sun, W. Sun, J.Y. Liu, et al., Inorg. Chem. 63 (2024) 17263–17273. doi: 10.1021/acs.inorgchem.4c03086
C. Zhang, Y.K. Dai, Y.Q. Wu, et al., Carbohydr. Polym. 234 (2020) 115882. doi: 10.1016/j.carbpol.2020.115882
Q.B. Wei, Y.L. Luo, F. Fu, et al., J. Appl. Polym. Sci. 129 (2013) 806–814. doi: 10.1002/app.38788
J.Y. Liu, G.R. Sun, W. Sun, et al., J. Colloid Interface Sci. 671 (2024) 423–433. doi: 10.1016/j.jcis.2024.05.195
J. Li, C.Y. Xu, Y.Z. Shen, et al., Anal. Chim. Acta 1281 (2023) 341923.
J. Y Liu, W. Sun, G.R. Sun, et al., ACS Biomater. Sci. Eng. 11 (2025) 649–660. doi: 10.1021/acsbiomaterials.4c01751
Y.L. Chen, X. Sun, S. Biswas, et al., Biosens. Bioelectron. 141 (2019) 111470. doi: 10.1016/j.bios.2019.111470
T. Javad, F.N. Sayedeh, S. Mojtaba, J. Mol. Liq. 266 (2018) 548–555.
R. Balaji, S. Maheshwaran, S.M. Chen, et al., Environ. Pollut. 296 (2022) 118754.
Y.F. Chen, Y.F. Sun, R.Q. Wang, et al., Biosens. Bioelectron. 228 (2023) 115185.
W. Sun, J.Y. Liu, H.C. Chu, et al., Microchim. Acta 191 (2024) 48. doi: 10.62257/2687-1661-2024-6-48-54
Y.G. Li, L. Zhang, Y.Y. Dang, et al., Biosens. Bioelectron. 127 (2019) 207–214. doi: 10.3901/jme.2019.10.207
S. Biswas, Y.L. Chen, Y. Xie, et al., Anal. Chem. 92 (2020) 4566–4572. doi: 10.1021/acs.analchem.9b05841

Figure 1 SEM images of ZIF-67 (A, B), CPH (C), and CPZH (D-F), spectral element mapping (G) of CPZH. Macroscopic optical images of CPH (H), CPH/Co2+ (J), and CPZH (K).

Figure 2 XRD patterns (A), FTIR patterns (B) of ZIF-67, CPH and CPZH. (C) Co 2p XPS spectra of ZIF-67 and CPZH. (D) Infrared spectra of products at different stages of preparation of CPZH hydrogel. (E) Mechanistic description of hydrogel formation.

Figure 3 (A) EIS in 5.0 mmol/L [Fe(CN)6]3-/4- containing 0.1 mol/L KCl for GCE, CPH/GCE, ZIF-67/GCE, and CPZH/GCE. (B) CV and curves of 100 μmol/L TCP in PBS for GCE, CPH/GCE, ZIF-67/GCE, and CPZH/GCE. (C) Chronoamperometric response at the CPZH/GCE in 0.1 mol/L PBS with varied TCP concentrations: 0, 50, 100, 150, 200, and 250 μmol/L. (D) The linear relationship between I and t-1/2 derived from the Chronoamperometric data. (E) The influence of different pH (5.5–7.5) on the peak current of TCP. (F) The linear relationship between different pH and potential (the illustration is a line graph of the relationship between different pH and the corresponding peak current).

Figure 4 (A) CVs obtained for 100 μmol/L TCP at the CPZH/GCE in 0.1 mol/L PBS (pH 6.0) at different scan rates (from 50–300 mV/s). (B) The dependence of the peak oxidation current on the square root of different scanning rates. (C) Current response diagram of CPZH/GCE to TCP at different concentrations (0.01–1000 μmol/L); (D) Linear plot of current versus TCP concentration (the illustration is a linear interval enlargement from 0.01 μmol/L to 10 μmol/L).

 扫一扫看文章

扫一扫关注我们
 DownLoad:
 下载:
下载:
 下载:
下载: