A dual-signal amplification strategy combining DNA-functionalized covalent organic frameworks and CRISPR-Cas12a for early detection of ovarian cancer biomarkers
Citation:
Yuzhen Wang, Wenxiu Long, Bangshun He, Mengqiu Xiong, Jingjing Li, Yanfeng Gao. A dual-signal amplification strategy combining DNA-functionalized covalent organic frameworks and CRISPR-Cas12a for early detection of ovarian cancer biomarkers[J]. Chinese Chemical Letters,
2026, 37(6): 112061.
doi:
10.1016/j.cclet.2025.112061
A dual-signal amplification strategy combining DNA-functionalized covalent organic frameworks and CRISPR-Cas12a for early detection of ovarian cancer biomarkers
English
A dual-signal amplification strategy combining DNA-functionalized covalent organic frameworks and CRISPR-Cas12a for early detection of ovarian cancer biomarkers
Key Laboratory of Flexible Electronics (KLOFE), Institute of Advanced Materials (IAM) & School of Flexible Electronics (Future Technologies), Nanjing Tech University, Nanjing 211816, China
b.
College of Chemistry and Molecular Sciences, Wuhan University, Wuhan 430072, China
c.
Department of Laboratory Medicine, Nanjing First Hospital, Nanjing Medical University, Nanjing 210006, China
d.
School of Medical Imaging, Wannan Medical College, Wuhu 241002, China
Received Date:
25 March 2025 Accepted Date:
03 November 2025 Revised Date:
08 September 2025 Available Online:
15 June 2026
Abstract:
Ovarian cancer is among the deadliest cancers, with the highest mortality rate among gynecological cancers; thus, highly sensitive early diagnosis is of paramount importance. In this study, we developed an innovative biosensor that integrates DNA-functionalized covalent organic frameworks with CRISPR-Cas12a technology for dual-signal amplification to achieve ultra-sensitive detection of ovarian cancer biomarkers. The COFs were co-functionalized with aptamers specific to target protein biomarkers and a larger number of activators. Upon recognition and binding to target proteins, the activators anchored on the COF surface become accessible in the detection system, converting low-abundance protein signals into amplified nucleic acid signals, which represents the first stage of signal amplification. These activators subsequently trigger the trans-cleavage activity of CRISPR-Cas12a, leading to the cleavage of fluorophore–quencher reporters and resulting in further amplified fluorescence output, constituting the second stage of amplification. This dual-signal amplification strategy, integrated with a microfluidic chip, enabled the sensitive detection of CA125 and HE4, with detection limits as low as 0.001 U/mL and 0.2 pg/mL, respectively, providing a robust, accurate, and scalable platform for ovarian cancer diagnostics and demonstrating potential applications in clinical bioanalysis and diagnosis.
Ovarian cancer ranks among the deadliest gynecological cancers and is characterized by a high mortality rate, primarily because of its asymptomatic nature and the lack of effective early diagnostic tools [1]. Current diagnostic methods, such as imaging techniques (e.g., ultrasound, CT, and MRI), often fail to detect early-stage ovarian tumors due to their limited sensitivity [2,3]. Furthermore, traditional biomarkers such as CA125 and HE4 are widely used for ovarian cancer diagnosis, yet their performance is constrained by insufficient sensitivity and specificity, especially in detecting low-abundance markers [4]. Consequently, many patients are diagnosed at advanced stages, leading to poor prognoses [5]. The development of highly sensitive, specific, and rapid diagnostic methods is therefore critical for improving early detection and patient outcomes [6,7].
The emergence of CRISPR-Cas systems has revolutionized molecular diagnostics, particularly in the detection of disease biomarkers [8,9]. The CRISPR-Cas12a system, derived from the prokaryotic immune system, offers unique advantages, including precise target recognition and robust trans-cleavage activity, making it a promising tool for biosensing [10]. However, its practical application in detecting low-concentration biomarkers is hindered by its limited sensitivity, necessitating the incorporation of auxiliary nucleic acid amplification approaches. Current techniques, such as loop-mediated isothermal amplification (LAMP) [11,12] and recombinase polymerase amplification (RPA) [13], effectively increase sensitivity but introduce additional complexities, including contamination risks, high costs, and lengthy procedures, which limits their feasibility for rapid detection applications.
To address the limitations of nucleic acid amplification techniques, signal amplification strategies have been explored, with nanomaterials playing a critical role in increasing detection sensitivity [14–22]. Among these materials, covalent organic frameworks (COFs) constituting a group of crystalline porous materials characterized by remarkable exceptional surface areas, stabilities, and tunable functionalities, have garnered significant attention [23–27]. COFs strongly interact with nucleic acids, making them suitable for applications such as nucleic acid detection, storage and delivery. Despite their potential, the integration of COFs into diagnostic systems remains underexplored, especially in the context of improving the sensitivity and specificity of CRISPR-based detection platforms.
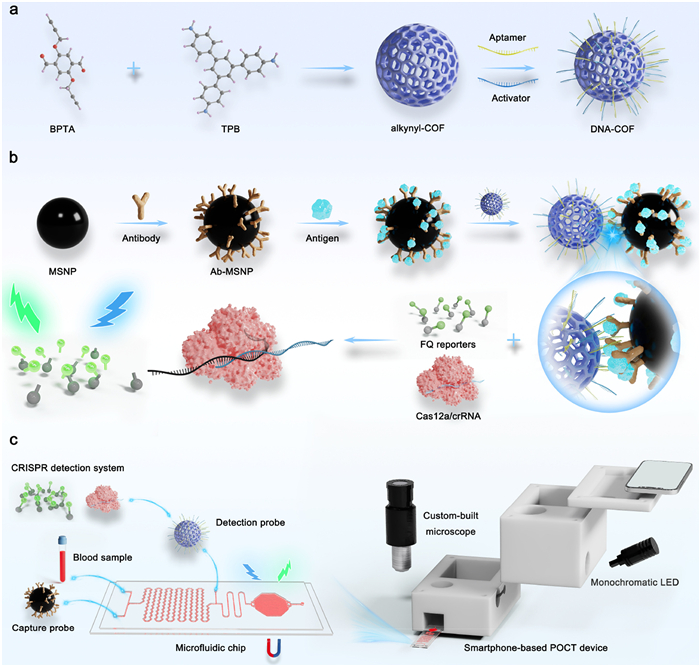
Herein, we propose a novel biosensing strategy that combines DNA-functionalized COFs (DNA-COFs) with CRISPR-Cas12a technology (termed COCAS, COF-based CRISPR amplification sensor) to achieve ultra-sensitive and specific detection of the ovarian cancer biomarkers CA125 and HE4 (Scheme 1). By employing click chemistry, aptamers specific to the target proteins and CRISPR-Cas12a activation chains are covalently immobilized onto the COF surface at a ratio of 1:2 for DNA-COF probe construction. In the presence of the target protein biomarker, the DNA-COFs are captured by magnetic silica nanoparticles (MSNPs) functionalized with capture antibodies (Ab-MSNPs), through the formation of an antibody-protein-aptamer complex. This allowed for the conversion of the protein signal to the aptamer amount, which was further converted into the amplified signal of the activator amount. The MSNP-COF complexes were then extracted, and the activators on the COF surface served to activate the CRISPR-Cas12a system to induce cleavage of the fluorophore-quencher reporters (FQ reporters) and to generate a strong fluorescence signal. This allows the conversion and amplification of the nucleic acid signal into an amplified fluorescence signal. This innovative dual-signal amplification strategy significantly enhances the detection sensitivity and specificity for CA125 and HE4. In addition, a microfluidic chip was further developed for automated sample processing and detection. The system is integrated with a 3D-printed portable device that combines a custom-built fluorescence microscope and a smartphone-based imaging module, enabling quantitative signal readout. This setup offers a promising solution for point-of-care testing (POCT) of clinical biomarkers.
Scheme 1
Scheme 1.
Schematic illustration of the COCAS platform for ovarian cancer biomarker detection. (a) Construction of DNA-COF probes through co-immobilization of aptamers and activators. (b) Dual-signal amplification via aptamer recognition and Cas12a-mediated trans-cleavage for protein biomarker detection. (c) Integration into a portable microfluidic POCT device for quantitative analysis.
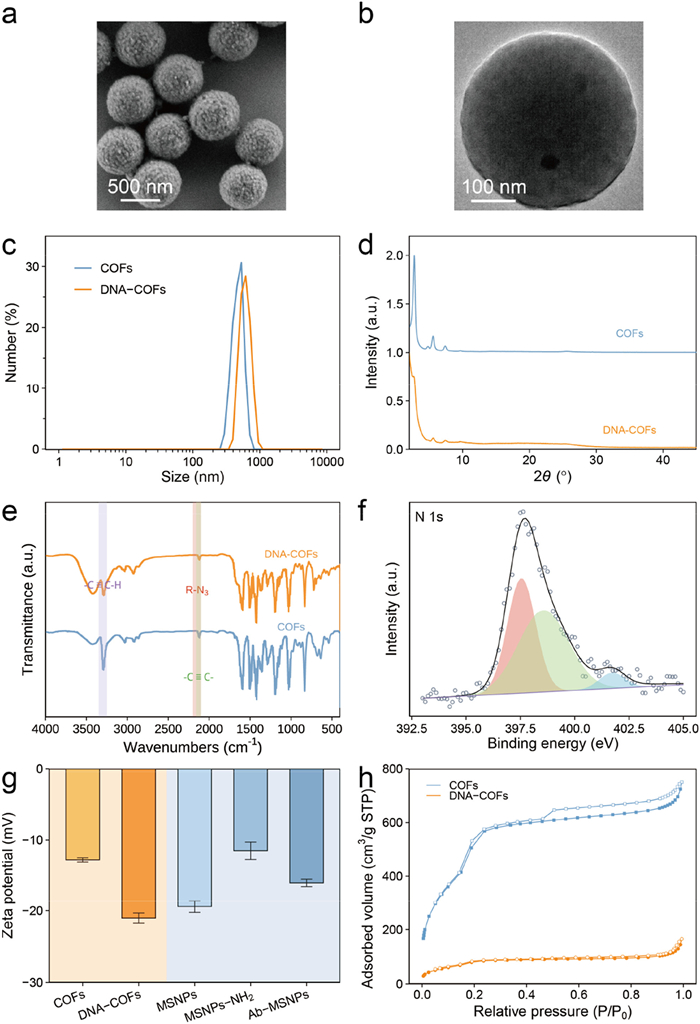
DNA-functionalized COFs play a crucial role in this study, converting protein signals into nucleic acid signals and further contributing to signal amplification. The successful formation and functionalization of COFs were confirmed through multiple characterization techniques. As shown in the scanning electron microscopy (SEM) and transmission electron microscopy (TEM) images (Figs. 1a and b, Fig. S1 in Supporting information), both COFs and DNA-COFs displayed a homogeneous spherical morphology, with average diameters of around 500 nm and 600 nm, respectively (Fig. 1c and Fig. S2 in Supporting information). X-ray diffraction (XRD) patterns revealed that the synthesized COFs exhibited distinct crystallinities, and their characteristic diffraction peaks were largely retained after DNA functionalization, indicating that the overall crystal structure was well preserved (Fig. 1d). Fourier transform infrared (FTIR) spectroscopy of COFs revealed distinct peaks at 3300 and 2150 cm−1, indicative of the stretching vibrations of the C≡C—H and C≡C bonds, respectively, which demonstrated the presence of the alkynyl groups necessary for the subsequent click reaction. The peak at around 2120 cm-1 in the DNA-COF spectrum was attributed to the azide functional group, suggesting successful functionalization of the DNA strings (Fig. 1e). Successful DNA functionalization was also confirmed by the presence of nitrogen through X-ray photoelectron spectroscopy (XPS) analysis (Fig. 1f and Fig. S3 in Supporting information), as well as the shift in the zeta potential from neutral to negative values due to the negatively charged nature of the DNA (Fig. 1g). Moreover, the typical type IV nitrogen adsorption-desorption isotherms with pronounced hysteresis loops of both the COFs and DNA-COFs confirmed the mesoporous nature of the materials. The decrease in the specific surface area from 1736.07 m2/g to 281.95 m2/g was probably due to partial pore occupation or blockage by the DNA strands, further suggesting successful DNA functionalization (Fig. 1h). Additionally, UV‒visible spectroscopy showed strong absorption peaks, supporting the stable binding of azide-modified DNA to COFs through CuAAC reactions (Fig. S4 in Supporting information).
Figure 1
Figure 1.
Structural and surface characterization of COFs, DNA-COFs, MSNPs, and Ab-MSNPs. (a) SEM image of DNA-COFs. (b) TEM image of DNA-COFs. (c) Size distributions of COFs and DNA-COFs. (d) XRD patterns of COFs and DNA-COFs. (e) FTIR spectra of COFs and DNA-COFs. (f) N 1s XPS spectrum of DNA-COFs. (g) Zeta potentials of COFs, DNA-COFs, MSNPs, MSNPs-NH2, and Ab-MSNPs. (h) N2 adsorption–desorption isotherms of COFs and DNA-COFs at 77 K.
The synthesis and successful formation of Ab-MSNPs for specific recognition, capture and separation of target proteins were also investigated. A core-shell architecture averaging roughly 600 nm in diameter was observed in the TEM and SEM images (Figs. S5 and S6 in Supporting information). A significant shift in the zeta potential after antibody conjugation also indicated successful surface modification (Fig. 1g). These Ab-MSNPs demonstrated high specificity for capturing target proteins, forming the basis for subsequent sandwich structure assembly in the detection process.
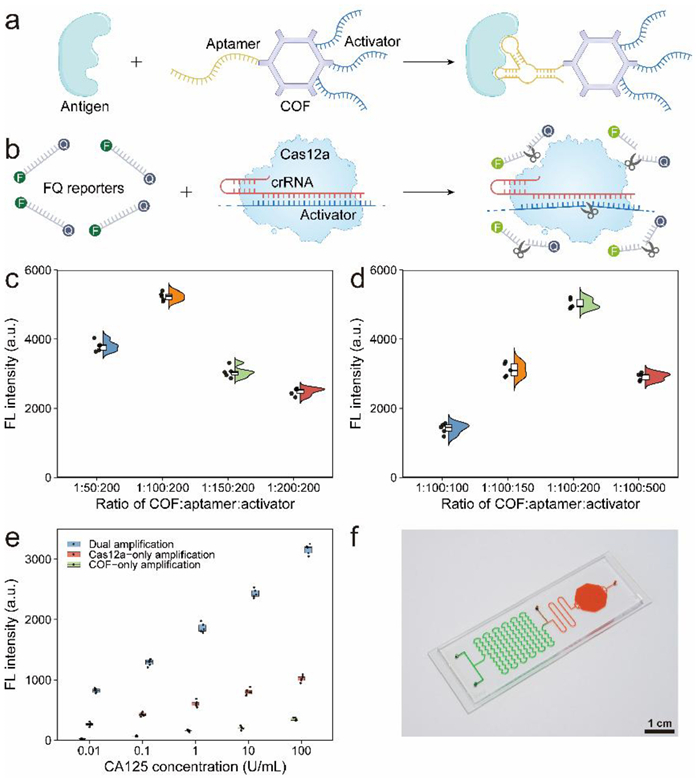
Ab-MSNPs serve as reliable probes for isolating target proteins from complex samples on the basis of specific antigen-antibody affinity. Subsequently, DNA-COFs containing aptamers specifically bind to the captured protein biomarkers and form Ab-MSNP/protein/DNA-COF sandwich structures. Simultaneously, each COF nanoparticle functionalized with aptamers is also modified with multiple activators, which converts the concentration of target proteins into the level of DNA-COFs and further generates an amplified nucleic acid signal (Fig. 2a). These activators further trigger the trans-cleavage activity of Cas12a proteins, which nonspecifically cleave FQ reporters and convert the nucleic acid signal into an amplified fluorescence signal (Fig. 2b). The dual-signal amplification strategy was expected to achieve enhanced detection sensitivity.
Figure 2
Figure 2.
Optimization and validation of the dual-signal amplification strategy and microfluidic integration. (a) Schematic of the first amplification strategy used to convert protein concentrations to amplified nucleic acid signals. (b) Schematic of the second amplification strategy used to convert the DNA signals to amplified fluorescence signals. (c) Optimization of the COF: aptamer: activator ratio by varying the aptamer amount. (d) Optimization of the COF: aptamer: activator ratio by varying the activator amount. (e) Comparison of fluorescence intensities between dual amplification and single-stage amplification controls. (f) Photograph of the microfluidic chip integrated with the COCAS platform.
To further improve the biosensing performance, key experimental parameters, particularly the concentrations of the aptamers and activators used for COF functionalization, were systematically optimized. On the one hand, the aptamer concentration plays a pivotal role in the final fluorescence signal. A small number of aptamers linked to the COF surface reduced the efficiency of target protein recognition, thereby resulting in relatively weak fluorescence signals and decreased detection sensitivity. On the other hand, an excess of aptamers likely competed with activators for limited anchoring sites on the COF surface, thereby decreasing the number of activators linked to the COF and reducing the amplification efficiency. Therefore, the final fluorescence showed a bell-shaped response curve in relation to the aptamer concentration, with an optimal COF-to-aptamer molar ratio of 1:100 (Fig. 2c). Similarly, for the activator concentration, low activator levels reduce or even inhibit Cas12a activity to cleave the FQ reporters, whereas excess activators may lead to trans-cleavage of the activators themselves rather than the FQ reporters, also diminishing the fluorescence output. Therefore, the fluorescence intensity also showed a bell-shaped dependence on the activator concentration (Fig. 2d), and the optimal COF-to-activator molar ratio was determined to be 1:200. Finally, the co-optimization of both the aptamer and activator concentrations resulted in an optimal ratio of 1:100:200 (COF: aptamer: activator) for probe fabrication. Under these optimized functionalization conditions, the COCAS showed extremely superior signal amplification efficiency in comparison with single-amplification strategies relying on either the DNA-COF system or the CRISPR-Cas12a system (Fig. 2e). Finally, a microfluidic device was designed and employed to detect target proteins via the dual-signal amplification strategy of the COCAS (Fig. 2f and Figs. S7–S9 in Supporting information).
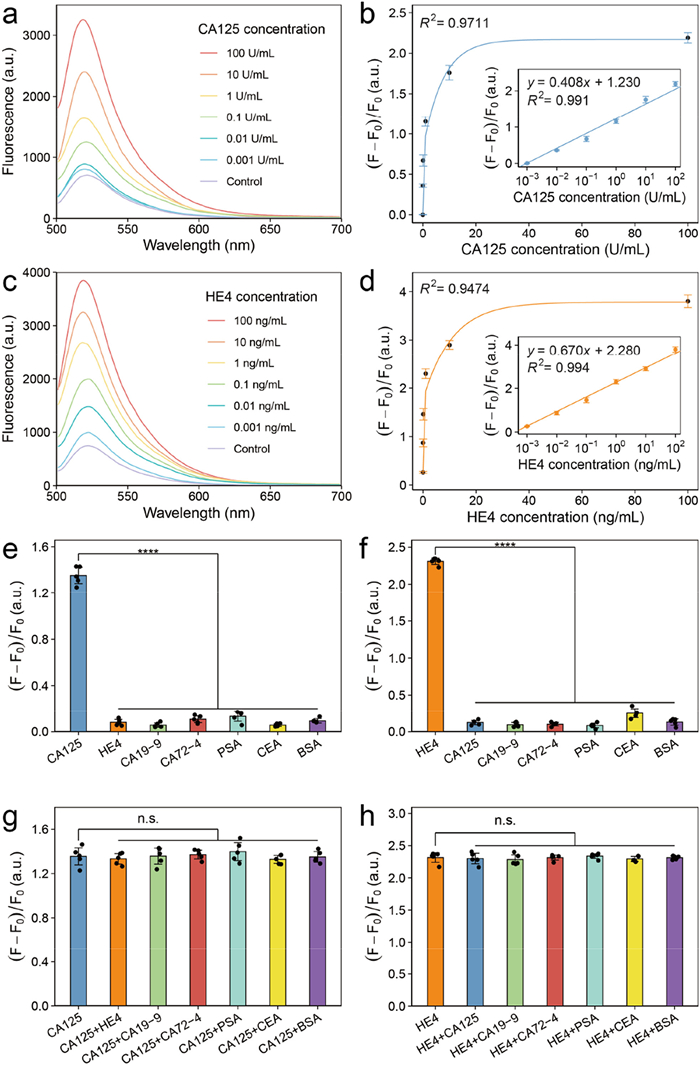
To evaluate the detection performance of the COCAS in terms of the dynamic detection range and limit of detection (LOD), CA125 and HE4 were quantitatively measured in PBS buffer under optimized conditions. For CA125, the fluorescence spectra corresponding to different concentrations are shown in Fig. 3a, and the calibration curve of the fluorescence intensity at a wavelength of 525 nm in relation to the CA125 concentration is presented in Fig. 3b. The biosensor exhibited a dynamic linear detection range with the CA125 concentration logarithm ranging from 0.001 U/mL to 100 U/mL (insert of Fig. 3b), and the LOD was calculated to be 0.001 U/mL. Similarly, the fluorescence spectra and the corresponding calibration curve for HE4 are shown in Figs. 3c and d. The dynamic range for detection was 0.001–100 ng/mL (insert of Fig. 3d), with the LOD established at 0.2 pg/mL. The detection limits for CA125 and HE4 are approximately four orders of magnitude lower than their respective clinical thresholds (CA125: 35 U/mL; HE4: 140 pmol/L or ~4 ng/mL), demonstrating the platform's ability for highly sensitive detection.
Figure 3
Figure 3.
Quantitative analysis of CA125 and HE4 in buffer. (a) Fluorescence spectra of CA125 at different concentrations. (b) Calibration curve for CA125 detection, with the insert showing the linear range. (c) Fluorescence spectra of HE4 at different concentrations. (d) Calibration curve for HE4 detection, with the insert showing the linear range. (e) Fluorescence intensity comparisons between CA125 (1 U/mL) and interfering compounds (10 ng/mL). (f) Fluorescence intensity comparisons between HE4 (1 ng/mL) and interfering compounds (10 ng/mL). (g) Fluorescence intensity levels of CA125 (1 U/mL) without and with interfering compounds (10 ng/mL). (h) Fluorescence intensity levels of HE4 (1 ng/mL) without and with interfering compounds (10 ng/mL).
The specificity of the biosensor was also assessed, by applying five common interfering proteins: Cancer antigen 19–9 (CA19–9), cancer antigen 72–4 (CA72–4), prostate-specific antigen (PSA), carcinoembryonic antigen (CEA), and bovine serum albumin (BSA). In this evaluation, the concentrations tested for CA125 and HE4 were 1 U/mL and 10 ng/mL, respectively, while the interferents were maintained at 10 ng/mL. Significantly higher fluorescence intensities were observed for the targeted CA125 or HE4 than for the interferents (Figs. 3e and f), and a negligible influence was found when the target CA125 and HE4 were mixed with interferents (Figs. 3g and h) indicating minimal cross-reactivity and demonstrating the superior discriminatory ability of the biosensor for the target biomarkers.
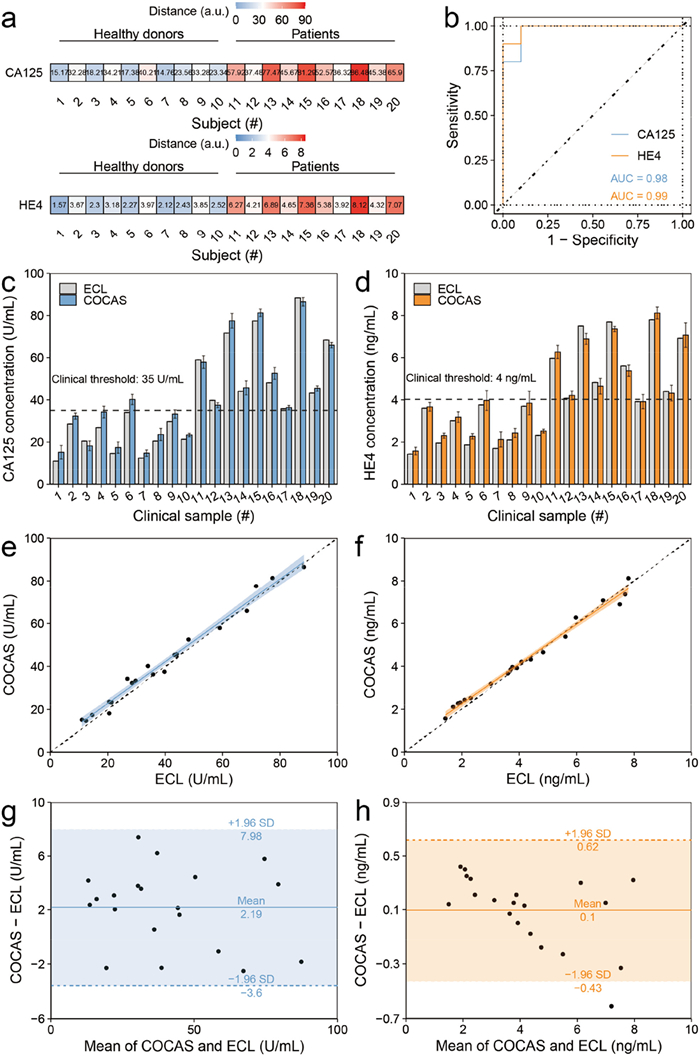
To further evaluate the clinical applicability of the biosensor, human serum samples from 10 healthy volunteers and 10 ovarian cancer patients (Table S1 in Supporting information) were tested, which revealed notably elevated CA125 and HE4 levels associated with ovarian cancer patients (Fig. 4a). By adopting clinically established cut-off values (CA125: 35 U/mL; HE4: 4 ng/mL) to differentiate between healthy and ovarian cancer patient samples, the platform achieved 100% sensitivity and 90% specificity for CA125, and 90% sensitivity and 100% specificity for HE4, with corresponding area under the curve (AUC) values of 0.98 and 0.99, respectively (Fig. 4b). These values are in close agreement with those obtained via statistically optimized thresholds, further supporting the robustness of the platform. All serum samples were collected with informed consent and under ethical approval from Nanjing First Hospital.
Figure 4
Figure 4.
Quantitative detection of targets in clinical samples via the COCAS platform. (a) Heatmaps revealing CA125 and HE4 concentrations in clinical serum samples. (b) ROC curves for CA125 and HE4 detection. (c) Comparison of CA125 concentrations measured by the COCAS platform and the ECL method. (d) Comparison of HE4 concentrations measured by the COCAS platform and the ECL method. (e) Correlation between the COCAS and ECL measurements for CA125. The dashed line indicates the clinical threshold (35 U/mL). (f) Correlation between COCAS and ECL measurements for HE4. The dashed line indicates the clinical threshold (4 ng/mL). (g) Bland‒Altman plot comparing CA125 concentrations obtained by the two methods. (h) Bland‒Altman plot comparing HE4 concentrations obtained by the two methods.
Strong consistency was observed between these results and those obtained by the conventional electrochemiluminescence (ECL) assay (Figs. 4c and d), with Pearson's r values of 0.991 for CA125 and 0.994 for HE4, demonstrating a robust linear correlation between the two methods (Figs. 4e and f). Additional analysis via Bland‒Altman plots (Figs. 4g and h) also confirmed high consistency between the COCAS and ECL methods, as most differences were within the limits of agreement (± 1.96 standard deviations (SD)), and the interclass correlation coefficient (ICC) values of 0.987 for CA125 and 0.991 for HE4 further validated their strong concordance (Figs. 4g and h).
This study presents an innovative bioassay system that leverages superiorities of COFs in terms of structural tunability, large surface areas, high surface functionalization capacity, etc., which makes COFs excellent candidates in the COCAS for efficient signal conversion and amplification (Table S2 in Supporting information). Furthermore, by ingeniously integrating DNA-COF nanoparticles with CRISPR-Cas12a gene editing technology, the system achieves highly sensitive biomarker detection through an innovative dual-signal amplification strategy. With LODs of 0.001 U/mL for CA125 and 0.2 pg/mL for HE4, the COCAS method demonstrated exceptional performance in detecting these biomarkers, in comparison with traditional methods (Tables S3 and S4 in Supporting information). This advancement provides a robust foundation for identifying ovarian cancer at an early stage. Furthermore, compared with the commonly used ECL method, the COCAS has demonstrated its ability to detect targeted biomarkers in clinical samples with good consistency, underscoring its potential as a powerful tool for the early screening of ovarian cancer.
The advantages of the COCAS include excellent sensitivity, high specificity, portability and small sample volume requirements (10 μL vs. 100 μL for ECL). In addition to being integrated within microfluidic devices, the COCAS has also shown great potential for broader clinical applications, including POCT. Additionally, by adjusting different aptamers, this biosensor can be readily adapted to detect a variety of biomarkers, including disease-related nucleic acids, proteins, and cells in bodily fluids, thereby advancing the clinical application of liquid biopsies. This technological breakthrough is poised to play a pivotal role in various fields, including clinical disease diagnosis, personalized medicine, infectious disease monitoring, and food safety testing, providing a more formidable tool for early disease detection and precision treatment. It may even shape the development trajectory of the next generation of biosensing technology.
Acknowledgments
The authors gratefully acknowledge the support of this research by the National Natural Science Foundation of China (Nos. 22377055, 82472379 and 82572370), and the Scientific Research Foundation of Education Department of Anhui Province of China (No. 2024AH051911).
Declaration of competing interest
The authors declare that they have no known competing financial interests or personal relationships that could have appeared to influence the work reported in this paper.
J. Li, W. Bi, Y. Gao, et al., Sens. Actuators B 408 (2024) 135526.
[19]
Y. Gao, D. Zhou, Q. Xu, et al., ACS Appl. Mater. Interfaces 15 (2023) 5010–5018.
[20]
Y. Gao, Y. Wang, B. He, et al., Angew. Chem. Int. Ed. 62 (2023) e202302000.
[21]
D. Ouyang, Z. Fu, G. Li, et al., Chin. Chem. Lett. 34 (2023) 107992.
[22]
D. Ouyang, C. Wang, C. Zhong, et al., Chem. Sci. 15 (2024) 278–284.
[23]
A. Wang, X. Liu, S. Feng, et al., ChemBioChem 26 (2024) e202400807.
[24]
M. Sun, Z. Liu, L. Wu, et al., J. Am. Chem. Soc. 145 (2023) 5330–5341.
[25]
K. Geng, T. He, R. Liu, et al., Chem. Rev. 120 (2020) 8814–8933.
[26]
Y. Shi, J. Yang, F. Gao, Q. Zhang, ACS Nano 17 (2023) 1879–1905.
[27]
G. Li, Y. Wu, C. Zhong, et al., Chin. Chem. Lett. 35 (2024) 108904.
Scheme 1
Schematic illustration of the COCAS platform for ovarian cancer biomarker detection. (a) Construction of DNA-COF probes through co-immobilization of aptamers and activators. (b) Dual-signal amplification via aptamer recognition and Cas12a-mediated trans-cleavage for protein biomarker detection. (c) Integration into a portable microfluidic POCT device for quantitative analysis.
Figure 1
Structural and surface characterization of COFs, DNA-COFs, MSNPs, and Ab-MSNPs. (a) SEM image of DNA-COFs. (b) TEM image of DNA-COFs. (c) Size distributions of COFs and DNA-COFs. (d) XRD patterns of COFs and DNA-COFs. (e) FTIR spectra of COFs and DNA-COFs. (f) N 1s XPS spectrum of DNA-COFs. (g) Zeta potentials of COFs, DNA-COFs, MSNPs, MSNPs-NH2, and Ab-MSNPs. (h) N2 adsorption–desorption isotherms of COFs and DNA-COFs at 77 K.
Figure 2
Optimization and validation of the dual-signal amplification strategy and microfluidic integration. (a) Schematic of the first amplification strategy used to convert protein concentrations to amplified nucleic acid signals. (b) Schematic of the second amplification strategy used to convert the DNA signals to amplified fluorescence signals. (c) Optimization of the COF: aptamer: activator ratio by varying the aptamer amount. (d) Optimization of the COF: aptamer: activator ratio by varying the activator amount. (e) Comparison of fluorescence intensities between dual amplification and single-stage amplification controls. (f) Photograph of the microfluidic chip integrated with the COCAS platform.
Figure 3
Quantitative analysis of CA125 and HE4 in buffer. (a) Fluorescence spectra of CA125 at different concentrations. (b) Calibration curve for CA125 detection, with the insert showing the linear range. (c) Fluorescence spectra of HE4 at different concentrations. (d) Calibration curve for HE4 detection, with the insert showing the linear range. (e) Fluorescence intensity comparisons between CA125 (1 U/mL) and interfering compounds (10 ng/mL). (f) Fluorescence intensity comparisons between HE4 (1 ng/mL) and interfering compounds (10 ng/mL). (g) Fluorescence intensity levels of CA125 (1 U/mL) without and with interfering compounds (10 ng/mL). (h) Fluorescence intensity levels of HE4 (1 ng/mL) without and with interfering compounds (10 ng/mL).
Figure 4
Quantitative detection of targets in clinical samples via the COCAS platform. (a) Heatmaps revealing CA125 and HE4 concentrations in clinical serum samples. (b) ROC curves for CA125 and HE4 detection. (c) Comparison of CA125 concentrations measured by the COCAS platform and the ECL method. (d) Comparison of HE4 concentrations measured by the COCAS platform and the ECL method. (e) Correlation between the COCAS and ECL measurements for CA125. The dashed line indicates the clinical threshold (35 U/mL). (f) Correlation between COCAS and ECL measurements for HE4. The dashed line indicates the clinical threshold (4 ng/mL). (g) Bland‒Altman plot comparing CA125 concentrations obtained by the two methods. (h) Bland‒Altman plot comparing HE4 concentrations obtained by the two methods.

 DownLoad:

 下载:
下载:


 下载:
下载:
