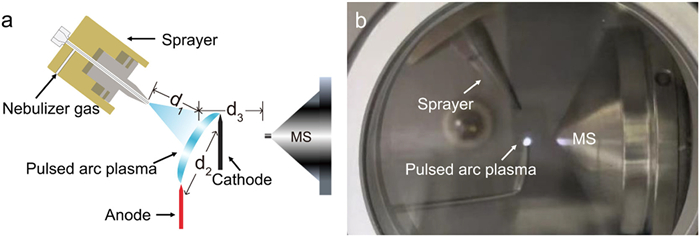
Figure 1.
(a) Schematic diagram and (b) photo of TPAP-MS.
Energy-resolved in-source dissociation spectra by tunable pulsed arc plasma ionization for the differentiation of structural isomers
Ming-Mai Bao , Ying-Chao Liu , Hao-Nan Xu , Jing Zhang , Yin-Long Guo

Isomers, a category of compounds sharing identical molecular formula while possessing distinct chemical structure, have been a focal point of scientific research for decades. Their distinct structural arrangements lead to significant variations in physical, chemical, and consequently, biological and pharmaceutical properties [1]. The fundamental similarity in elemental composition, yet diversity in structural arrangement, presents challenges in isomer differentiation. Various techniques, such as nuclear magnetic resonance [2], ultraviolet and infrared spectroscopy [3,4], chromatography [5], capillary electrophoresis [6,7], and mass spectrometry (MS), have been developed for isomer differentiation and identification. Compared to other techniques, MS offers advantages in speed, sensitivity and specificity, and has been widely used for differentiation of isomers. Atmospheric pressure ionization techniques tend to produce protonated or adduct ions without generating fragment ions through dissociation, limiting their ability to provide structural information. Therefore, structural analysis by mass spectrometry mainly relies on the fragment data analysis via tandem mass spectrometry (MS/MS). However, traditional MS/MS dissociation techniques like collision-induced dissociation (CID) [8] and electron capture dissociation (ECD) [9] encounter challenges in differentiating structurally similar isomers, due to the generation of analogous fragments. This underscores the urgency of developing new methodologies for isomeric differentiation.
One such approach involves the derivatization of isomers using specific ion-molecule reactions to enhance structural differences, thereby influencing fragmentation patterns and resulting in isomer-specific fragments. For instance, ozone-induced dissociation has been utilized for analysis of lipid isomers [10]. Coupling ion mobility with MS (IM-MS) offers an additional dimension for resolving isobaric ions that are indistinguishable by MS alone. Successful separation and identification of glycans [11], lipids [12], peptides [13,14] and metabolite isomers [15,16] with various types of isomerization have been achieved by IM-MS. Both combining ion mobility with MS/MS [17] and using derivatization combined with IMS-MS/MS [18] are common methods for isomer analysis. Recent years, energy resolved mass spectrometry (ER-MS) has emerged as a novel approach to differentiate isomers [19–21]. ER-MS modulates the internal energy of the precursor ion by systematically varying collision energy during dissociation. This modulation leads to the generation of fragment abundance curves in response to collision energy, facilitating isomer differentiation [22]. Moreover, an innovative online ER-MS program utilizing pseudo-ion transition has been developed and demonstrated for differentiation of natural product isomers, such as phenylethanoid glycosides [23,24], lignans [25], bile acids [26] and chlorogenic acid [27].
However, not all mass spectrometers are equipped with collision cells for MS/MS analysis. Consequently, in-source CID has emerged as an alternative method. This approach activates analytes through collisions with residual background gas within the source region of the mass spectrometer [28], enabling acquisition of both molecular formula and structural information. In-source CID has been widely utilized in the fragmentation of a diverse range of compounds, spanning from macromolecules like peptides [29,30] and oligosaccharides [31] to smaller molecules such as cathinones [32], fentanyl analogs [33] and lysergic acid diethylamide [34].
In recent decades, various plasma-based ionization techniques have been developed, including direct analysis in real time (DART) [35], dielectric barrier discharge ionization (DBDI) [36], low-temperature plasma (LTP), flexible microtube plasma and arc plasma [37,38]. Among these, arc plasma has been utilized as an ambient ionization technology applied for the detection of a wide range of substances, including plasticizers in wrap films [39], explosives [40], polycyclic aromatic hydrocarbons [41], and polymers [42,43]. When combined with other ionization technologies, the utility of arc plasma expands further. For instance, employing a low-temperature direct current arc has led to the development of pulsed direct current arc-induced nanoelectrospray ionization mass spectrometry (DCAI-nano-ESI-MS), which is used to analyze various biological molecules [44]. Additionally, the arc-induced electrospray ionization (AESI) source leverages the temperature and charge properties of arc plasma to generate aerosols of charged microdroplets, providing advantages such as high salt tolerance, the ability to analyze compounds of varying polarities, and reliable quantitative analysis of amino acids in complex matrices [45]. In addition to ion source technology, capitalizing on the high energy, temperature, and unique reactivity of the continuous arc, arc plasma-based in-source dissociation (APD) technology has been developed. This APD device induces the dissociation of organic compounds in specific patterns, facilitating fingerprinting mass spectrometric analysis of a wide range of compounds [46]. However, continuous arc plasma presents inherent challenges, as its signal is easily influenced by surrounding airflow. Additionally, its uncontrollable high temperature can cause the dissociation of thermally unstable compounds. When integrated with LC-MS interface technology for analyzing liquid samples, there is a risk of igniting the solvent, which compromises the stability and safety of the analysis. These factors impede its application in energy-resolved mass spectrometry. Addressing this issue necessitates the development of an in-source dissociation device with tunable energy. The utilization of pulsed lasers in surface-assisted laser desorption/ionization (SALDI) and matrix-assisted laser desorption/ionization (MALDI) has demonstrated the importance of pulse systems in regulating laser energy [47,48]. This regulation effectively limits energy deposition and reduces collateral thermal damage. Inspired by these approaches, we converted the conventional continuous arc to a pulsed arc to control the arc plasma voltage and tune the arc plasma energy. This modification helps reduce high energy levels and thermal accumulation within the arc plasma. Consequently, the application of pulsed arc plasma facilitates in-source dissociation of compounds at varying energy levels.
In this study, we have introduced a rapid arc plasma energy modulation system, culminating in the development of the tunable pulsed arc plasma (TPAP) ionization and dissociation device. The TPAP ionization function displays remarkable linearity, sensitivity, and resistance to matrix effects as an ion source. Additionally, the TPAP dissociation feature exhibits unique fragmentation capabilities under various voltage conditions. By programmatically controlling the TPAP voltage, the scanning of compounds at different plasma energies has been achieved. Validation experiments with disubstituted benzene species, chlorogenic acid derivatives, disaccharide and diacylglycerol demonstrated clear isomeric differentiation through specific energy-resolved in-source dissociation spectra. TPAP-MS facilitates direct analysis and structural annotation of isomers solely through the ion source, independent of the mass spectrometer. This versatile technique accommodates a wide range of compounds, demonstrating significant potential for broad applications.
A schematic diagram and photograph of the TPAP-MS are included in Fig. 1. The TPAP device, positioned in front of the MS inlet, consists of a sprayer and a pulsed arc device, with two metal needles functioning as the cathode and anode. The power for the tunable pulsed arc device, ranging from 0 to 60 V, is supplied by a high-precision DC source. This voltage is subsequently elevated to 7500 V by a pulsed arc boost module (Fig. S1 in Supporting information) to generate an arc discharge between the electrodes, with atmospheric air serving as the discharge gas. Samples are introduced into the arc plasma region via an electrospray ionization (ESI) sprayer, which operates at high voltage of 4000 V. Notably, d1 denotes the distance from the end of the sprayer capillary to the center point of the plasma region, d2 denotes the distance between the electrodes, and d3 denotes the distance between the center point of the plasma region and the MS inlet. The pulsed arc boost module was custom-made and acquired from Guangao Electronic Technology Co., Ltd. (Henan, China). The high-precision DC power source was obtained from BuFan Electronics Co., Ltd. (Guangdong, China) and the sprayer was supplied by Thermo Fisher Scientific (Waltham, MA, USA).
Methanol (HPLC-grade) and acetonitrile (HPLC-grade) were purchased from Merck (Darmstadt, Germany). Diethyl maleate, diethyl fumarate, cryptochlorogenic acid, ortho-, meta-, and para-dichlorobenzene were purchased from Aladdin (Shanghai, China). Methyl salicylate and anthracene were purchased from J&K (Shanghai, China). Triethyl phosphate, chlorogenic acid, ortho- and para-benzenediol were purchased from Innochem (Shanghai, China). Neochlorogenic acid, ortho-, meta-, and para-xylene were purchased from TCI (Shanghai, China). All chemicals were used directly without further purification.
The MS experiments, including tandem mass spectrometry, were carried out on a TSQ Quantum Access triple-quadrupole mass spectrometer (Thermo Fisher Scientific, Waltham, MA). Full-scan MS mode was carried out with the following parameters: vacuum at 2.8 × 10⁻⁶ Torr; spray voltage at ±4000 V; capillary temperature set to 190 ℃; scan time of 0.5 s; Q1 width of 0.7 Da; tube lens set at 90 V. Data acquisition and analysis were carried out with the Xcalibur software package (Version 2.0, Thermo Fisher Scientific). The data were evaluated with Originlab Origin (2023). A weighted least-squares linear regression (1/X weighting) was used for linear fitting.
The electric arc serves as a versatile ionization method for MS analysis, and the APD device efficiently performs fingerprinting mass spectrometric analysis at atmospheric pressure. Sample fragmentation occurs due to the high temperature, energy, and reactivity of the arc plasma. Previous techniques using continuous arcs generated significant heat and displayed limited variability in fragment ion abundance across different arc voltages. Drawing inspiration from the conversion of continuous to pulsed lasers to minimize thermal effects, efforts were made to transform a continuous arc into a pulsed one. This transformation aimed to lower the temperature of the arc, reduce in-source dissociation due to heat, and regulate the abundance of fragment ions predominantly by the energy of the arc plasma. Incorporating a capacitor into the APD enabled the conversion of a continuous arc into an intermittent pulsed arc, changing the plasma color from purple to bright white (Fig. S2 in Supporting information). This change was observable in the discharge waveform on an oscilloscope, transitioning from continuous to pulsed discharge. The frequency of the pulsed arc plasma (PAP) discharge varies between 170 Hz and 350 Hz, depending on the PAP voltage (Figs. S3 and S4 in Supporting information). PAP generates less heat than continuous arc plasma and does not reach the ignition point of conventional solvents, thus avoiding solvent ignition during the introduction of liquid samples (Fig. S5 and video S1 in Supporting information). Additionally, the unique characteristics of pulse discharge prevent continuous ionization of the surrounding air, maintaining an unaffected discharge state despite airflow variations (Fig. S6 and Video S1 in Supporting information). The unique physical properties of pulsed arc plasma result in different ionization performance compared to non-pulsed arc, enhancing the versatility of the ionization process (Fig. S7 in Supporting information). When utilized as an ion source, the pulsed arc plasma ionization exhibits versatility in analyzing compounds with a broad range of polarities in both positive and negative ion modes (Fig. S8 in Supporting information). Additionally, it can be integrated with various sample introduction devices, including gas pipelines, tweezers, filter papers, and ultrasonic atomizers, facilitating rapid detection of gas, solid, liquid, and dired spot samples, thereby demonstrating robust ambient analysis capabilities (Figs. S9-S12 in Supporting information).
In the initial experiment, a diethyl maleate acetonitrile solution (10 µg/mL) was directly sampled using the TPAP ionization and dissociation device equipped with a glass sample rod. When the PAP voltage is set at 7500 V, the primary mass spectrum of diethyl maleate exhibits a high abundance of fragment ion signals. Notably, the [M-C2H6O+H]+ ion (m/z 127) shows a relative abundance of 57.0%, while the [M-C4H10O+H]+ ion (m/z 99) has a relative abundance of 38.5% (Fig. 2a). Upon reducing the PAP voltage to 5700 V, there is a significant decrease in the abundance of these fragments. The relative abundance of [M-C2H6O+H]+ (m/z 127) drops to 20.9%, and that of [M-C4H10O+H]+ (m/z 99) falls to 18.2% (Fig. 2b). These fragments were identified as derivatives of diethyl maleate, confirmed by tandem MS spectra (Fig. S13 in Supporting information). In contrast, continuous arc plasma-based dissociation showed consistent fragment abundance across various voltages (Fig. S14 in Supporting information). Transitioning from continuous to pulsed arc and adjusting the PAP voltage demonstrated the potential to regulate fragment abundance and obtain energy-resolved spectra at different PAP voltages.
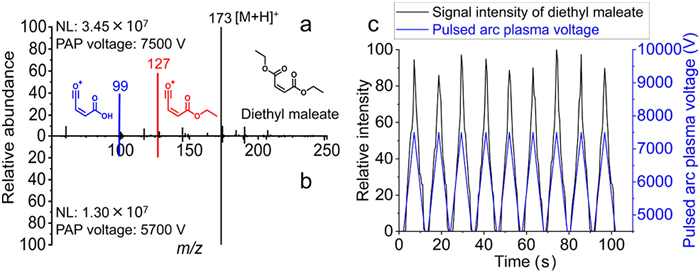
Glass rods utilized for direct sampling are effective for qualitative analysis but pose challenges in precisely controlling the sampling volume for quantitative analysis. Continuous arc plasma is sensitive to the surrounding gas environment, where the stability can be significantly affected by nebulizer gas flow, potentially extinguishing the arcs with excessive airflow. In contrast, pulsed arc plasma discharges instantaneously without continuous ionization of the surrounding gas, making it less susceptible to variations in gas flow. This feature makes pulsed arc plasma ideal for integration with a sprayer, leading to the development of tunable pulsed arc plasma ionization mass spectrometry (TPAP-MS). The in-source dissociation spectra of diethyl maleate, obtained by TPAP-MS at various PAP voltages, are depicted in Fig. S15 (Supporting information). It is evident that the degree of fragmentation of the compound varies with the voltage in TPAP-MS. Analysis of nonivamide indicates that further reduction of the PAP voltage can lower the fragmentation level to that of ESI. Additionally, the involvement of plasma significantly decreases the signal of alkali metal adduct ions, revealing that pulsed arc plasma facilitates the secondary ionization of ESI (Fig. S16 in Supporting information). By employing the flow injection method, in-source dissociation spectra of compounds at various PAP voltages can be obtained in a single injection, which facilitates the rapid construction of compound-specific, energy-resolved dissociation spectra. A dedicated program controls the power supply voltage and modulates the PAP voltage. Cyclic scanning of the sample at varying tunable PAP energies is achieved by adjusting the scan time of the mass spectrometer and altering the PAP voltage during data acquisition (Fig. S17 in Supporting information). Using this method, a corresponding mass spectrum is obtained at each voltage level, enabling the continuous recording of the dissociation behavior of compounds at different voltages. Fig. 2c illustrates the total ion current of diethyl maleate (black) alongside the changes in PAP voltage (blue) during the TPAP-MS scanning cycle. A clear correlation is observed where the signal intensity increases with rising PAP voltage and decreases when the voltage is reduced, highlighting the capability of TPAP-MS to rapidly acquire mass spectra at various voltage levels within a single scanning cycle. Subsequent data processing, which includes normalizing mass spectrometry data and analyzing the trend of ion normalized abundance with voltage changes, is employed to construct compound-specific energy-resolved spectra.
In the energy-resolved spectra, the x-axis represents the PAP voltage, and the y-axis indicates normalized peak abundance. Normalization rescales the maximum intensity of each signal to a specific value, typically between 0 and 1. The normalization formula, described in Eq. 1, involves dividing the signal intensity of the characteristic peak by the Euclidean norm of the spectrum (Eq. 1).
|
|
(1) |
In Eq. 1 v represents the original mass spectrometry data vector, vi is the signal intensity of peak i. ||v|| represents the norm of vector v.
The TPAP-MS workflow for acquiring energy-resolved spectra involves: (ⅰ) Introducing the sample solution into the sprayer; (ⅱ) Synchronizing PAP voltage changes with mass spectrometry scanning intervals through programmed adjustments, (ⅲ) Simultaneously activating the TPAP device and starting mass spectrometry acquisition; (ⅳ) Passing the sample through the sprayer into the pulsed arc plasma region for further ionization and dissociation; (ⅴ) Evaluating response values for ion peaks at various PAP voltages to create energy-resolved spectra for the target peak.
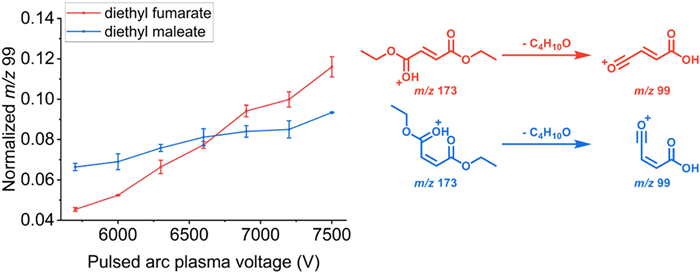
Using the cis-trans isomers of diethyl maleate and diethyl fumarate as examples, energy-resolved spectra of characteristic fragments (m/z 99) common to both compounds were obtained (Fig. 3). The PAP voltage was progressively increased from 5700 V to 7500 V in increments of 300 V. Below 5700 V, no pulsed arc discharge occurred between the electrodes, and the applied potential caused ion deflection, affecting detection results. Starting at 5700 V, pulsed arc plasma generation began. This instantaneous discharge eliminated the high potential on the electrodes, enabling ions to traverse the plasma region. The energy-resolved spectrum of diethyl maleate (blue curve in Fig. 3) showed an increase in the abundance of [M-C4H10O+H]+ (m/z 99) with increasing PAP voltage. The energy-resolved spectrum of diethyl fumarate exhibited distinct spectral differences (red curve in Fig. 3), illustrating the capacity of TPAP-MS to generate specific energy-resolved spectra for different compounds.
The root mean square error (RMSE) was utilized to evaluate the dissimilarity between the spectra of isomers, as described by Eq. 2:
|
|
(2) |
In Eq. 2, n represents the number of data plots in the energy-resolved spectra, ai and bi denote the normalized value of fragments from two isomers. Lower RMSE values suggest greater similarity between spectra, whereas higher values indicate increased dissimilarity. For the fragments (m/z 99) of diethyl maleate, the average RMSE, calculated from nine parallel tests, was 5.24 × 10⁻³ (Table S1 in Supporting information). For diethyl fumarate, the average RMSE was 3.55 × 10⁻³ (Table S2 in Supporting information). In comparison, the RMSE between the energy-resolved spectra of the two isomers was 1.54 × 10⁻², which is higher than that observed in parallel tests. This result highlights the effectiveness of RMSE as a precise metric for evaluating isomer differentiation performance in TPAP-MS.
A series of experiments was conducted to optimize the TPAP-MS for high sensitivity and repeatability. It was observed that the abundance of fragments correlated with the pulsed arc plasma energy, exhibiting variable dissociation ratios among different compounds. Consequently, the parameter optimization focused on maximizing signal intensity rather than fragment abundance. Diethyl maleate (10 µg/mL in acetonitrile) served as the test sample, with parameter optimization assessed by measuring the signal intensity of the protonated molecular ion peak (m/z 173).
The relative positions of the pulsed arc plasma, sprayer, and MS inlet are critical for signal intensity modulation. As shown in Figs. 4a and b, optimal signals were achieved when the distance between the pulsed arc plasma region and the sprayer was 13 mm (d1 in Fig. 1a), and 9 mm between the pulsed arc plasma region and the MS inlet (d3 in Fig. 1a). Deviating from these optimal distances, whether too long or too short, impacts ion transport efficiency. Furthermore, maintaining these distances helps mitigate the risk of unintended arc discharges with other system components.

The distance between electrodes (d2 in Fig. 1a) significantly affects signal intensity and arc stability [46]. In TPAP-MS, a shorter electrode distance results in a smaller pulsed arc plasma region, limiting contact between ions and plasma and thereby reducing signal intensity (Fig. 4c). As the distance between electrodes increases, the signal intensity gradually rises, peaking at 7 mm. However, excessive distances compromise both arc stability and signal intensity. The optimal electrode distance, which balances stability, signal intensity, and safety, has been determined to be 7 mm. Crucially, the electrode distance also affects the minimum voltage required for pulsed arc plasma generation, necessitating strict maintenance of this distance throughout the experiments.
The impact of spray voltage on signal intensity and fragmentation was explored, revealing that higher spray voltages increased signal intensity (Fig. 4d). Further analysis of the normalized intensity of fragments (m/z 127 and m/z 99) at various spray voltages showed minimal effects on compound fragmentation (Figs. S18 and S19 in Supporting information). Given the risks associated with higher voltages, 4000 V was established as the optimal spray voltage. A comprehensive optimization of parameters, including sample flow rate, nebulizer gas pressure, and capillary temperature, was conducted. The optimized conditions for the TPAP-MS method are detailed in the supporting information (Figs. S20-S22 and Table S3 in Supporting information).
The scanning mode of TPAP-MS allows for the rapid acquisition of energy-resolved spectra, typically within a timeframe of < 7 min (25 rounds of scans). Diethyl maleate was analyzed six times across varying voltages between 6000 V and 7500 V. The relative standard deviation (RSD) for the signal intensity of the protonated molecular ion ([M + H]+, m/z 173) ranged from 1.3% to 4.3%. Consistency in dissociation capability was confirmed by detecting fragments (m/z 127 and m/z 99 for diethyl maleate) three times within one day and over three consecutive days. The intra-day and inter-day precision of fragment ion abundance at various pulsed arc plasma voltages ranged from 0.28% to 5.70% and 1.60% to 7.97%, respectively (Table S4 in Supporting information), indicating high repeatability and robustness of the TPAP-MS method.
Furthermore, TPAP-MS exhibits good linearity, reduced matrix effects, and low limits of detection. Linearity was evaluated by analyzing methyl salicylate at different concentrations in acetonitrile under a PAP voltage of 7500 V, resulting in an R2 > 0.99 (Fig. S23 in Supporting information). Matrix effects were evaluated by spiking methyl salicylate into two different matrix solutions with distinct polarities: one with triethyl phosphate and another with anthracene, resulting in matrix effects of −11.5% and −2.9%, respectively (Figs. S24 and S25 in Supporting information). TPAP-MS showed reduced matrix effects compared to ESI-MS (Tables S5 and S6 in Supporting information). This reduction in matrix effects can be attributed to the unique ionization environment provided by the arc plasma, which facilitates secondary ionization of the electrospray, thereby enhancing ionization efficiency and mitigating cluster formation (Figs. S26 and S27 in Supporting information). The limit of detection was determined to be below 1 µg/mL, underscoring the high sensitivity of TPAP-MS.
Differentiating structural isomers of disubstituted benzenes, such as xylenes, poses a significant challenge in conventional mass spectrometric methods. In TPAP-MS, xylenes—specifically ortho-xylene, meta-xylene, and para-xylene—primarily form the molecular ion [C8H10]•+ (m/z 106) through electron loss. The tandem mass spectra of these xylene isomers typically display a common fragment at m/z 91, which results from the loss of a methyl radical from the precursor ion [M]•+ (Fig. S28 in Supporting information). These spectra exhibit high similarity, complicating differentiation. Using TPAP-MS, fragments at m/z 91 were detected in the full scan mass spectrometry of the three isomers. By adjusting the PAP voltage from 5700 V to 7500 V, the recording of normalized intensity variations of these fragments was facilitated, enabling the acquisition of energy-resolved spectra.
Fig. 5a displays the energy-resolved spectra of the fragment (m/z 91) for ortho-xylene (green), meta-xylene (red), and para-xylene (blue). The results demonstrate an increase in fragment abundance for all three isomers with rising PAP voltage, with ortho-xylene notably showing higher fragment abundance than the others, while para-xylene exhibits greater fragment abundance than meta-xylene. This observation suggests that fragment abundance results from a combination of multiple factors, not solely from steric effects. RMSE values derived from parallel experiments with ortho-, meta-, and para-xylene were 5.23 × 10⁻³, 2.18 × 10⁻³, and 5.44 × 10⁻³, respectively. Notably, the RMSE values between ortho-xylene and meta-xylene was 2.11 × 10⁻¹, and between ortho-xylene and para-xylene was 1.68 × 10⁻¹, indicating significant dissimilarities. The RMSE between meta-xylene and para-xylene was 4.40 × 10⁻², higher than those obtained in parallel experiments, confirming the distinguishability of the three isomers by TPAP-MS (Table S7 in Supporting information).
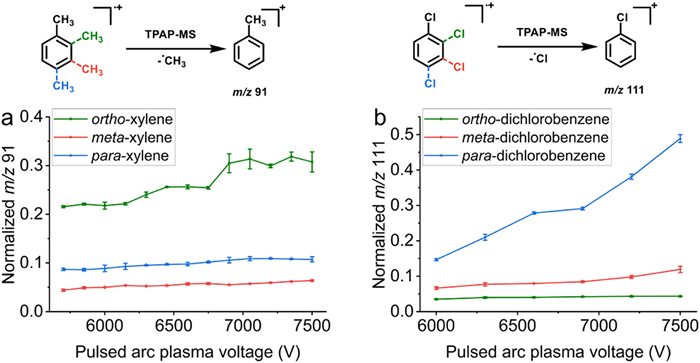
Furthermore, an attempt was made to analyze the isomers of dichlorobenzene utilizing TPAP-MS. In Fig. 5b, the energy-resolved spectra of fragments (m/z 111), resulting from the loss of a chlorine radical from the molecular ion, are depicted for ortho-dichlorobenzene (green), meta-dichlorobenzene (red), and para-dichlorobenzene (blue). It is shown that para-dichlorobenzene exhibits higher fragment abundance than the other isomers, with a more pronounced increase. Ortho-dichlorobenzene displays comparatively lower fragment abundance, and the changes induced by the pulsed arc plasma voltage are relatively small. The distinct distribution of substituents in the three isomers leads to variations in electron density and charge distributions during the dissociation process. These variations significantly influence the behavior of each isomer during dissociation within the TPAP source. The RMSE calculations revealed differences between the energy-resolved spectra of the different isomers. The RMSE values between ortho- and meta-dichlorobenzene, ortho- and para-dichlorobenzene, and meta- and para-dichlorobenzene are 4.91 × 10⁻², 2.81 × 10⁻¹, and 2.32 × 10⁻¹, respectively. These values are markedly higher compared to the RMSE values obtained from parallel experiments of individual isomers, which are 2.00 × 10⁻³ for ortho-dichlorobenzene, 6.45 × 10⁻³ for meta-dichlorobenzene, and 6.49 × 10⁻³ for para-dichlorobenzene (Table S8 in Supporting information).
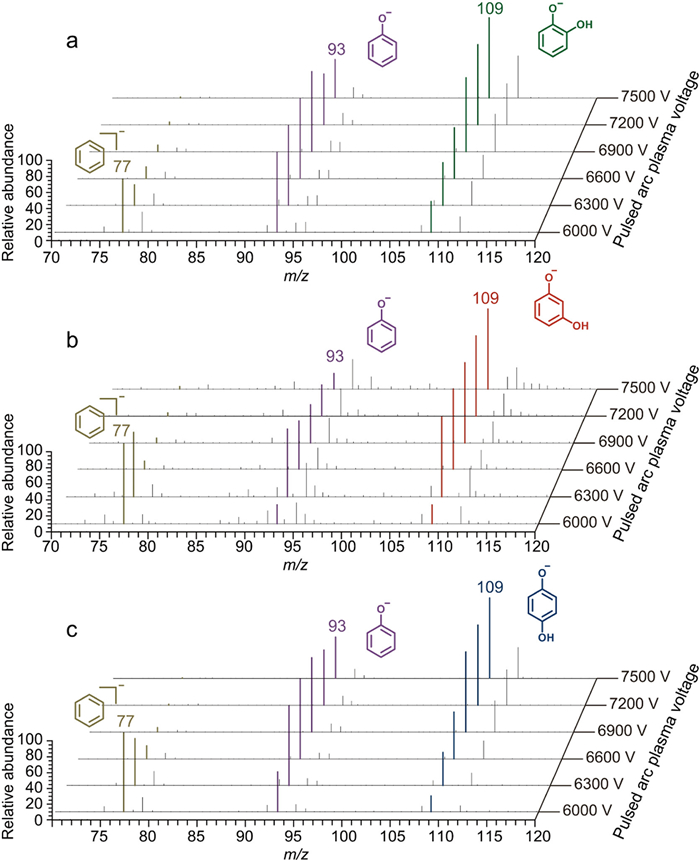
Certainly, TPAP-MS facilitates the construction of energy-resolved spectra for compounds yielding strong signals in negative ion mode, such as benzenediol. Under pulsed arc conditions, benzenediol primarily generates fragments [M-O-H]− (m/z 93) and [M-2O-H]− (m/z 77). For the fragment resulting from the loss of one oxygen atom ([M-O-H]-, m/z 93), its normalized abundance initially increases and then decreases as the PAP voltage rises. The fragment ion abundances of ortho- and para-benzenediol are higher than that of meta-benzenediol (Fig. S29 in Supporting information). For the fragment resulting from the loss of two oxygen atoms ([M-2O-H]-, m/z 77), its normalized abundance rapidly decreases with increasing PAP voltage. The three isomers exhibit similar descending trends, with abundances ranking from high to low as meta-, para-, and ortho-benzenediol (Fig. S30 in Supporting information). Although RMSE can quantify the differences among the three isomers for differentiation (Table S9 in Supporting information), a more comprehensive approach involves constructing three-dimensional energy-resolved spectra based on mass-to-charge ratio, signal abundance, and pulsed arc plasma voltage. The spectra, illustrated in Fig. 6, reveal varying trends for two different fragments within a single spectrum, providing detailed insights for isomer annotation. For three-dimensional data analysis, it is essential to ensure a one-to-one correspondence between the data points being compared. The differences between each data point can then be calculated, and the RMSE can also be determined to differentiate the three isomers (Table S10 in Supporting information).
Chlorogenic acids are common in the human diet and are purported to possess a variety of health benefits [49], including antioxidant [50,51], anti-inflammatory properties [52], and the ability to inhibit carcinogenesis [53]. Among these, 5-O-caffeoylquinic acid (5-CQA; commonly known as chlorogenic acid) is the most prevalent form, with other isomers such as 3-O-caffeoylquinic acid (3-CQA; neochlorogenic acid) and 4-O-caffeoylquinic acid (4-CQA; cryptochlorogenic acid) also found in plants. Given the successful differentiation of chlorogenic acid isomers achieved by ER-MS, the potential for isomeric differentiation using TPAP-MS was assessed through the analysis of chlorogenic acid, neochlorogenic acid, and cryptochlorogenic acid.
TPAP-MS was utilized to analyze the three mono-caffeoylquinic acid isomers. Signals at m/z 191, generated from the α-cleavage of the ester group, were employed to construct the energy-resolved in-source dissociation spectra for the fragment m/z 191 (Fig. 7a). A distinctive pattern was observed for chlorogenic acid compared to the other two isomers, with a higher fragment abundance noted for neochlorogenic acid compared to cryptochlorogenic acid. RMSE calculations effectively differentiated among the three isomers, with RMSE values between different isomers being an order of magnitude higher than those obtained from parallel experiments with the compounds (Table S11 in Supporting information). Energy-resolved spectra could also be constructed using deprotonated molecular ions ([M-H]− m/z 353), revealing significant differences between the isomers, with the normalized signal intensity rankings consistent with existing reports (Fig. 7b). The distinct curves and RMSE obtained for these three isomers highlight their potential for isometric discrimination.
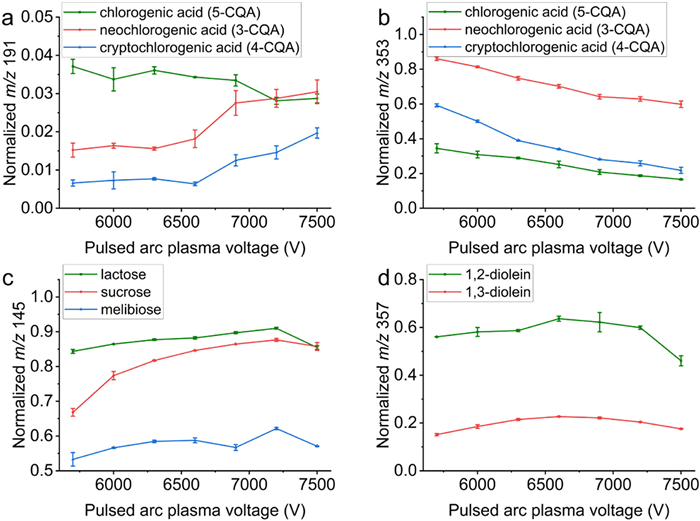
To validate the general applicability of TPAP-MS, the method was further verified for distinguishing disaccharide and diglyceride isomers. For disaccharides such as lactose, sucrose, and melibiose, the energy-resolved spectra of fragments (m/z 145) are shown in Fig. 7c. Notably, melibiose exhibits a lower fragment abundance compared to lactose and sucrose, suggesting a greater challenge in dissociating the 1, 6-glycosidic bond under TPAP-MS conditions. The distinct trends in three spectra were quantitatively analyzed using RMSE (Table S12 in Supporting information).
Glycerolipids are a common lipid subclass formed by esterifying fatty acid chains to one or more of the three glycerol hydroxyls, resulting in sn-isomers. TPAP-MS was employed to analyze the sn-isomers of glycerol dioleate. The energy-resolved spectra revealed that both 1, 2-diolein and 1, 3-diolein display an initial increase followed by a decrease in fragment abundance. The fragment resulting from the ester bond cleavage in 1, 2-diolein (m/z 357) shows higher abundance than in 1, 3-diolein, which attributed to the steric hindrance from the two side chains in 1, 2-diolein (Fig. 7d). The difference between sn-isomers was further quantified using RMSE calculations (Table S13 in Supporting information).
Structural differentiation of isomers remains challenging due to their similar MS/MS spectra. Therefore, acquiring more structurally relevant information from various perspectives is crucial. In this study, we integrated a pulse system into the arc plasma ionization and dissociation device. This innovation reduced the arc temperature and enabled precise control of plasma energy, resulting in a combined setup with the electrospray ionization source, culminating in the development of a TPAP device. By programmatically controlling the pulsed arc plasma voltage, we facilitated compound scanning at varied dissociation energies, swiftly generating both two-dimensional (2D) energy-resolved spectra for specific ions and three-dimensional (3D) spectra for in-source dissociation. This approach effectively correlates energy-resolved in-source dissociation spectra with compound structures. Validation with representative chemical families underscored the capability of TPAP-MS for structural isomer analysis. Furthermore, root mean square error (RMSE) calculations were utilized to provide annotations for isomeric differentiation. Compared with previous methods, TPAP-MS offers distinct advantages such as simplicity, rapidity, independence from collision cells, and compatibility with diverse compounds. The use of energy-resolved spectra serves as compelling evidence, advancing isomeric differentiation and enhancing the potential for structural analysis. While TPAP-MS is effective for differentiating isomers by comparing energy-resolved in-source dissociation spectra with reference spectra of known structures, the complexity of plasma dissociation processes poses challenges in predicting molecular structures solely through computational means.
The authors declare that they have no known competing financial interests or personal relationships that could have appeared to influence the work reported in this paper.
Ming-Mai Bao: Writing – original draft, Validation, Methodology, Investigation, Formal analysis, Data curation, Conceptualization. Ying-Chao Liu: Writing – original draft, Investigation, Formal analysis, Data curation. Hao-Nan Xu: Software, Data curation. Jing Zhang: Supervision, Software, Funding acquisition. Yin-Long Guo: Writing – original draft, Supervision, Funding acquisition.
Financial support was provided by the National Key Research and Development Program of China (No. 2021YFF0701900), Shanghai Science and Technology Innovation Action Plan (No. 21142200800), Strategic Priority Research Program of the Chinese Academy of Sciences (No. XDB0610000), and the Program of EnShi TuJia & Miao Autonomous Prefecture Bureau of Scientific & Technological Affairs.
Supplementary material associated with this article can be found, in the online version, at doi:
Q. Wu, J.Y. Wang, D.Q. Han, et al., TrAC, Trends Anal. Chem. 124 (2020) 115801. doi: 10.1016/j.trac.2019.115801
R. March, J. Brodbelt, J. Mass Spectrom. 43 (2008) 1581–1617. doi: 10.1002/jms.1480
R.N. Pribble, C. Gruenloh, T.S. Zwier, Chem. Phys. Lett. 262 (1996) 627–632. doi: 10.1016/S0009-2614(96)01134-7
T.M. Selby, W.L. Meerts, T.S. Zwier, J. Phys. Chem. A 111 (2007) 3697–3709. doi: 10.1021/jp068275+
J.A.G. Roach, M.M. Mossoba, M.P. Yurawecz, et al., Anal. Chim. Acta 465 (2002) 207–226. doi: 10.1016/S0003-2670(02)00193-9
S.H. Hansen, I. Bjørnsdottir, J. Tjørnelund, J. Chromatogr. A 792 (1997) 49–55. doi: 10.1016/S0021-9673(97)00846-7
J. Khandurina, A. Guttman, Chromatographia 62 (2005) S37–S41. doi: 10.1365/s10337-005-0606-8
R.G. Cooks, J. Mass Spectrom. 30 (1995) 1215–1221. doi: 10.1002/jms.1190300902
R.A. Zubarev, N.L. Kelleher, F.W. McLafferty, J. Am. Chem. Soc. 120 (1998) 3265–3266. doi: 10.1021/ja973478k
M.R.L. Paine, B.L.J. Poad, G.B. Eijkel, et al., Angew. Chem. Int. Ed. 57 (2018) 10530–10534. doi: 10.1002/anie.201802937
J. Hofmann, H.S. Hahm, P.H. Seeberger, et al., Nature 526 (2015) 241–244. doi: 10.1038/nature15388
F. Zhang, S. Guo, M. Zhang, et al., J. Mass Spectrom. 50 (2015) 906–913. doi: 10.1002/jms.3600
T.G. Flick, I.D.G. Campuzano, M.D. Bartberger, Anal. Chem. 87 (2015) 3300–3307. doi: 10.1021/ac5043285
A.J. Creese, J. Smart, H.J. Cooper, Anal. Chem. 85 (2013) 4836–4843. doi: 10.1021/ac400646m
K.L. Arthur, M.A. Turner, A.D. Brailsford, et al., Anal. Chem. 89 (2017) 7431–7437. doi: 10.1021/acs.analchem.7b00940
J. Far, C. Delvaux, C. Kune, et al., Anal. Chem. 86 (2014) 11246–11254. doi: 10.1021/ac503142u
S. Lee, S.J. Valentine, J.P. Reilly, et al., Int. J. Mass Spectrom. 309 (2012) 161–167. doi: 10.1016/j.ijms.2011.09.013
H. Yang, L. Shi, X. Zhuang, et al., Sci. Rep. 6 (2016) 28079. doi: 10.1038/srep28079
D.D. Fetterolf, R.A. Yost, Int. J. Mass Spectrom. 44 (1982) 37–50.
S.P. Menachery, O. Laprevote, T.P. Nguyen, et al., J. Mass Spectrom. 50 (2015) 944–950. doi: 10.1002/jms.3607
T. Murakami, Y. Iwamuro, R. Ishimaru, et al., J. Mass Spectrom. 54 (2019) 205–212. doi: 10.1002/jms.4316
J. Hernandez, A. Müller, R. Jaiswal, et al., Phytochem. Anal. 29 (2018) 406–412. doi: 10.1002/pca.2770
K. Zhang, W. Liu, Q. Song, et al., Anal. Chem. 93 (2021) 2541–2550. doi: 10.1021/acs.analchem.0c04602
W. Liu, Q. Song, Y. Yan, et al., J. Chromatogr. A 1561 (2018) 56–66. doi: 10.1016/j.chroma.2018.05.045
Y. Song, Q. Song, W. Liu, et al., TrAC, Trends Anal. Chem. 160 (2023) 116982. doi: 10.1016/j.trac.2023.116982
H.C. Chao, S.A. McLuckey, TrAC, Trends Anal. Chem. 158 (2023) 116852. doi: 10.1016/j.trac.2022.116852
Y. Cao, C. Chai, A. Chang, et al., J. Chromatogr. A 1609 (2020) 460515. doi: 10.1016/j.chroma.2019.460515
J.T. Davidson, Z.J. Sasiene, G.P. Jackson, J. Mass Spectrom. 56 (2021) e4679. doi: 10.1002/jms.4679
V. Katta, S.K. Chowdhury, B.T. Chait, Anal. Chem. 63 (1991) 174–178. doi: 10.1021/ac00002a016
A.G. Harrison, A.B. Young, Int. J. Mass Spectrom. 255-256 (2006) 111–122.
M.J. Huddleston, M.F. Bean, S.A. Carr, Anal. Chem. 65 (1993) 877–884. doi: 10.1021/ac00055a009
A.D. Lesiak, R.A. Musah, R.B. Cody, et al., Analyst 138 (2013) 3424–3432. doi: 10.1039/c3an00360d
E. Sisco, J. Verkouteren, J. Staymates, et al., Forensic Chem. 4 (2017) 108–115. doi: 10.1016/j.forc.2017.04.001
M.J. Bogusz, R.D. Maier, K.D. Krüger, et al., J. Chromatogr. A 844 (1999) 409–418. doi: 10.1016/S0021-9673(99)00312-X
R.B. Cody, J.A. Laramée, H.D. Durst, Anal. Chem. 77 (2005) 2297–2302. doi: 10.1021/ac050162j
N. Na, M. Zhao, S. Zhang, et al., J. Am. Soc. Mass Spectrom. 18 (2007) 1859–1862. doi: 10.1016/j.jasms.2007.07.027
S. Brandt, F.D. Klute, A. Schütz, et al., Anal. Chem. 90 (2018) 10111–10116. doi: 10.1021/acs.analchem.8b01493
D. Foest, A. Knodel, R. Ahrends, et al., Anal. Chem. 95 (2023) 8423–8432. doi: 10.1021/acs.analchem.2c04052
Y. Gao, Y. Liu, X. Li, et al., J. Chromatogr. A 1716 (2024) 464663. doi: 10.1016/j.chroma.2024.464663
Y. Gao, F. Chu, W. Chen, et al., Anal. Chem. 94 (2022) 5463–5468. doi: 10.1021/acs.analchem.1c05650
Y. Gao, Y. Li, B. Zhan, et al., Analyst 146 (2021) 5682–5690. doi: 10.1039/D1AN00872B
N. Aminlashgari, M. Becerra, M. Hakkarainen, J. Phys. D: Appl. Phys. 49 (2016) 055502. doi: 10.1088/0022-3727/49/5/055502
S. Zhu, B. Zhou, L. Zhang, et al., Anal. Chem. 93 (2021) 12480–12486. doi: 10.1021/acs.analchem.1c02904
Y. Gao, M. Zhang, H. Feng, et al., Anal. Chem. 96 (2024) 6106–6111. doi: 10.1021/acs.analchem.3c05861
K. Huang, H. Zeng, X. Li, et al., Anal. Chem. 96 (2024) 317–324.
S. Zhu, L. Zhang, J. Zhang, et al., Anal. Chem. 92 (2020) 14633–14639. doi: 10.1021/acs.analchem.0c03127
S.S. Alimpiev, A.A. Grechnikov, S.M. Nikiforov, Phys. -Usp 58 (2015) 191–195. doi: 10.3367/UFNe.0185.201502f.0207
S.J.P. Marlton, A.J. Trevitt, Chem. Commun. 58 (2022) 9451–9467.
J.L. Willems, M.M. Khamis, W.M. Saeid, et al., Anal. Chim. Acta 933 (2016) 164–174. doi: 10.1016/j.aca.2016.05.041
Y. Kono, K. Kobayashi, S. Tagawa, et al., BBA-Gen. Subj. 1335 (1997) 335–342.
M.H. Kweon, H.J. Hwang, H.C. Sung, J. Agric. Food Chem. 49 (2001) 4646–4655.
M.D. dos Santos, M.C. Almeida, N.P. Lopes, et al., Biol. Pharm. Bull. 29 (2006) 2236–2240.
H. Kasai, S. Fukada, Z. Yamaizumi, et al., Food Chem. Toxicol. 38 (2000) 467–471.

Figure 2 Mass spectra of diethyl maleate (10 µg/mL in acetonitrile) obtained by pulsed arc plasma ionization at (a) 7500 V arc voltage and (b) 5700 V arc voltage. (c) The total ion current curve (black) of diethyl maleate obtained by TPAP-MS and the change of pulsed arc plasma voltage (blue) over nine scanning cycles.

Figure 3 Energy-resolved spectra of fragments (m/z 99) of diethyl fumarate (red) and diethyl maleate (blue) measured at 5700–7500 V pulsed arc plasma voltage.

Figure 4 Optimization of the TPAP-MS parameters to achieve a higher signal intensity of protonated molecular ions of diethyl maleate (m/z 173): (a) Distance between sprayer and pulsed arc plasma region (d1), (b) distance between pulsed arc plasma region and MS inlet (d3), (c) distance between the electrodes (d2) and (d) the spray voltage.

Figure 5 Energy-resolved spectra of (a) the fragments (m/z 91) for ortho-xylene (green), meta-xylene (red), and para-xylene (blue) measured at pulsed arc plasma voltages across 5700–7500 V, (b) the fragments (m/z 111) for ortho-dichlorobenzene (green), meta-dichlorobenzene (red), and para-dichlorobenzene (blue) measured at pulsed arc plasma voltages across 6000–7500 V.

Figure 6 3D energy-resolved spectra for (a) ortho-benzenediol and (b) meta-benzenediol and (c) para-benzenediol measured across pulsed arc plasma voltage of 6000–7500 V.

Figure 7 Energy-resolved spectra of the (a) fragments (m/z 191) and (b) deprotonated molecular ion (m/z 353) for chlorogenic acid (green), neochlorogenic acid (red), and cryptochlorogenic acid (blue); (c) fragments (m/z 145) for lactose (green), sucrose (red), and melibiose (blue); (d) fragments (m/z 357) for 1, 2-diolein (green) and 1, 3-diolein (red) measured at pulsed arc plasma voltages of 5700–7500 V in negative mode.

 扫一扫看文章

扫一扫关注我们
 DownLoad:

 下载:
下载:
 下载:
下载: