Table 1.
Physicochemical properties of selected ATDs.
Citation:
Chaofan Zhang, Hongyu Dong, Xueyang Zhao, Cheng Fang, Yanbin Tong, Junfeng Niu. Research progress on the evolution of antidepressant-type pollutants during biological treatment of municipal wastewater[J]. Chinese Chemical Letters,
2026, 37(6): 112038.
doi:
10.1016/j.cclet.2025.112038

Research progress on the evolution of antidepressant-type pollutants during biological treatment of municipal wastewater
English
Research progress on the evolution of antidepressant-type pollutants during biological treatment of municipal wastewater
Abstract:
Antidepressants (ATDs) have negative impacts on the ecosystem and have been detected globally in concentrations ranging from approximately 0.17 ng/L to 4237 ng/L in municipal wastewater treatment plant influent. However, the removal of ATDs by biological methods is still unsatisfactory at present, due to the extremely complex removal pathway and various removal processes for different ATDs. Therefore, there is an urgent need for a systematic compendium to help people understand the biodegradation process of ATDs. This work provides an overview of the classification, physicochemical properties, and environmental sources of ATDs; systematically reviews the adsorption behaviors and transformation processes of various ATDs during biological treatment; examines the removal efficiency, degradation mechanisms, and critical operating conditions of bioreactors; and discusses the mechanism of ATD adsorption and removal by extracellular polymers secreted by microbial cells during the biological treatment of municipal wastewater. This work clarifies the evolution of different types of ATDs during municipal wastewater biological treatment and proposes future research avenues for the more efficient removal of ATDs.
-
1. Introduction
The increasing prevalence of depression worldwide has led to a higher demand for medication among individuals afflicted with this condition [1–5]. There has been a rise in the global consumption of antidepressants (ATDs) due to the prolonged dosing regimens associated with these medications [4,6–10]. Unfortunately, most of the ingested ATDs will not be absorbed and excreted in the urine and feces as the parents or pharmaceutically active metabolites, which are released along with sewage into municipal wastewater treatment facilities and the aquatic ecosystem [11–15]. Recent studies have demonstrated that conventional wastewater treatment processes do not completely eliminate ATDs, resulting in the persistence of substantial quantities of ATDs and their metabolites in the effluent discharged from wastewater treatment plants [16,17]. For instance, citalopram was found in the effluent of a Brazilian wastewater treatment plant at a concentration up to 1136 ng/L [18]. The presence of incomplete ATDs degradation and their metabolites in wastewater exhibits high biological activity, and the continued presence of these compounds may contribute to the development of tolerance and adaptive responses in aquatic organisms. The prolonged exposure to low levels of such pollutants may impact the growth and reproduction of various aquatic organisms (such as fish and shrimp), disrupt aquatic ecosystems [19], and pose potential threats to non-target organisms and human health [15,20]. Addressing the efficient and environmentally friendly removal of antidepressant-type pollutants from municipal wastewater remains a significant challenge.
Although biological treatment technology is the most widely used method for municipal wastewater treatment, conventional biological treatment is generally ineffective in removing ATDs [12]. Laboratory and pilot studies have indicated that bio-adsorption [21–25] and biodegradation [26,27] are the primary methods for ATDs removal from wastewater. However, biological treatment is an extremely complex system with highly diverse microbial communities and exhibits highly nonlinear characteristics, the pathways and mechanisms of ATD removal in biological treatment systems remain poorly understood to date. In some cases, the concentration of ATDs in the effluent may exceed that in the influent at wastewater treatment plants [16,18,28,29], posing a risk of discharging high levels of ATDs into the environment through sewage and sludge disposal [30]. Some studies on the occurrence and transformation of antidepressants in wastewater treatment plants also revealed negative ATDs removal rates [21,31]. These reports underscore the urgency of a comprehensive understanding of the ATD biological removal process and the influence factors intending to improve the efficiency of ATD removal.
This review intends to provide a comprehensive overview of the research progress on biological ATDs removal in wastewater treatment plants, with the aim of exploring the evolution of antidepressant-type pollutants. The removal of ATDs in the biological wastewater treatment is discussed over the adsorption process, the biodegradation pathway and mechanism, as well as the key influence factors, degradation intermediates and ecotoxicity. This work not only calls for more attention to the antidepressant-type pollutants removal in wastewater treatment, but also proposes more beneficial and systematic sights on the ATDs removal in biological wastewater treatment process.
2. Properties of antidepressants
2.1 Classification of antidepressants
According to the structure and function, ATDs can be classified as selective serotonin reuptake inhibitors (SSRIs), serotonin-norepinephrine reuptake inhibitors (SNRIs), tricyclic antidepressants (TCAs), monoamine oxidase inhibitors (MAOIs), and atypical antidepressants [12,32]. Among these, SSRIs as the most commonly prescribed drugs worldwide are frequently detected in water environments [4,12,31,33,34]. The increased utilization of SSRIs and the imperative for prolonged therapeutic intervention imply their augmented susceptibility to environmental exposure. Some studies have confirmed that SSRIs and their active metabolites are detected in the aquatic environment with significantly higher frequencies and concentrations compared to other types of ATDs [31,35–38].
Given the extensive range of ATDs, some of the most commonly used ATDs were selected as the representative samples for subsequent analysis in this work, considering their usage or severity of the environmental contamination situation. By these means, several common ATDs were preferentially selected for further discussions, such as antidepressants in the SSRIs class: citalopram (CIT), fluoxetine (FLU), sertraline (SER); antidepressants in the SNRIs class: venlafaxine (VEN); and antidepressants in the TCAs class: amitriptyline (AMI).
2.2 Physicochemical properties of antidepressants
The physicochemical properties of ATDs determine their environmental behaviors. The different structures of ATD molecules result in their distinct physicochemical properties, such as solubility, dissociation constants, lipophilicity, and the octanol-water partition coefficient, playing a dominant role in determining their environmental behaviors. The removal pathway of a certain ATD from water— whether through biological (biodegradation) or nonbiological (adsorption, photolysis, volatilization, etc.) processes— is primarily depended on their physicochemical characteristics. It is crucial to have a clear understanding on the physicochemical properties of typical ATDs in order to effectively control their pollution. Detailed information on the physicochemical properties of several common ATDs is presented in Table 1. Most ATDs exhibit lipophilic properties with pKa values ranging from 9.16 to 10.05, which may result in their precipitation from water and subsequent adsorption into the sludge. Common SSRIs typically have relatively high water solubilities and low octanol-water partition coefficients, with logKow values ranging from 1.22 to 1.39. However, they tend to adsorb more easily to particulate matter in soils and sediments, as indicated by logKoc values ranging from 4.17 to 5.63, suggesting that they are persistent in the environment. It is worth mentioning that most of the ATDs display weak alkalinity, existing in water primarily in a neutral form at high pH and in an ionic form at low pH. Consequently, their accumulation in aquatic organisms is influenced by the pH of water, which can result in discrepancies between their expected and actual accumulation, affecting their partitioning behavior and potentially altering their toxicity. A significant future research avenue is the development of methods for the straightforward identification or prediction of the potential states and reactions of ATDs in their environmental context, based on their physicochemical properties, through the application of machine learning.
Table 1

 DownLoad:
CSV
DownLoad:
CSV
Compound CAS Number Structural formula MW pKa LogP logKow logKoc Solubility (mg/mL) Elimination half-life Amitriptyline
(AMI)50-48-6 
277.409 9.49 4.926 4.92 / 9.71e-3 25 h Citalopram
(CIT)59729-33-8 
24.398 9.38 3.76 1.39 5.63 15.46 35 h Fluoxetine
(FLU)54910-89-3 
309.331 10.05 4.05 1.22 4.65 14 1-3 d Sertraline
(SER)79617-96-2 
306.235 9.16 5.51 1.37 4.17 3.8 26 h Venlafaxine
(VEN)93413-69-5 
277.407 9.50 2.829 3.20 / 572 5±2 h Data obtained and calculated from PubChem ( https://pubchem.ncbi.nlm.nih.gov/ ).3. Sources and contamination levels of antidepressants
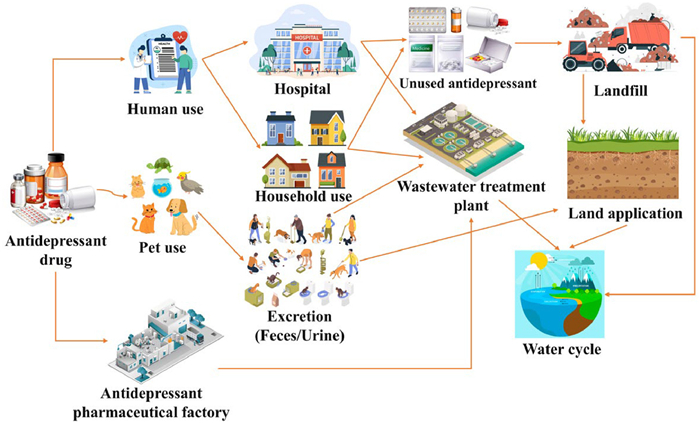
The potential sources and inflow pathways of ATDs in the environment, as well as the environmental acceptors, are illustrated in Fig. 1. Municipal and medical wastewater are identified as primary sources of ATDs and their metabolites in aquatic environments [18], which may be related to consumption, social economy and regional heterogeneity. ATDs have been detected in municipal wastewater treatment plants, as well as in wastewater treatment plants at hospitals and pharmaceutical factories, with concentrations ranging from nanograms per liter to micrograms per liter [19,39]. It has been reported that SSRIs are the ATDs with the highest detection frequency in aquatic environments in recent years [31,37,38]. The determination of ATDs in wastewater and sludge is performed as follows: Wastewater is filtered and pH adjusted to acidic, and the target drugs are enriched by solid phase extraction; sludge is freeze-dried and ground, and then ultrasonication or accelerated solvent extraction is used to release the adsorbed drugs, and then solid phase extraction or QuEChERS is used to remove matrix interferences. The final analysis was performed by liquid chromatography-tandem mass spectrometry (LC-MS/MS) with high sensitivity, combined with the internal standard method and spiked recovery assay to ensure accuracy, and the limit of detection was up to the level of ng/L (for water samples) or ng/g (for sludge).
Figure 1
 Figure 1. Potential sources and fate of ATDs in the environment.
The removal efficiency of ATDs in wastewater treatment plants was relatively insufficient, leading to elevated concentrations of ATDs in the effluents. Table 2 presents the most frequently detected concentrations of ATDs in the influent and effluent of wastewater treatment plants and in surface water across various countries [16,18,21,28,29,39–58]. In this paper, the data screening criteria for ATDs influent and effluent in wastewater treatment plants are articles with clear data sources in the past ten years, regional representativeness, and representative drug types. The data presented in Table 2 indicate that certain ATD concentrations in Brazilian surface water were comparatively higher than those in other countries. For instance, the highest concentration of CIT detected in Brazilian surface water was 520 ng/L [18], whereas the lowest ATD concentrations were detected in surface water in China, with the lowest detected concentration of VEN at 0.32 ng/L [39] and the lowest detected concentration of FLU at 0.5 ng/L [40]. The highest concentration of ATDs in the influent of wastewater treatment plant was recorded for CIT in Denmark with a concentration of 4237 ng/L [41], while the lowest concentration was recorded for FLU in China with a concentration of 0.17 ng/L [42]. The highest concentration of ATDs in the effluent of wastewater treatment plant was reported in Brazil with CIT concentration at 1136 ng/L [18], and the lowest concentration was found in China with AMI concentration at 4.7 ng/L [43]. These wastewaters containing incompletely removed ATDs are discharged into the aquatic environment and may lead to the contamination of surface water [31]. The study showed a significant positive correlation between the concentration of ATDs in surface water and the concentration of ATDs in the influent/effluent of wastewater treatment plants [31]. Despite the considerable dilution of ATDs by rivers, which results in significantly lower concentrations in surface water compared to effluent from wastewater treatment plants, the potential risk they represent to ecological safety should not be overlooked.
Table 2
Table 2. Environmental concentrations of ATDs in different countries.DownLoad:
CSV
Compound Area Source of sample Concentration (ng/L) Year Ref. Amitriptyline Brazil WI 141–200 2020 [18] WE n.d.–80 2020 [18] R 157–196 2020 [18] China WI 7.1–47.2 2021 [43] WE 4.7–41.0 2021 [43] WE 3.66–10.0 2024 [47] R n.d.–15.5 2024 [47] Denmark WI n.d.–175 2023 [41] WE 5–447 2023 [41] Greece WI n.d.–93.2 2020 [28] WE n.d.–161.7 2020 [28] WI n.d.–24.0 2022 [48] WR 3.0–17.7 2022 [48] Sweden WI 11–40 2021 [49] WE 17–74 2021 [49] UK WI 68–104 2020 [50] USA WI 67–94 2020 [50] Citalopram Brazil WI 25–467 2020 [18] WE 25–1136 2020 [18] R 25–520 2020 [18] China WI 30.8–98.5 2021 [43] WE 19.3–97.6 2021 [43] WE 30.0–55.3 2024 [47] R n.d.–70.0 2024 [47] Greece WI n.d.–715.6 2020 [28] WE n.d.–172.6 2020 [28] WI n.d.–50.3 2022 [48] WE 14.4–67.8 2022 [48] Denmark WI n.d.–4237 2023 [41] WE 46–766 2023 [41] Iran WI 4.66–2006.27 2022 [16] Portugal R 67.9 2020 [51] Sweden WI 51–220 2021 [49] WE 120–340 2021 [49] UK D 2.26–2.80 2019 [52] WI 287–347 2020 [50] USA WI 165–300 2020 [50] Fluoxetine Brazil WI 25–173 2020 [18] WE 25–160 2020 [18] R n.d.–90 2020 [18] China WI 2.6 2015 [53] S 0.5–3.5 2020 [40] WI 5.9–36.4 2021 [43] WE 5.1–29.4 2021 [43] WI 0.17–0.29 2024 [42] WE 3.98–6.19 2024 [47] R n.d.–11.7 2024 [47] Greece WI n.d.–486.0 2020 [28] WE n.d.–252.5 2020 [28] WI n.d.–124.4 2021 [54] Iran WI 2.5 2022 [16] Portugal R 28.9 2020 [51] Spain WI 102–208 2022 [55] Sweden WI 1.9–13.5 2021 [49] WE 3.7–17.0 2021 [49] UK D 0.27 2019 [52] WI 46–65 2020 [50] Sertraline Brazil WI 236–417 2020 [18] WE 25 2020 [18] China WI 12.9–103.0 2021 [43] WE 7.0–96.7 2021 [43] WE 8.35–9.10 2024 [47] R n.d.–40.0 2024 [47] Greece WI n.d.–102.6 2020 [28] WE n.d.–218.3 2020 [28] WI n.d.–28.2 2021 [54] Iran WI 114.71–417.57 2022 [16] Mexico WI 56–101 2020 [50] Portugal R 5.4 2020 [51] Slovenia WI 525–573 2020 [21] WI 106–123 2020 [21] WE 22.9–26.3 2020 [21] S 8.59–9.97 2020 [56] Sweden WI 8.5–40.0 2021 [49] WE 15.0–62.0 2021 [49] UK WI 69–111 2020 [50] Venlafaxine Canada WI 2550 2021 [46] China S 18.2–27.6 2020 [40] S 0.32–21 2021 [39] WI 40.25–80.40 2022 [57] WE 21–87 2022 [57] WI 14.28–32.82 2024 [42] Denmark WI 381–1125 2023 [41] WE 318–979 2023 [41] Greece WI 100.8–546.1 2019 [29] WI n.d.–389.2 2019 [29] WI n.d.–582.4 2020 [28] WE n.d.–1071 2020 [28] WI 50.6–289.4 2022 [48] WE 113.0–277.2 2022 [48] Iran WI 209.69–566.93 2022 [16] Mexico WI 93–125 2020 [50] Portugal R 641 2020 [51] Spain S 382.4–1005.9 2020 [58] Sweden WI 250–880 2021 [49] WE 400–1100 2021 [49] UK WI 247–319 2020 [50] USA WI 45–247 2020 [50] WI: wastewater treatment plant influent; WE: wastewater treatment plant effluent; R: river water; D: drinking water; S: surface water; n.d.: not detected. There is also a significant difference in the concentration of influent and effluent at wastewater treatment plants under different seasons. For instance, the concentration of ATDs in the summer influent at a wastewater treatment plant in Iran was considerably higher compared to that in autumn. Specifically, the concentration of VEN in the autumn influent of the wastewater treatment plant ranged from 22.28 ng/L to 29.04 ng/L, while it exhibited an approximately 20-fold increase from 209.69 ng/L to 566.93 ng/L in summer [16]. Seasonal variations in ATD concentrations in the effluent were observed as well, indicating a correlation between both environmental ATD concentrations and the microbial degradation capabilities of ATDs with seasonal changes [44,45]. The factors influencing these phenomena may include temperature and precipitation [46], and further detailed research is required to clarify this point. Understanding the fluctuations in ATD concentrations in both influent and effluent across different seasons is crucial for preventing and managing environmental contamination by these substances.
4. Removal pathways and ecotoxicity of antidepressants during the biological treatment of wastewater
The principal removal pathways for ATDs in biological wastewater treatment systems are adsorption and biodegradation, and the removal of ATDs by hydrolysis and volatilization is insignificant [59,60]. Although wastewater treatment plants are not explicitly designed for ATD removal, numerous studies have indicated that ATDs can be degraded through biological treatment processes [26]. The removal rates of ATDs in various process wastewater treatment plants exhibit considerable variability, with removal rates spanning a wide range from zero (or even negative) to nearly 99%, depending on the type of biological treatment employed at each wastewater treatment plant (Table 3) [18,21,26,29,46,58,61–63]. It was demonstrated that the utilization of the activated sludge method for the elimination of both AMI and SER exhibited a superior efficiency of over 80% [18], and the primary removal mechanism may be attributed to the biosorption of ATDs by activated sludge, thereby achieving a high removal efficiency. Concurrently, the biodegradation process facilitated by fungi has the potential to eliminate up to 95% of VEN [61]. The removal efficiency of VEN was <10% when either anaerobic-anoxic-oxic biological nitrogen and phosphorus removal process (A2O) or cyclic activated sludge system + sequencing batch reactor (CASS + SBR) method was employed [62], which can be attributed to the transformation of its intermediate metabolites or disinfection by-products. In comparison to the CASS + SBR method, the A2O method has been demonstrated to exhibit a higher removal rate of AMI, which may be attributed to the release of ATDs into the wastewater during the process of CASS sinking. Furthermore, the A2O method has a shorter hydraulic retention time, which allows for the treatment of a greater volume of municipal wastewater. The data presented here suggest that future research on ATDs removal should focus on both A2O and biodegradation by fungi technologies to develop a new ATDs removal method that combines the advantages of both.
Table 3
Table 3. Removal methods and removal efficiency of ATDs in WWTPs.DownLoad:
CSV
Compound Elimination method Removal rate (%) HRT (h) Year Ref. Amitriptyline CASS + SBR 23 13.67 + 9.67 2020 [62] Modified A2/O 69 11 2020 [62] UASB 60 / 2020 [18] AS 84.4 / 2020 [18] Citalopram CASS + SBR 38 13.67 + 9.67 2020 [62] Modified A2/O 55 11 2020 [62] Fluoxetine Bioadsorption-bioaccumulation by microalgae biomass >50 24 2020 [58] CASS + SBR 32 13.67 + 9.67 2020 [62] Modified A2/O 45 11 2020 [62] UASB 19.8–78.1 / 2020 [18] Sertraline flow-through bioreactors 91.1–97.4 0.25 2020 [21] AS 89.4 / 2020 [18] Modified A2/O 56 11 2020 [62] MBBR 60 24 2024 [26] Venlafaxine Bioadsorption-bioaccumulation by microalgae biomass >50 24 2020 [58] MBR 38 / 2020 [63] CASS + SBR 6.5 13.67 + 9.67 2020 [62] Modified A2/O −4 11 2020 [62] SMBR 41.8 18 2021 [46] Biodegradation by fungi 70–95 168–2160 2019 [61] AS −100–60 6 2019 [29] CASS: cyclic activated sludge system; SBR: sequencing batch reactor; A2/O: anaerobic-anoxic-oxic biological nitrogen and phosphorus removal process; UASB: up-flow anaerobic sludge blanket; AS: activated sludge; MBBR: moving bed biological reactor; MBR: membrane bioreactor; SMBR: submerged membrane bioreactor. Nowadays, regardless of the technology used in wastewater treatment plants, complete removal of ATDs has not been achieved in the majority of cases, and even a negative removal of ATDs has been observed in the effluent of several wastewater treatment plants [29,41,62]. The negative removal of ATDs may be attributed to the enzymatic reaction of pharmaceuticals excreted as couplers, which are then reconverted to their original compounds during the wastewater treatment process [28,29,31]. The second potential scenario is that ATDs adsorbed on activated sludge may reach a state of supersaturation, leading to changes in their adsorption behavior and the release of some ATDs that were previously adsorbed during the wastewater treatment process [64,65]. The roles of adsorption and biodegradation vary depending on the specific type of ATD in concern, and this is attributable to a number of factors, including the physicochemical properties of the ATDs and the operational conditions of the biological treatment system.
4.1 Adsorption removal mechanisms of antidepressants in wastewater
The detection of ATDs in activated sludge was observed at elevated levels, with the majority of their median concentrations falling within the range of tens to hundreds μg/kg biosolids [22,24,31,66,67]. Elevated ATD concentrations in residual sludge have been reported, suggesting low biodegradability and indicating that adsorption is the primary removal mechanism for ATDs [22,68–71]. The highest detected concentrations of ATDs were observed in sewage sludge from Iceland, where VEN was adsorbed at a concentration of 11.40 mg/kg biosolids [69]. The use of a secondary sedimentation tank can effectively discharge the adsorbed ATD sludge and achieve the removal of ATD by activated sludge adsorption [72]. For example, the introduction of a secondary clarifier-settler in a wastewater biological treatment plant improved the removal efficiency of FLU from wastewater [18]. In a municipal wastewater treatment plant in Iran, the influent FLU concentration was detected to be 2.5 ng/L, while the maximum concentration of 7.65 ng/L was detected in the secondary clarifier [16], which indicated that a considerable quantity of FLU was adsorbed by the activated sludge. In pilot wastewater treatment experiments with flow-through bioreactors, the adsorption removal of SER reached up 90% [21]; in batch experiments with sterile carriers, the concentration of SER decreased immediately [73], all of these indicating that adsorption is the principal removal pathway. The experiment on VEN removal from simulated wastewater using the sequencing batch reactor activated sludge method combined with aerobic granular sludge demonstrated that approximately 50% of VEN was eliminated through biosorption onto sludge particles, indicating its resistance to biodegradation and highlighting biosorption as the primary pathway for removal [23]. Consequently, activated sludge adsorption plays an irreplaceable role in the biological removal of ATDs [21–24,31,70], with activated sludge serving as a significant reservoir for ATDs.
Adsorption primarily occurs through hydrophobic interactions and electrostatic interactions between ATDs and organic matter in activated sludge [24,68,74], with the interaction between the negatively charged surfaces of the adsorbent and the positive charges of ATDs [71,75]. Extracellular polymeric substances (EPS) secreted by microbial cells are the key component responsible for the adsorption of ATDs onto biological sludge [73], and EPS improves the effectiveness of adsorption of ATDs onto certain functional groups such as amine groups, hydroxyl groups and carboxyl groups [68,76]. The main adsorption mechanisms during secondary processing include the adsorption of bacterial lipid structures, bacterial extracellular polysaccharides, and chemical binding to bacterial proteins and nucleic acids [77]. In addition, sludge retention time also plays an important role in the adsorption process of ATDs; the longer the sludge retention time, the higher the biomass concentration and the better the adsorption effect [68,78]. Most hydrophobic and persistent trace organic pollutants (e.g., some ATDs with degradation-resistant properties) tend to be degraded through biomass activity in relatively low proportions, with undegraded ATDs and their metabolites continue to be retained in the solid residue/substrate [24,67,79]. However, current research has not yet fully elucidated the evolution of ATDs in biosolids (e.g., activated sludge).
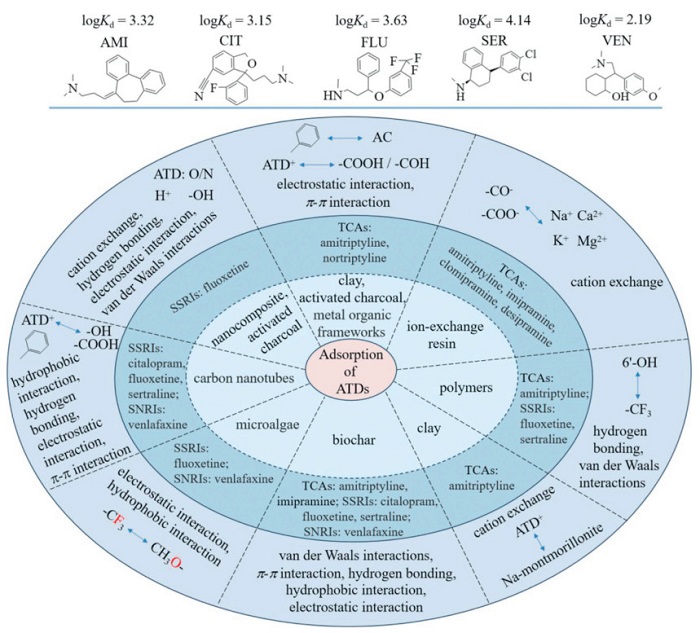
The adsorption process occurring in activated sludge is a highly complex process, influenced by various factors, including the type of adsorbent (sludge type), operating conditions of the biological treatment system, physicochemical properties of ATDs, functional group types, adsorption isotherms, kinetics, thermodynamics, and metal ions [70,76,80–83]. Common adsorption mechanisms for ATDs are illustrated in Fig. 2 [65,75,76,83–92]. The specific adsorption coefficient (Kd) is typically employed to evaluate the adsorption capacity of activated sludge for micropollutants in wastewater treatment plants. The adsorption of micropollutants by activated sludge is negligible when the logKd value is <2, and the adsorption behavior is an important process in determining the pollutant fate when the logKd value is greater than 4 [66,68,93]. The average logKd values for AMI, CIT, FLU, SER, and VEN were calculated to be 3.32, 3.15, 3.63, 4.14, and 2.19, respectively, according to the different literature [31,94,95]. Given that most ATDs have the basic properties of the amine fraction properties (with a pKa of about 9), a higher pH in the aqueous environment (closer to 8) will result in a higher proportion of undissociated molecules in the sludge, thus increasing hydrophobic interactions and leading to a higher Kd value [66].
Figure 2
The octanol-water partition coefficient (logKow) value is commonly used to indicate the hydrophobicity of ATDs and their adsorption capacity from the liquid phase to the solid phase. For example, AMI, VEN, and some of their metabolites, which have logKow values above 3, are likely to have significant adsorption onto suspended substances as a key removal mechanism [29]. The lipophilic characteristics of SER may increase its propensity to adsorb onto biosolids such as activated sludge [18,96]. Nonetheless, not all ATDs are lipophilic compounds, and many of them have polar functional groups (-NH2 or -COOH groups), regardless of their lipophilicity, can be adsorbed onto organic compounds or minerals through electrostatic interactions [24,97]. Electrostatic interactions are more important than hydrophobic interactions due to the higher protein content in extracellular substances of organic compounds [22]. This explains the low detection frequency exhibited by most experiments when only the liquid phase analysis of wastewater is performed. To better analyze the evolution of ATDs during the biological treatment of municipal wastewater, further determinations of the ATDs adsorbed by suspended solids are needed.
4.2 Biodegradation mechanisms of antidepressants in wastewater
Biodegradation is a complex process involving the catabolism of organic compounds, including antidepressants, through the formation of various metabolic intermediates by biotransformation and complete mineralization to CO2 and H2O by either single microorganisms or mixed microorganisms cultivated. Microorganisms have the ability to use ATDs as a single carbon and energy source and/or degrade ATDs through co-metabolism effect. Several factors have the potential to influence the efficiency of biodegradation of ATDs in wastewater treatment plants, including plant configurations (e.g., concentration of carbon, nitrogen, phosphorus, and type of bioreactor), operating conditions (e.g., sludge retention time, hydraulic retention time, sludge loading, temperature, and pH) [26,29,98]. In a municipal wastewater treatment plant in Iran, an influent FLU concentration of 2.5 ng/L was detected, and the presence of FLU was not found at the effluent outlet [16], suggesting that FLU undergoes significant biodegradation. The above studies suggest that this efficiency may be influenced by sludge retention time and hydraulic retention time. Longer sludge retention times allow for the enrichment of slow-growing microorganisms and the domestication of larger microbial populations, which improves their ability to biodegrade in wastewater treatment plants [76]. Additionally, longer sludge ages are more beneficial to increasing the diversity of microbial diversity through the metabolism or co-metabolism effect of ATDs, and extended hydraulic retention times allow for prolonged contact between microorganisms and ATDs, enabling more complete degradation. In batch experiments using sterile carriers, adsorption was found to contribute almost nothing to the removal of VEN [73], showing that biodegradation may be the primary removal pathway. It is worth mentioning that the biodegradation efficiency of ATDs in full-scale biological wastewater treatment processes can vary significantly, particularly due to differing treatment parameters across various wastewater treatment plants.
One factor contributing to the inhibition of the biodegradation process may be the presence of hydrophobic compounds adsorbed onto the sludge [67]. The biodegradation efficiency of hydrophobic compounds varies between 0% and 80%, whereas most hydrophilic compounds achieve biodegradation efficiencies exceeding 80% [22]. Another inhibitory factor is the impact of ATDs on membrane biofouling in wastewater, which affects microbial communities and associated pollutants, thereby reducing degradation efficiency. Differences in biodegradation efficiency may also be explained by the effect of sulfur-containing or nitrogen-containing functional groups in the chemical structure of ATDs, which often decrease their susceptibility to biodegradation. Concurrently, the highly stable carbon-fluorine (C-F) bonds in ATDs (e.g., FLU, CIT, and PAR) and their metabolites make them potentially highly stable and persistent in the environment [26,99], which serves as an additional reason for inhibiting biodegradation processes. Although microbial defluorination under anaerobic conditions presents a promising approach [100,101], there are limited reports on anaerobic degradation of ATDs in bioreactors. Investigations into the transformation and degradation of ATDs under anaerobic conditions are crucial for understanding their removal processes in wastewater treatment plants.
Laboratory-scale anaerobic digestion has demonstrated high removal rates for ATDs [74,102], with biodegradation efficiencies of FLU and CIT exceeding 50% under anaerobic conditions [79]. Sulfur- and nitrogen-containing trace organic pollutants, as well as halogenated aromatic trace organic pollutants have been shown to be more effectively removed under anaerobic conditions [27,103]. Shear forces applied to the sludge during anaerobic digestion can facilitate the recycling of ATDs between the solid and liquid phases, thereby enhancing the biotransformation of some hydrophobic ATDs and improving their degradation efficiency [104]. Additionally, certain inorganic chemical compounds (e.g., NO3−, SO42−, Fe3+, Mn4+) can play the role of oxygen during aerobic degradation as an electron acceptor, receiving electrons from degraded pollutants during anaerobic digestion process [103,105], which increases the biotransformation rate of hydrophilic ATDs with electron-donating functional groups. However, the adsorption of hydrophobic ATDs onto the solid phase (sludge) during anaerobic digestion may inhibit their degradation and biotransformation [67,106], with adsorbed ATDs transferred to organic fractions that are less susceptible to biodegradation, thus reducing overall biodegradation efficiency.
In summary, it is essential to explore the factors affecting the biodegradation efficiency of ATDs, and to explore the technological parameters for highly efficient biodegradation of ATDs. Meanwhile, biodegradation studies of ATDs in wastewater can focus on their mineralization and co-metabolism effects, while concentrating on exploring their biotransformation mechanisms to construct a correlation between the diversity of microbial populations and different biotransformation pathways of ATDs.
4.2.1 Biotransformation mechanisms of amitriptyline
The primary biotransformation pathways of AMI include N-demethylation, N-oxidation, hydroxylation, and methoxylation. Secondary and tertiary metabolic processes involve dehydrogenation, epoxidation, and several alternative primary pathways.
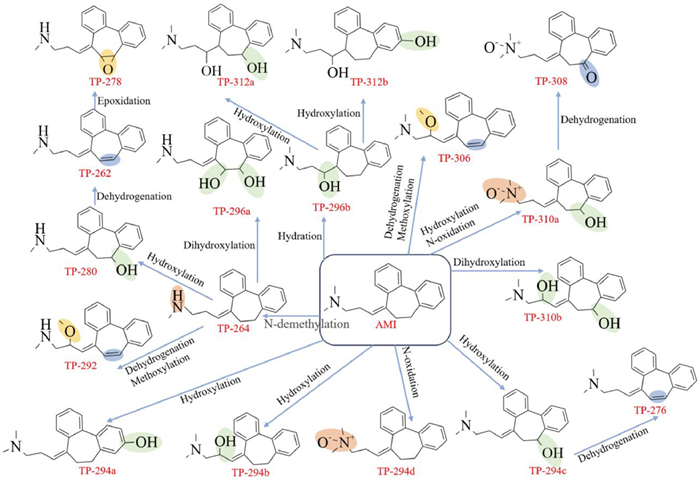
The biotransformation pathway of AMI in wastewater is illustrated in Fig. 3. During biotransformation, AMI undergoes N-demethylation to produce TP-264, hydroxylation on the central cyclic ethenyl group of TP-264 to yield TP-280a and TP-280b, and subsequent dehydrogenation to form TP-262. TP-278 is considered an epoxy metabolite of TP-262. Additionally, AMI is hydroxylated on the aromatic ring to form TP-294a, on the β-carbon of the aliphatic chain to create TP-294b, and on the side chain of the ethenyl group to produce TP-294c. TP-294d is thought to be an N-oxidized metabolite of AMI, while TP-294a undergoes dehydrogenation to form TP-276. AMI is also dehydrogenated and methylated to form TP-306, and TP-264 is dehydrogenated and methylated to produce TP-292. Hydroxylation and N-oxidation on the central cyclic ethenyl group of AMI generate TP-310a, which is then dehydrogenated to form TP-308. Dihydroxylation of the central cyclic ethenyl group of AMI results in TP-310b, and dihydroxylation of TP-264′s central cyclic ethenyl group leads to TP-296a. Hydration of olefins on the γ-carbon of AMI tertiary amines produces TP-296b, which is further hydroxylated to form TP-312 [107–109].
Figure 3
N-Demethylation is considered to be the primary pathway for AMI biotransformation in sewage, and is likely catalyzed by demethylases [109]. However, no significant enhancement in the biological activity of demethylation enzymes has been reported. Improving AMI biotransformation by enhancing the activities of these related enzymes is a prospective area for future research.
4.2.2 Biotransformation mechanisms of citalopram
The six principal biotransformation pathways of CIT include oxidation, N-oxidation, N-demethylation, quaternization, hydroxylation, and nitrile hydrolysis (the primary pathway), with secondary and tertiary metabolic processes involving dehydrogenation, amide hydrolysis, and various alternating primary pathways [26,110,111]. Among them, Sphingomonas relies on hydroxylation reactions to break down the structure of CIT [112,113]. Despite the presence of multiple biotransformation pathways for CIT, the favored reaction sites are the N-containing functional groups, such as cyano group, tertiary amines, and the α-carbon of fatty amines [26,114]. This phenomenon is due to the relatively high frontier electron density at the two nitrogen sites of CIT, making them more prone to be electrophilic attacked [115]. Almost all identified CIT transformation products contain a p-fluorotoluene fragment (C7H6F+, m/z = 109.0453), which represents the inert component of CIT in typical biological reactions.
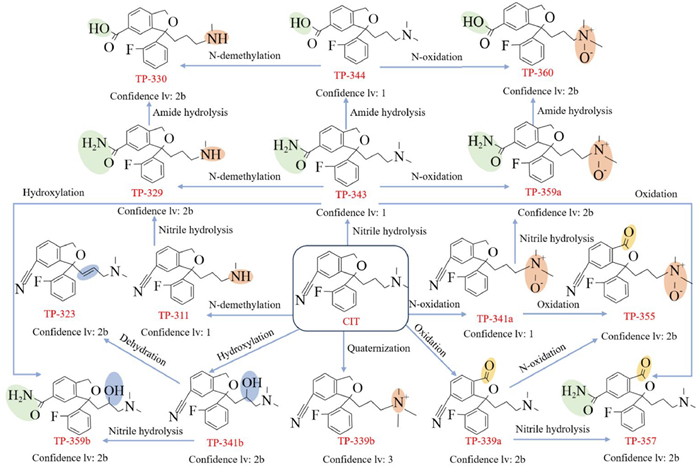
The biotransformation pathway of CIT in wastewater is illustrated in Fig. 4. During biotransformation, CIT loses a methyl group to produce TP-311 (confidence level 1) and adds an oxygen atom to generate TP-341a (confidence level 1) and TP-341b (potentially a hydroxy TP) (confidence level 2b). The confidence levels in this paper strictly adhere to the internationally recognized confidence framework for identification, which divides the confidence level into five grades ranging from 1 to 5. The cyano group in CIT is converted to a carboxamide group, forming TP-343 (confidence level 1), and it is hydrolyzed to a carboxylic acid functional group, leading to the generation of TP-344 (confidence level 1). The furan ring in CIT is oxidized to produce 3-oxo-CIT (TP-339a) (confidence level 2b), and both the furan ring and formamide TP are oxidized to create TP-357 (confidence level 2b). A double bond forms between the α-carbon and β-carbon of the fatty amine in CIT, yielding TP-323 (confidence level 2b). The introduction of a methyl group onto the tertiary amine moiety of CIT results in the formation of TP-339b, a quaternary ammonium salt (confidence level 3). The missing double bond unit is partially present on the butyl chain of CIT as a butadienyl group, forming TP-340 (confidence level 3). TP-343 and TP-311 are further transformed by N-demethylation and nitrile hydrolysis, leading to the generation of TP-329 (confidence level 2b). Amide hydrolysis of TP-329 or N-demethylation of TP-344 produces TP-330 (confidence level 2b). TP-339a undergoes N-oxidation to form TP-355 (confidence level 2b). TP-359a is the N-oxide and formamide transformation product of CIT (confidence level 2b), TP-359b is the hydroxyl group and formamide transformation product of CIT (confidence level 2b), and TP-360 is the N-oxide and carboxylic acid transformation product of CIT (confidence level 2b) [26,111,114,116,117].
Figure 4
Nitrile hydrolysis is identified as the predominant pathway for CIT biotransformation in sewage [111]. Most identified CIT transformation products are of higher mass than the parent compound, suggesting limited microbial utilization of CIT’s carbon backbone. Defluorination of CIT has been rarely documented in biotransformation studies, appearing only in sludge [111] and ultraviolet degradation research [116], indicating that the fluorobenzene segment of CIT remains highly stable and persistent throughout the biotransformation process.
4.2.3 Biotransformation mechanisms of fluoxetine
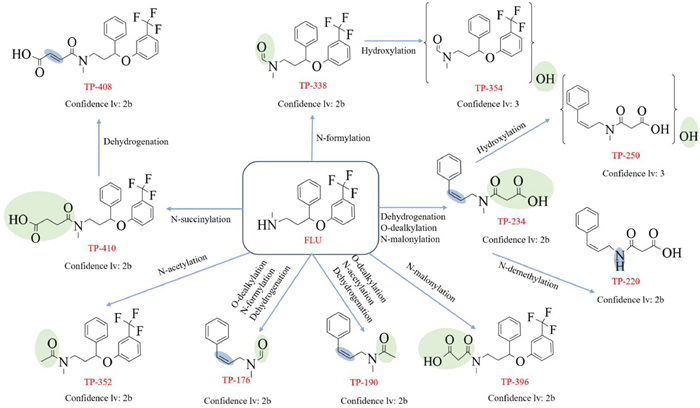
The primary biotransformation pathways of FLU include N-formylation, N-acetylation, N-malonylation, N-succinylation, O-dealkylation, dehydrogenation, benzene ring cleavage, and defluorination. Secondary and tertiary metabolic processes involve hydroxylation, N-demethylation, and various alternating primary pathways.
The biotransformation pathway of FLU in wastewater is illustrated in Fig. 5. FLU undergoes N-malonylation to produce TP-396 (confidence level 2b) and N-acetylation to yield TP-352 (confidence level 2b) during biotransformation. The formation of TP-190 involves a series of reactions, including O-dealkylation, N-acetylation, and dehydrogenation (confidence level 2b). The formation of TP-176 involves a variety of reactions involving O-dealkylation, N-formylation, and dehydrogenation (confidence level 2b). FLU undergoes N-succinylation to form TP-410 (confidence level 2b), which is further transformed by dehydrogenation to TP-408 (confidence level 2b). FLU also undergoes N-methylation to form TP-338 (confidence level 2b), which is subsequently hydroxylated to produce TP-354 (confidence level 3). The formation of TP-234 involves a variety of reactions including O-dealkylation, N-malonylation and dehydrogenation. The formation of TP-234 involves various reactions of O-dealkylation, N-malonylation and dehydrogenation, followed by further conversion to TP-220 (confidence level 2b) by N-demethylation and to TP-250 (confidence level 3) by hydroxylation [31,42,114,117].
Figure 5
N-Succinylation is regarded as the primary pathway for the biotransformation of FLU in sewage. The processes of N-acetylation (leading to the generation of TP-352 and TP-190), N-malonylation (yielding TP-396 and TP-234), and N-succinylation (producing TP-410) can be facilitated by N-acyltransferase [42,118]. Pseudomonas putida degrades FLU and SER, breaking down drug structures by oxidative enzymes such as monooxygenases [119,120]. Moreover, the presence of three electron-withdrawing fluorine atoms in FLU reduces the aromaticity of the benzene ring, potentially impacting the efficiency of FLU biodegradation [121].
4.2.4 Biotransformation mechanisms of sertraline
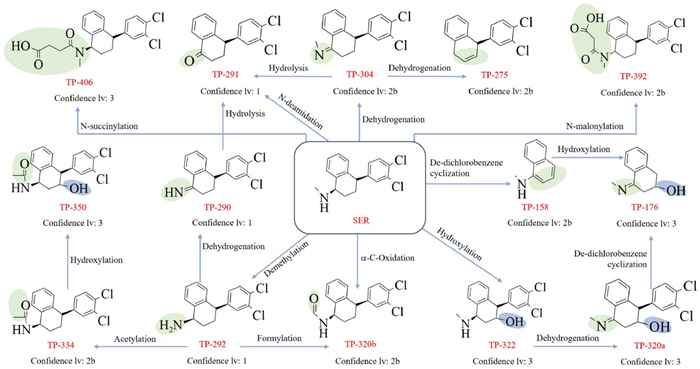
The primary biotransformation pathways of SER include oxidation, demethylation, acetylation, hydroxylation, and N-succinylation, while secondary and tertiary metabolic processes involve dehydrogenation, cleavage, and various alternative primary pathways. Among the oxidation processes for SER, the most prevalent are the oxidation of N-methyl groups to carbonyls and the conversion of secondary amines to ketones [31].
The biotransformation pathway of SER in wastewater is illustrated in Fig. 6. During biotransformation, SER loses a methyl group to produce TP-292 (dimethyl sertraline) (confidence level 1), which is subsequently acetylated to form TP-334 (confidence level 2b) and hydroxylated to generate TP-350 (confidence level 3). TP-290 results from the dehydrogenation of TP-292 (confidence level 1), TP-291 is produced by the hydrolysis of TP-290 (confidence level 1) and also by the hydrolysis of TP-304 (confidence level 1). The structures of TP-320b and TP-334 correspond to formamide and acetamide molecules attached to TP-292 (confidence level 2b), respectively; TP-320b can also be directly formed from SER following α-C-oxidation pathway (confidence level 2b). TP-304 is formed by the dehydrogenation reaction of SER (confidence level 2b), and TP-275 results from the dehydrogenation of TP-304 (confidence level 2b). TP-158 is formed temporarily from the loss of the dichlorobenzene ring in the SER (confidence level 2b), TP-291 is produced by N-deamination of SER (confidence level 1), and TP-392 is formed by N-malonylation of SER (confidence level 2b). TP-406 is generated by N-succinylation of SER (confidence level 3), and peak area data suggest that TP-406 is the principal biotransformation product [111]. TP-322 is thought to be a product of SER hydroxylation (confidence level 3), and TP-322 has been previously revealed as a result of solar photodegradation [56] and soil degradation [122]. TP-320a is formed by the dehydrogenation of TP-322 (confidence level 3), whereas TP-176 is produced following the cleavage of the dichlorobenzene ring in TP-320a (confidence level 3); TP-176 is also regarded as hydroxylated TP-158 (confidence level 3) [21,31,56,111,114,123].
Figure 6
N-Succinylation is considered to be the primary pathway for SER biotransformation in sewage [111], and may be catalyzed by N-acyltransferase [109,118]. The biodegradation rate is significantly higher when SER is the exclusive substrate [21]. In addition to metabolizing SER as the sole carbon and/or nitrogen source for microbial growth, enzymes secreted by the microbial community also promote the biodegradation of SER [68], accounting for the efficient removal of SER in most biological wastewater treatment processes.
4.2.5 Biotransformation mechanisms of venlafaxine
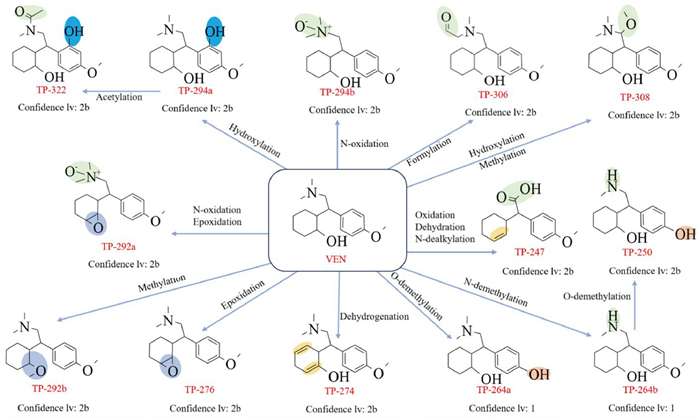
The primary biotransformation pathways of VEN include N-oxidation, O-demethylation, N-demethylation, dehydrogenation, epoxidation, hydroxylation, methylation, and formylation reactions, while secondary and tertiary metabolic processes involve acetylation and several alternative primary pathways.
The biotransformation pathway of VEN in wastewater is illustrated in Fig. 7. During biotransformation, VEN may undergo O-demethylation or N-demethylation to produce TP-264a (confidence level 1) or TP-264b (confidence level 1), respectively. VEN also experiences dehydrogenation to form TP-274 (confidence level 2b), epoxidation to yield TP-276 (confidence level 2b), methylation to create TP-292b (confidence level 2b), N-oxidation to produce TP-294b (confidence level 2b), and formylation to form TP-306 (confidence level 2b). TP-264b is further converted by O-demethylation to TP-250 (confidence level 2b). VEN undergoes N-dealkylation, followed by oxidation of the aldehyde product to a carboxylic acid, and subsequent dehydration to form an olefin, leading to the generation of TP-247 generation (confidence level 2b). The formation of TP-292a involves both N-oxidation and epoxidation (confidence level 2b), while TP-308 is produced through both methylation and hydroxylation (confidence level 2b). VEN also undergoes hydroxylation to generate TP-294a (confidence level 2b), which is subsequently acetylated to form TP-322 (confidence level 2b) [31,42,114,124–126].
Figure 7
VEN features a methoxy (methyl ether) portion (electron-donor group) on its aromatic ring, alongside a tertiary amine and a cyclohexanol ring. In batch experiments with anaerobic activated sludge and in a full-size submersible artificial wetland, VEN readily undergoes demethylation to form O-dimethyl venlafaxine (TP-264a). Although TP-264a has been demonstrated to be highly persistent and resistant to further transformations under anaerobic conditions, it may be degraded under aerobic conditions [124–126]. In batch experiments using sterile carriers, adsorption is found to contribute little to VEN removal, further supporting that biodegradation is the primary pathway for its removal [73].
4.3 Ecotoxicity of antidepressants in aquatic environments
The available laboratory studies suggest that ATDs and their metabolites can affect various levels of biological organization, leading to negative effects at the individual level, including survival, growth, morphology, behavior, and reproduction [12,15,23,127], thereby causing significant ecological impacts [11,128–130]. The bio-accumulative capacity and chronic toxicity of ATDs is the main reason for focusing on them in this paper. Firstly, although ATDS are present in low concentrations in the environment, they have the capacity to persist for extended periods (for example, in aqueous environments or soils), gradually accumulate through the food chain, and ultimately exert effects on higher organisms, including humans. Secondly, the chronic toxicity of ATDS should not be underestimated, and long-term low-dose exposure can have irreversible effects on sensitive organisms and populations. Consequently, even at present low concentrations, the necessity for ongoing environmental monitoring and toxicology studies remains, in order to ensure protection against potential risks which are as yet unknown.
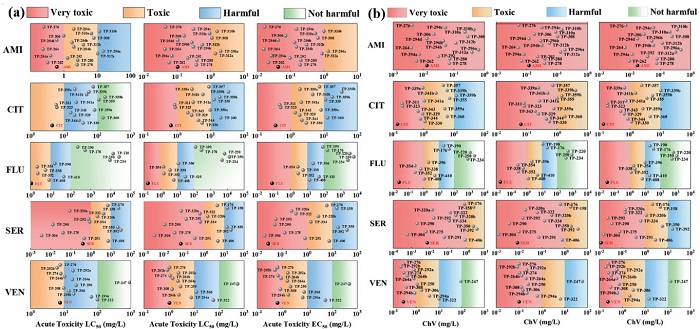
The evolution of toxicity during ATD degradation does not necessarily follow a downward trend due to the different potential toxicities of metabolic intermediates [31]. Acute and chronic toxicity of common ATDs and their metabolic intermediates to fish, Daphnia and green algae were assessed using a quantitative structure activity relationship (QSAR) approach with ECOSAR software (United States Environmental Protection Agency) [131,132]. AMI and SER display acute toxicity with LC50 values below 1 mg/L, classifying them as highly toxic chemicals [109]. As depicted in Fig. 8, the toxicity of most metabolic intermediates of ATDs is lower than that of their parent compounds. For example, TP-410, the most common transformation product of FLU, is considerably less ecotoxic than FLU, which means that FLU can be readily transformed into less ecotoxic or even innocuous products through biodegradation. However, for AMI and SER, the toxicity of some metabolic intermediates exceeds that of their parent compounds (e.g., TP-264, the primary products for AMI biotransformation), highlighting the need for future research focused on monitoring and degrading these highly ecotoxic metabolic intermediates. This enhanced toxicity is primarily attributable to the specific modification of the metabolite's molecular structure: It has been established that TP-264 retains the lipophilic group of the parent compound, whilst simultaneously forming a new reactive site through hydroxylation and epoxidation. This enables the compound to penetrate the biofilm barrier, irreversibly bind to the cytochrome P450 enzyme system, and induce the explosive generation of reactive oxygen radicals. It is important to note that such highly reactive intermediates are difficult to fully mineralize in conventional wastewater treatment processes. Furthermore, through surface runoff and food chain enrichment, these intermediates have formed hidden pollution pools in aquatic ecosystems. In order to mitigate this potential risk, the molecular structure of the substance can be modified in conjunction with other biotechnologies, thereby reducing their ecotoxicity.
Figure 8
 Figure 8. Acute toxicities (a) and chronic toxicities (b) of ATDs and their transformation products to fish, Daphnia and green algae predicted by ECOSAR software.
5. Conclusions and outlooks
5.1 Conclusions
This review examines the occurrence and fate of five common ATDs in the influent and effluent of municipal and hospital wastewater treatment plant, as well as in surface water globally. It also summarizes the primary adsorption and biodegradation mechanisms involved in ATDs removal. The most important of these conclusions are as follows:
(1) The total detected concentrations of ATDs varied from 0.17 ng/L to 4237 ng/L in influent, 3 ng/L to 1136 ng/L in effluent, and 0.32 ng/L to 641 ng/L in surface water. The long-term impact of excessive environmental concentrations of ATDs on ecological health is a significant concern.
(2) The removal efficiencies of antidepressant-type pollutants during biological wastewater treatment ranged from negative to 99%, with adsorption and biodegradation being the primary removal mechanisms. Hydrolysis and volatilization contributed minimally to the removal of ATDs, and extracellular polymeric substances (EPS) enhanced the adsorption of ATDs to specific functional groups.
(3) N-Acylation and N-hydroxylation are the characteristic reactions involved in the biodegradation of ATDs. N-Acylation occurs at the secondary amide site and the responsible enzyme is N-acyltransferase, while N-hydroxylation takes place at the tertiary amide site. Tertiary amines may also undergo biotransformation through N-oxidation and N-dealkylation reactions.
(4) The assessment of acute and chronic toxicity of ATDs and their transformation products to fish, daphnia, and green algae has led to the identification of ATDs and their metabolites that should be prioritized for control to effectively mitigate their potential environmental risks.
5.2 Outlooks
Given the diversity of ATD species and the complexity of real aquatic environments, several key areas of focus have emerged regarding the evolution of antidepressant-type pollutants during the biological treatment of municipal wastewater:
(1) Despite numerous studies have been reported on the biodegradation of ATDs, the intrinsic mechanisms of ATD degradation at molecular level still remain unclear. Additionally, there is a lack of research on the anaerobic degradation of ATDs in bioreactors and the microbial communities involved.
(2) Adsorption of ATDs to suspended materials and activated sludge represents a significant potential removal mechanism. Further investigation is needed to understand the factors affecting ATD adsorption by activated sludge.
(3) The impact of EPS on the adsorption and desorption of ATDs, as well as the complex interactions between EPS and ATDs, requires further investigation to enhance understanding on the fate of ATDs in municipal wastewater biological treatment systems.
(4) The application of artificial intelligence dynamic modeling in wastewater treatment plants should be expanded. Real-time monitoring of ATD concentrations and their metabolic intermediates in effluent should be implemented. Additionally, the ecotoxicity of antidepressant pollutants in effluent should be investigated, and fluctuations in pollutant concentrations should be predicted in advance.
Declaration of competing interest
The authors declare that they have no known competing financial interests or personal relationships that could have appeared to influence the work reported in this paper.
CRediT authorship contribution statement
Chaofan Zhang: Writing – review & editing, Writing – original draft, Validation, Resources, Investigation, Data curation, Conceptualization. Hongyu Dong: Writing – review & editing, Resources, Data curation. Xueyang Zhao: Writing – review & editing, Supervision. Cheng Fang: Writing – review & editing, Supervision. Yanbin Tong: Writing – review & editing, Funding acquisition. Junfeng Niu: Writing – review & editing, Validation, Supervision, Funding acquisition, Conceptualization.
Acknowledgments
This study was financially supported by National Key Research and Development Program (No. 2022YFE0135700) and Sichuan Science and Technology Program (No. 2025YFHZ0266).
-
-
[1]
X. Zhai, H.H.Y. Tong, C.K. Lam, et al., Nat. Hum. Behav. 8 (2024) 2392–2405. doi: 10.1038/s41562-024-02033-0
-
[2]
A.M. Marconi, U.S. Myers, B. Hanson, et al., Sci. Rep. 13 (2023) 19063. doi: 10.1038/s41598-023-46303-9
-
[3]
R. Somerstein, Science 386 (2024) 500. doi: 10.1126/science.adr3260
-
[4]
J. De Oliveira Costa, M.B. Gillies, A.L. Schaffer, et al., Aust. N. Z. J. Psychiatry 57 (2023) 49–57. doi: 10.1177/00048674221079740
-
[5]
WHO,
https://www.who.int/news/item/12-04-2023 , 2023. -
[6]
S. Wilkinson, R.T. Mulder, New Zeal. Med. J. 131 (2018) 52–59.
-
[7]
D.J. Brody, Q. Gu, NCHS Data Brief 377 (2020) 1–8.
-
[8]
A. Gomez-Lumbreras, P. Ferrer, E. Ballarín, et al., J. Affect. Disorders 249 (2019) 278–285. doi: 10.1016/j.jad.2019.01.039
-
[9]
Z. Yu, J. Zhang, Y. Zheng, et al., Front. Psychiatry 11 (2020) 551.
-
[10]
R. Brauer, B. Alfageh, J.E. Blais, et al., Lancet Psychiatry 8 (2021) 1071–1082. doi: 10.1016/S2215-0366(21)00292-3
-
[11]
R.L. Bachour, O. Golovko, M. Kellner, et al., Chemosphere 238 (2020) 124587. doi: 10.1016/j.chemosphere.2019.124587
-
[12]
D.G. Moreira, A. Aires, M. De Lourdes Pereira, et al., Biochem. Physiol. C: Toxicol. Pharmacol. 256 (2022) 109322. doi: 10.1016/j.cbpc.2022.109322
-
[13]
J. Escudero, J.L. Muñoz, T. Morera-Herreras, et al., Sci. Total Environ. 769 (2021) 144634. doi: 10.1016/j.scitotenv.2020.144634
-
[14]
B. Halling-Sørensen, S. Nors Nielsen, P.F. Lanzky, et al., Chemosphere 36 (1998) 357–393. doi: 10.1016/S0045-6535(97)00354-8
-
[15]
K. Słoczyńska, J. Orzeł, A. Murzyn, et al., Aquat. Toxicol. 260 (2023) 106554. doi: 10.1016/j.aquatox.2023.106554
-
[16]
S. Golbaz, M. Zamanzadeh, K. Yaghmaeian, et al., Environ. Sci. Pollut. Res. 30 (2023) 27041–27055.
-
[17]
P. Arnnok, R.R. Singh, R. Burakham, et al., Environ. Sci. Technol. 51 (2017) 10652–10662. doi: 10.1021/acs.est.7b02912
-
[18]
R.C. Pivetta, C. Rodrigues-Silva, A.R. Ribeiro, et al., Sci. Total Environ. 727 (2020) 138661. doi: 10.1016/j.scitotenv.2020.138661
-
[19]
Z. Xie, Y. Nie, M. Dong, et al., Sci. Total Environ. 926 (2024) 171802. doi: 10.1016/j.scitotenv.2024.171802
-
[20]
P.P. Fong, A.T. Ford, Aquat. Toxicol. 151 (2014) 4–13. doi: 10.1016/j.aquatox.2013.12.003
-
[21]
T. Gornik, A. Kovacic, E. Heath, et al., Water Res. 181 (2020) 115864. doi: 10.1016/j.watres.2020.115864
-
[22]
A. Sellier, S. Khaska, C.L. Gal, L. Salle, J. Hazard. Mater. 426 (2022) 128104. doi: 10.1016/j.jhazmat.2021.128104
-
[23]
A. Singh, D. Saidulu, A.K. Gupta, et al., J. Environ. Chem. Eng. 10 (2022) 109012. doi: 10.1016/j.jece.2022.109012
-
[24]
C. Mejías, J. Martín, J.L. Santos, et al., Trends Environ. Anal. Chem. 30 (2021) e00125. doi: 10.1016/j.teac.2021.e00125
-
[25]
A. Silva, C. Delerue-Matos, S. Figueiredo, et al., Water 11 (2019) 1555. doi: 10.3390/w11081555
-
[26]
C. Liang, Z. Wei, K. Bester, Water Res. 252 (2024) 121245. doi: 10.1016/j.watres.2024.121245
-
[27]
M. Martins, S. Sanches, I.A.C. Pereira, J. Hazard. Mater. 357 (2018) 289–297. doi: 10.1016/j.jhazmat.2018.06.001
-
[28]
C.I. Kosma, M.G. Kapsi, P.S.G. Konstas, et al., Environ. Res. 191 (2020) 110152. doi: 10.1016/j.envres.2020.110152
-
[29]
C.I. Kosma, C.I. Nannou, V.I. Boti, et al., Sci. Total Environ. 659 (2019) 1473–1483. doi: 10.1016/j.scitotenv.2018.12.421
-
[30]
S. Comber, M. Gardner, P. Sörme, et al., Sci. Total Environ. 613-614 (2018) 538–547. doi: 10.1016/j.scitotenv.2017.09.101
-
[31]
W. Wang, J. Zhang, M. Hu, et al., Sci. Total Environ. 903 (2023) 166120. doi: 10.1016/j.scitotenv.2023.166120
-
[32]
C. Castillo-Zacarías, M.E. Barocio, E. Hidalgo-Vázquez, et al., Sci. Total Environ. 757 (2021) 143722. doi: 10.1016/j.scitotenv.2020.143722
-
[33]
A.V. Kulikov, R.R. Gainetdinov, E. Ponimaskin, et al., Expert Opin. Ther. Targets 22 (2018) 319–330. doi: 10.1080/14728222.2018.1452912
-
[34]
M. Matejczyk, P. Ofman, J. Wiater, et al., Materials 16 (2023) 3600. doi: 10.3390/ma16093600
-
[35]
L.J.G. Silva, A.M.P.T. Pereira, L.M. Meisel, et al., Sci. Total Environ. 490 (2014) 279–287. doi: 10.1016/j.scitotenv.2014.04.131
-
[36]
T. Kosjek, E. Heath, Trac-Trend Anal. Chem. 29 (2010) 832–847. doi: 10.1016/j.trac.2010.04.012
-
[37]
N. Diaz-Camal, J.D. Cardoso-Vera, H. Islas-Flores, et al., Sci. Total Environ. 829 (2022) 154656. doi: 10.1016/j.scitotenv.2022.154656
-
[38]
R.A. Mole, B.W. Brooks, Environ. Pollut. 250 (2019) 1019–1031. doi: 10.1016/j.envpol.2019.04.118
-
[39]
J. Liang, H. Meng, J. Zhou, et al., ACS EST Water 1 (2021) 825–836. doi: 10.1021/acsestwater.0c00174
-
[40]
R. Ma, H. Qu, B. Wang, et al., Environ. Int. 138 (2020) 105657. doi: 10.1016/j.envint.2020.105657
-
[41]
K. Kilpinen, J. Devers, M. Castro, et al., Environ. Sci. Pollut. Res. 30 (2023) 121107–121123. doi: 10.1007/s11356-023-30331-z
-
[42]
G. Wu, T. Wu, Y. Chen, et al., Sci. Total Environ. 907 (2024) 167727. doi: 10.1016/j.scitotenv.2023.167727
-
[43]
R. Wu, Y. Ruan, H. Lin, et al., ACS EST Water 1 (2021) 542–552. doi: 10.1021/acsestwater.0c00081
-
[44]
A. Dogan, D. Kempińska-Kupczyk, P. Kubica, et al., Microchem. J. 159 (2020) 105517. doi: 10.1016/j.microc.2020.105517
-
[45]
O. Golovko, V. Kumar, G. Fedorova, et al., Chemosphere 111 (2014) 418–426. doi: 10.1016/j.chemosphere.2014.03.132
-
[46]
B. Tiwari, Y. Ouarda, P. Drogui, et al., Front. Water 3 (2021) 730479. doi: 10.3389/frwa.2021.730479
-
[47]
R. Wu, E.Y. Sin, K. Zhang, et al., Environ. Int. 184 (2024) 108434. doi: 10.1016/j.envint.2024.108434
-
[48]
A. Ofrydopoulou, C. Nannou, E. Evgenidou, et al., Sci. Total Environ. 802 (2022) 149860. doi: 10.1016/j.scitotenv.2021.149860
-
[49]
O. Golovko, S. Örn, M. Sörengård, et al., Sci. Total Environ. 754 (2021) 142122. doi: 10.1016/j.scitotenv.2020.142122
-
[50]
K.T. Ng, H. Rapp-Wright, M. Egli, et al., J. Hazard. Mater. 398 (2020) 122933. doi: 10.1016/j.jhazmat.2020.122933
-
[51]
M.J. Fernandes, P. Paíga, A. Silva, et al., Chemosphere 239 (2020) 124729. doi: 10.1016/j.chemosphere.2019.124729
-
[52]
Y. Peng, L. Gautam, S.W. Hall, Chemosphere 223 (2019) 438–447. doi: 10.1016/j.chemosphere.2019.02.040
-
[53]
M. Wu, J. Xiang, C. Que, et al., Chemosphere 138 (2015) 486–493. doi: 10.1016/j.chemosphere.2015.07.002
-
[54]
C. Christophoridis, S. Veloutsou, E. Mitsika, et al., Environ. Monit. Assess. 193 (2021) 249. doi: 10.1007/s10661-021-09035-9
-
[55]
E.T. Alexa, M.D.L.Á.B.R.D.H. Bueno, R. González, et al., Water 14 (2022) 4129. doi: 10.3390/w14244129
-
[56]
T. Gornik, A. Vozic, E. Heath, et al., Environ. Pollut. 256 (2020) 113431. doi: 10.1016/j.envpol.2019.113431
-
[57]
Y. Chen, J. Wang, P. Xu, et al., Front. Public Health 10 (2022) 963257. doi: 10.3389/fpubh.2022.963257
-
[58]
M.J. García-Galán, L. Arashiro, L.H.M.L.M. Santos, et al., J. Hazard. Mater. 390 (2020) 121771. doi: 10.1016/j.jhazmat.2019.121771
-
[59]
L. Restrepo-Vieira, K.L. Linge, F. Busetti, et al., Environ. Sci.-Wat. Res. Technol. 10 (2024) 847–859. doi: 10.1039/d3ew00673e
-
[60]
T. Lin, S. Yu, W. Chen, Chemosphere 152 (2016) 1–9.
-
[61]
M. Llorca, F. Castellet-Rovira, M.J. Farré, et al., Environ. Pollut. 246 (2019) 346–356. doi: 10.1016/j.envpol.2018.12.008
-
[62]
J. Cao, B. Fu, T. Zhang, et al., Bioresour. Technol. 310 (2020) 123436. doi: 10.1016/j.biortech.2020.123436
-
[63]
L.F. Angeles, R.A. Mullen, I.J. Huang, et al., Environ. Sci. Wat. Res. 6 (2020) 62–77. doi: 10.1039/c9ew00559e
-
[64]
I.L. Costa Junior, C.S. Machado, A.L. Pletsch, et al., Int. J. Sediment Res. 37 (2022) 346–354. doi: 10.1016/j.ijsrc.2021.10.004
-
[65]
P.H. Chang, P. Liu, B. Sarkar, et al., J. Colloid Interface Sci. 598 (2021) 379–387. doi: 10.1016/j.jcis.2021.04.033
-
[66]
A. Lajeunesse, S.A. Smyth, K. Barclay, et al., Water Res. 46 (2012) 5600–5612. doi: 10.1016/j.watres.2012.07.042
-
[67]
H.V. Phan, R. Wickham, S. Xie, et al., Bioresour. Technol. 256 (2018) 384–390. doi: 10.1016/j.biortech.2018.02.040
-
[68]
T. Zhu, Z. Su, W. Lai, et al., Sci. Total Environ. 776 (2021) 145906. doi: 10.1016/j.scitotenv.2021.145906
-
[69]
S. Huber, M. Remberger, L. Kaj, et al., Sci. Total Environ. 562 (2016) 13–25. doi: 10.1016/j.scitotenv.2016.03.063
-
[70]
J.W. Choi, Y. Zhao, J.K. Bediako, et al., Sci. Total Environ. 634 (2018) 52–58. doi: 10.1016/j.scitotenv.2018.03.278
-
[71]
C. Burzio, J. Ekholm, O. Modin, et al., J. Hazard. Mater. 438 (2022) 129528. doi: 10.1016/j.jhazmat.2022.129528
-
[72]
H. Zhan, Y. Wang, X. Mi, et al., Chin. Chem. Lett. 31 (2020) 2843–2848. doi: 10.1016/j.cclet.2020.08.015
-
[73]
K. Tang, P. Rosborg, E.S. Rasmussen, et al., J. Hazard. Mater. 403 (2021) 123536. doi: 10.1016/j.jhazmat.2020.123536
-
[74]
G.U. Semblante, F.I. Hai, X. Huang, et al., J. Hazard. Mater. 300 (2015) 1–17.
-
[75]
R. Maršálek, M. Švidrnoch, Environ. Challenge 1 (2020) 100005. doi: 10.1016/j.envc.2020.100005
-
[76]
A.S. Oberoi, Y. Jia, H. Zhang, et al., Environ. Sci. Technol. 53 (2019) 7234–7264. doi: 10.1021/acs.est.9b01131
-
[77]
O.A.H. Jones, N. Voulvoulis, J.N. Lester, Arch. Environ. Contam. Toxicol. 50 (2006) 297–305. doi: 10.1007/s00244-005-1095-3
-
[78]
D.L. Cheng, H.H. Ngo, W.S. Guo, et al., Sci. Total Environ. 621 (2018) 1664–1682. doi: 10.1016/j.scitotenv.2017.10.059
-
[79]
L. Gonzalez-Gil, M. Papa, D. Feretti, et al., Water Res. 102 (2016) 211–220. doi: 10.1016/j.watres.2016.06.025
-
[80]
C.J. Tang, X. Chen, F. Feng, et al., J. Water Process Eng. 41 (2021) 102094. doi: 10.1016/j.jwpe.2021.102094
-
[81]
H. Gu, W. Lin, S. Sun, et al., Ecotox. Environ. Safe. 209 (2021) 111760. doi: 10.1016/j.ecoenv.2020.111760
-
[82]
L. He, Y. Chen, Y. Li, et al., Water Sci. Technol. 85 (2022) 1936–1951. doi: 10.2166/wst.2022.085
-
[83]
D. Mangla, A.S. Annu, et al., J. Hazard. Mater. 425 (2022) 127946. doi: 10.1016/j.jhazmat.2021.127946
-
[84]
J.W. Choi, J.K. Bediako, Y. Zhao, et al., Environ. Sci. Pollut. Res. 27 (2020) 24760–24771. doi: 10.1007/s11356-019-06549-1
-
[85]
G.D. Bozyiğit, B.T. Zaman, O.K. Özdemir, et al., Environ. Monit. Assess. 196 (2024) 77. doi: 10.1007/s10661-023-12231-4
-
[86]
D. Bonenfant, M. Mimeault, P. Niquette, et al., Water Sci. Technol. 66 (2012) 224–230. doi: 10.2166/wst.2012.112
-
[87]
S.M. Mahgoub, D. Essam, Z.E. Eldin, et al., Sci. Rep. 14 (2024) 3990. doi: 10.1038/s41598-024-53781-y
-
[88]
K. Murtada, F. De Andrés, A. Ríos, et al., Electrophoresis 39 (2018) 1808–1815. doi: 10.1002/elps.201700496
-
[89]
A. Silva, W. Stawiński, J. Romacho, et al., Environ. Eng. Sci. 36 (2019) 573–582. doi: 10.1089/ees.2018.0332
-
[90]
B. Wang, Y. Chen, W. Li, et al., Anal. Chim. Acta 1296 (2024) 342295. doi: 10.1016/j.aca.2024.342295
-
[91]
W.T. Tee, N.Y.L. Loh, B.Y.Z. Hiew, et al., J. Environ. Manag. 344 (2023) 118363. doi: 10.1016/j.jenvman.2023.118363
-
[92]
C.Y. Wang, C.C. Wang, X.W. Zhang, et al., Chin. Chem. Lett. 33 (2022) 1353–1357. doi: 10.1016/j.cclet.2021.08.095
-
[93]
A.M. Deegan, B. Shaik, K. Nolan, et al., Int. J. Environ. Sci. Technol. 8 (2011) 649–666. doi: 10.1007/BF03326250
-
[94]
A. Lajeunesse, M. Blais, B. Barbeau, et al., Chem. Cent. J. 7 (2013) 15. doi: 10.1186/1752-153X-7-15
-
[95]
P. Verlicchi, E. Zambello, Sci. Total Environ. 538 (2015) 750–767. doi: 10.1016/j.scitotenv.2015.08.108
-
[96]
B. Subedi, K. Kannan, Sci. Total Environ. 514 (2015) 273–280. doi: 10.1016/j.scitotenv.2015.01.098
-
[97]
J. Stevens-Garmon, J.E. Drewes, S.J. Khan, et al., Water Res. 45 (2011) 3417–3426. doi: 10.1016/j.watres.2011.03.056
-
[98]
B. Wang, Z. Xu, B. Dong, J. Hazard. Mater. 469 (2024) 133925. doi: 10.1016/j.jhazmat.2024.133925
-
[99]
J. Park, S. An, E.H. Jho, et al., Water Res. 185 (2020) 116242. doi: 10.1016/j.watres.2020.116242
-
[100]
Y. Yu, K. Zhang, Z. Li, et al., Environ. Sci. Technol. 54 (2020) 14393–14402. doi: 10.1021/acs.est.0c04483
-
[101]
Y. Yu, S. Che, C. Ren, et al., Environ. Sci. Technol. 56 (2022) 4894–4904. doi: 10.1021/acs.est.1c05509
-
[102]
T.L. Palma, M.C. Costa, Anaerobe 68 (2021) 102356. doi: 10.1016/j.anaerobe.2021.102356
-
[103]
K.C. Wijekoon, J.A. McDonald, S.J. Khan, et al., Bioresour. Technol. 189 (2015) 391–398. doi: 10.1016/j.biortech.2015.04.034
-
[104]
S. Yang, J. McDonald, F.I. Hai, et al., Bioresour. Technol. 240 (2017) 197–206. doi: 10.1016/j.biortech.2017.02.020
-
[105]
W. Liu, N.B. Sutton, H.H.M. Rijnaarts, et al., J. Hazard. Mater. 388 (2020) 119361. doi: 10.1016/j.jhazmat.2018.04.078
-
[106]
A.K. Ghattas, F. Fischer, A. Wick, et al., Water Res. 116 (2017) 268–295. doi: 10.1016/j.watres.2017.02.001
-
[107]
H. Ziarrusta, L. Mijangos, U. Izagirre, et al., Environ. Sci. Technol. 51 (2017) 2464–2471. doi: 10.1021/acs.est.6b05831
-
[108]
R.A. Osawa, B.T. Barrocas, O.C. Monteiro, et al., Chem. Eng. J. 373 (2019) 1338–1347. doi: 10.1016/j.cej.2019.05.137
-
[109]
G. Wu, R. Yao, Y. Zhang, et al., Chem. Eng. J. 493 (2024) 152557. doi: 10.1016/j.cej.2024.152557
-
[110]
V.G. Beretsou, A.K. Psoma, P. Gago-Ferrero, et al., Water Res. 103 (2016) 205–214. doi: 10.1016/j.watres.2016.07.029
-
[111]
G. Wu, X. Wang, X. Zhang, et al., Water Res. 232 (2023) 119509. doi: 10.1016/j.watres.2022.119509
-
[112]
X. Wang, H. Wu, L. Wang, et al., Environ. Res. 219 (2023) 115014. doi: 10.1016/j.envres.2022.115014
-
[113]
S. Asaf, M. Numan, A.L. Khan, et al., Crit. Rev. Biotechnol. 2 (2020) 138–152. doi: 10.1080/07388551.2019.1709793
-
[114]
R. Gulde, U. Meier, E.L. Schymanski, et al., Environ. Sci. Technol. 50 (2016) 2908–2920. doi: 10.1021/acs.est.5b05186
-
[115]
W. Lin, B. Zhao, S. Ping, et al., Chemosphere 305 (2022) 135440. doi: 10.1016/j.chemosphere.2022.135440
-
[116]
R.A. Osawa, A.P. Carvalho, O.C. Monteiro, et al., Chemosphere 217 (2019) 858–868. doi: 10.1016/j.chemosphere.2018.11.027
-
[117]
S. Reverbel, M.H. Dévier, V. Dupraz, et al., Toxics 11 (2023) 713. doi: 10.3390/toxics11080713
-
[118]
D.M. Kennes-Veiga, B. Vogler, K. Fenner, et al., Sci. Total Environ. 780 (2021) 146564. doi: 10.1016/j.scitotenv.2021.146564
-
[119]
P. Nikel, T. Fuhrer, M. Chavarría, et al., ISME Commun. 6 (2021) 1751–1766. doi: 10.1038/s41396-020-00884-9
-
[120]
J. Kim, W. Park, Appl. Microbiol. Biotechnol. 16 (2014) 6933–6946. doi: 10.1007/s00253-014-5883-4
-
[121]
Y.F. Velázquez, P.M. Nacheva, Environ. Sci. Pollut. Res. 24 (2017) 6779–6793. doi: 10.1007/s11356-017-8413-y
-
[122]
H. Li, M.W. Sumarah, E. Topp, Sci. Total Environ. 452-453 (2013) 296–301. doi: 10.1016/j.scitotenv.2013.02.080
-
[123]
L.Q. Shen, E.S. Beach, Y. Xiang, et al., Environ. Sci. Technol. 45 (2011) 7882–7887. doi: 10.1021/es201392k
-
[124]
G. Gasser, I. Pankratov, S. Elhanany, et al., Chemosphere 88 (2012) 98–105. doi: 10.1016/j.chemosphere.2012.02.074
-
[125]
P. Falås, A. Wick, S. Castronovo, et al., Water Res. 95 (2016) 240–249. doi: 10.1016/j.watres.2016.03.009
-
[126]
S. Rühmland, A. Wick, T.A. Ternes, et al., Ecol. Eng. 80 (2015) 125–139. doi: 10.1016/j.ecoleng.2015.01.036
-
[127]
L.J.G. Silva, A.M.P.T. Pereira, L.M. Meisel, et al., Environ. Pollut. 197 (2015) 127–143. doi: 10.1016/j.envpol.2014.12.002
-
[128]
J. Maculewicz, D. Kowalska, K. Świacka, et al., Sci. Total Environ. 802 (2022) 149916. doi: 10.1016/j.scitotenv.2021.149916
-
[129]
C.J.E. Davey, M.H.S. Kraak, A. Praetorius, et al., Water Res. 222 (2022) 118878. doi: 10.1016/j.watres.2022.118878
-
[130]
K.J. Kazi, C.D. English, E. Ivantsova, et al., Environ. Pollut. 361 (2024) 124767. doi: 10.1016/j.envpol.2024.124767
-
[131]
J. Yang, S. Wang, X. Luo, et al., Chin. Chem. Lett. 36 (2025) 110996. doi: 10.1016/j.cclet.2025.110996
-
[132]
F. Ye, W. Sun, K. Pang, et al., Chin. Chem. Lett. 34 (2023) 107755. doi: 10.1016/j.cclet.2022.107755
-
[1]
-
Figure 8 Acute toxicities (a) and chronic toxicities (b) of ATDs and their transformation products to fish, Daphnia and green algae predicted by ECOSAR software.
Table 1. Physicochemical properties of selected ATDs.
Compound CAS Number Structural formula MW pKa LogP logKow logKoc Solubility (mg/mL) Elimination half-life Amitriptyline
(AMI)50-48-6 277.409 9.49 4.926 4.92 / 9.71e-3 25 h Citalopram
(CIT)59729-33-8 24.398 9.38 3.76 1.39 5.63 15.46 35 h Fluoxetine
(FLU)54910-89-3 309.331 10.05 4.05 1.22 4.65 14 1-3 d Sertraline
(SER)79617-96-2 306.235 9.16 5.51 1.37 4.17 3.8 26 h Venlafaxine
(VEN)93413-69-5 277.407 9.50 2.829 3.20 / 572 5±2 h Data obtained and calculated from PubChem ( https://pubchem.ncbi.nlm.nih.gov/ ). 下载: 导出CSV
Table 2. Environmental concentrations of ATDs in different countries.
Compound Area Source of sample Concentration (ng/L) Year Ref. Amitriptyline Brazil WI 141–200 2020 [18] WE n.d.–80 2020 [18] R 157–196 2020 [18] China WI 7.1–47.2 2021 [43] WE 4.7–41.0 2021 [43] WE 3.66–10.0 2024 [47] R n.d.–15.5 2024 [47] Denmark WI n.d.–175 2023 [41] WE 5–447 2023 [41] Greece WI n.d.–93.2 2020 [28] WE n.d.–161.7 2020 [28] WI n.d.–24.0 2022 [48] WR 3.0–17.7 2022 [48] Sweden WI 11–40 2021 [49] WE 17–74 2021 [49] UK WI 68–104 2020 [50] USA WI 67–94 2020 [50] Citalopram Brazil WI 25–467 2020 [18] WE 25–1136 2020 [18] R 25–520 2020 [18] China WI 30.8–98.5 2021 [43] WE 19.3–97.6 2021 [43] WE 30.0–55.3 2024 [47] R n.d.–70.0 2024 [47] Greece WI n.d.–715.6 2020 [28] WE n.d.–172.6 2020 [28] WI n.d.–50.3 2022 [48] WE 14.4–67.8 2022 [48] Denmark WI n.d.–4237 2023 [41] WE 46–766 2023 [41] Iran WI 4.66–2006.27 2022 [16] Portugal R 67.9 2020 [51] Sweden WI 51–220 2021 [49] WE 120–340 2021 [49] UK D 2.26–2.80 2019 [52] WI 287–347 2020 [50] USA WI 165–300 2020 [50] Fluoxetine Brazil WI 25–173 2020 [18] WE 25–160 2020 [18] R n.d.–90 2020 [18] China WI 2.6 2015 [53] S 0.5–3.5 2020 [40] WI 5.9–36.4 2021 [43] WE 5.1–29.4 2021 [43] WI 0.17–0.29 2024 [42] WE 3.98–6.19 2024 [47] R n.d.–11.7 2024 [47] Greece WI n.d.–486.0 2020 [28] WE n.d.–252.5 2020 [28] WI n.d.–124.4 2021 [54] Iran WI 2.5 2022 [16] Portugal R 28.9 2020 [51] Spain WI 102–208 2022 [55] Sweden WI 1.9–13.5 2021 [49] WE 3.7–17.0 2021 [49] UK D 0.27 2019 [52] WI 46–65 2020 [50] Sertraline Brazil WI 236–417 2020 [18] WE 25 2020 [18] China WI 12.9–103.0 2021 [43] WE 7.0–96.7 2021 [43] WE 8.35–9.10 2024 [47] R n.d.–40.0 2024 [47] Greece WI n.d.–102.6 2020 [28] WE n.d.–218.3 2020 [28] WI n.d.–28.2 2021 [54] Iran WI 114.71–417.57 2022 [16] Mexico WI 56–101 2020 [50] Portugal R 5.4 2020 [51] Slovenia WI 525–573 2020 [21] WI 106–123 2020 [21] WE 22.9–26.3 2020 [21] S 8.59–9.97 2020 [56] Sweden WI 8.5–40.0 2021 [49] WE 15.0–62.0 2021 [49] UK WI 69–111 2020 [50] Venlafaxine Canada WI 2550 2021 [46] China S 18.2–27.6 2020 [40] S 0.32–21 2021 [39] WI 40.25–80.40 2022 [57] WE 21–87 2022 [57] WI 14.28–32.82 2024 [42] Denmark WI 381–1125 2023 [41] WE 318–979 2023 [41] Greece WI 100.8–546.1 2019 [29] WI n.d.–389.2 2019 [29] WI n.d.–582.4 2020 [28] WE n.d.–1071 2020 [28] WI 50.6–289.4 2022 [48] WE 113.0–277.2 2022 [48] Iran WI 209.69–566.93 2022 [16] Mexico WI 93–125 2020 [50] Portugal R 641 2020 [51] Spain S 382.4–1005.9 2020 [58] Sweden WI 250–880 2021 [49] WE 400–1100 2021 [49] UK WI 247–319 2020 [50] USA WI 45–247 2020 [50] WI: wastewater treatment plant influent; WE: wastewater treatment plant effluent; R: river water; D: drinking water; S: surface water; n.d.: not detected.
下载: 导出CSV
Table 3. Removal methods and removal efficiency of ATDs in WWTPs.
Compound Elimination method Removal rate (%) HRT (h) Year Ref. Amitriptyline CASS + SBR 23 13.67 + 9.67 2020 [62] Modified A2/O 69 11 2020 [62] UASB 60 / 2020 [18] AS 84.4 / 2020 [18] Citalopram CASS + SBR 38 13.67 + 9.67 2020 [62] Modified A2/O 55 11 2020 [62] Fluoxetine Bioadsorption-bioaccumulation by microalgae biomass >50 24 2020 [58] CASS + SBR 32 13.67 + 9.67 2020 [62] Modified A2/O 45 11 2020 [62] UASB 19.8–78.1 / 2020 [18] Sertraline flow-through bioreactors 91.1–97.4 0.25 2020 [21] AS 89.4 / 2020 [18] Modified A2/O 56 11 2020 [62] MBBR 60 24 2024 [26] Venlafaxine Bioadsorption-bioaccumulation by microalgae biomass >50 24 2020 [58] MBR 38 / 2020 [63] CASS + SBR 6.5 13.67 + 9.67 2020 [62] Modified A2/O −4 11 2020 [62] SMBR 41.8 18 2021 [46] Biodegradation by fungi 70–95 168–2160 2019 [61] AS −100–60 6 2019 [29] CASS: cyclic activated sludge system; SBR: sequencing batch reactor; A2/O: anaerobic-anoxic-oxic biological nitrogen and phosphorus removal process; UASB: up-flow anaerobic sludge blanket; AS: activated sludge; MBBR: moving bed biological reactor; MBR: membrane bioreactor; SMBR: submerged membrane bioreactor.
下载: 导出CSV
-


 扫一扫看文章
计量
- PDF下载量: 0
- 文章访问数: 12
- HTML全文浏览量: 1
 下载:
下载:
