College of Chemistry and Materials, Key Laboratory of Fluorine and Silicon for Energy Materials and Chemistry of Ministry of Education, Jiangxi Normal University, Nanchang 330022, China
* Corresponding authors. E-mail addresses: wusu.qin@163.com (S. Wu)
guiming@jxnu.edu.cn (G. Peng). 1 These authors contributed equally to this work.
Received Date:
09 August 2025 Accepted Date:
21 October 2025 Revised Date:
14 October 2025 Available Online:
15 June 2026
Abstract:
The surface activity and continuous photosynthesis with easy product separation are two main concerns for practical H2O2 photogeneration which calls for integration of efficient photocatalyst with specifically designed reactor. Taking advantage of the intrinsic superior charge separation and electron transfer of the one-dimensional CN, herein, N-vacancy abundant carbon nitride nanorod arrays (CNNRs) were demonstrated as an efficient photocatalyst either in convention photocatalysis or in emerging flow photocatalytic H2O2 production. The N-vacancies multifunctionally enhance light harvesting, elevate conduction band, adsorb and activate O2 molecules. As a result, the N-defective CNNRs delivered 5.2 and 2.1 times higher H2O2 yield in its powder form than common CN nanosheets and defect-free CNNRs, reaching 18.8 mmol g-1 h-1 with AQY of 13.4% at 400 nm in ethanol-containing solution. Moreover, the CNNRs on glass, as a photocatalyst panel, exhibits remarkable fixed-bed and continuous flow photocatalytic H2O2 production performances, with yield up to 23.6 and 14.2 mmol m-2 h-1, respectively. Mechanism investigation discloses the sequential two-step 1e oxygen reduction pathway that accounts for H2O2 photogeneration, with further thermal-dynamical confirmation by DFT calculation. This work introduces a new paradigm by combining photocatalyst design with advanced flow reactors to achieve continuous photosynthesis of H2O2, which may inspire many other photo-to-chemical conversions as well.
As a green oxidant, hydrogen peroxide (H2O2) is extensively used in medical sterilization [1], organic synthesis [2], environment remediation [3-5], and many other fields [6-8]. It is also well known as a promising energy carrier due to its high energy density and ease for transportation [9-12]. However, current H2O2 production mainly depends on the energy-consuming anthraquinone (AQ) process, which generates substantial harmful byproduct [13-15]. Searching for sustainable and low-cost H2O2 production methods has become an urgent and necessary task to scientists. Comparing to direct H2O2 synthesis from H2 and O2 in presence of noble metal catalysts which suffers from high catalyst cost and potential explosion risks [16-19], photocatalytic H2O2 production via two-electron oxygen reduction reaction (ORR) has been emerging as a promising alternative option [20-27]. It has significant advantages in terms of renewable energy driven characteristics, green reagents (H2O and O2), onsite-feasible production processes, low infrastructure requirements [28-32].
Among the various photocatalysts, the metal-free low-cost stable visible light responsive carbon nitride (CN), has received tremendous research interest in 2e ORR for H2O2 photosynthesis [33-35]. Considering the pristine CN has limited 2e ORR performance due to the limited charge transfer, serious electron recombination, and limited surface reaction activity [36-39], various strategies have been adopted to enhance CN's 2e ORR photocatalytic activity, including but not limited to molecularly D-A structure design [40-43], heterojunction engineering [44-49], cocatalyst engineering [50,51], nanostructure manipulation [52,53]. Of these efforts, CN nanostructures with different morphologies possess distinct electronic structure and charge carrier transport properties. The continuous one-dimensional nanostructure has superior charge transport over randomly packed nanoparticles, owing to the reduced grain boundaries, lower charge scattering, and confined electronic structure [54]. This principle fits with CN materials. For example, CN nanorod arrays with -C≡N functionalization and K-doping show enhanced charge separation and light absorption [55]. Carbon-doped 1D carbon nitride strips possess an extensive π-electron conjugated system, while the porous architecture could enhance charge and mass transfer, and provide abundant active sites [56]. Lin et al. reported oxygen-doped one-dimensional porous CN microtubes with remarkable photocatalytic CO2 reduction performance due to their unique structural advantages [57]. All these studies highlight the advantages of one-dimensional CN nanostructures in promoting charge transport and separation, thereby enhancing the overall photocatalytic performance of carbon nitride materials.
In addition, the complicated catalyst recovery procedures and catalyst aggregation after use are common problems for CN suspension based photocatalysis. Fortunately, due to the immobilized state of the photocatalyst in fixed-bed photoreactor or flow photoreactor which instantly separate the product from catalyst surface by the flowing solution, they are envisioned to overcome the above problems. The requisite for this strategy is immobilizing CN catalyst onto an appropriate support material. For instance, the polypentadecalactone matrix loaded with CN achieved excellent photodegradation of methylene blue under flow conditions [58]. Shalom et al. reported CN film on glass slide serving as a continuous-flow photoreactor which demonstrated good H2O2 production, HMF oxidation, and water purification performances [59]. Erwin Reisner et al. developed CNx/Ni2P photocatalyst panel via drop-casting, and achieved continuous photocatalytic water splitting and fast catalyst recovery [60].
Herein, we integrated 1D CN nanorods' (CNNRs) advantageous charge carrier dynamics with the merits of continuous-flow photocatalysis for efficient H2O2 photosynthesis. Uniform CN nanorod arrays on glass slide were synthesized via chemical vapor deposition (CVD) with tailored N-vacancy density and tunable photophysical properties. N-vacancies were introduced into CNNRs by elevating the synthesis temperature, which uplifted the conduction band position and increased the 2e ORR ability. Concurrently, the thermal condensation of melamine-cyanuric acid supramolecular extends the optical absorption range while synergistically promoting charge separation and electron transfer kinetics [61,62]. The CNNRs showcases multiple photocatalytic application modes, either in the powder form or as an integrity of photocatalyst panel. H2O2 production experiments by N-defective CNNR600 (synthesized at 600 ℃) powder dispersion demonstrated 5.2 times-higher H2O2 yield than defective-free CNNRs, reaching a high value of 18.8 mmol g-1 h-1 in ethanol containing solution. Besides, it presents excellent fixed-bed H2O2 photosynthesis performance either in static or flowing photocatalysis condition, with H2O2 yields of 23.6 and 14.2 mmol m-2 h-1, respectively. Experimental investigations and DFT calculations proved the two-step 1e ORR pathway.
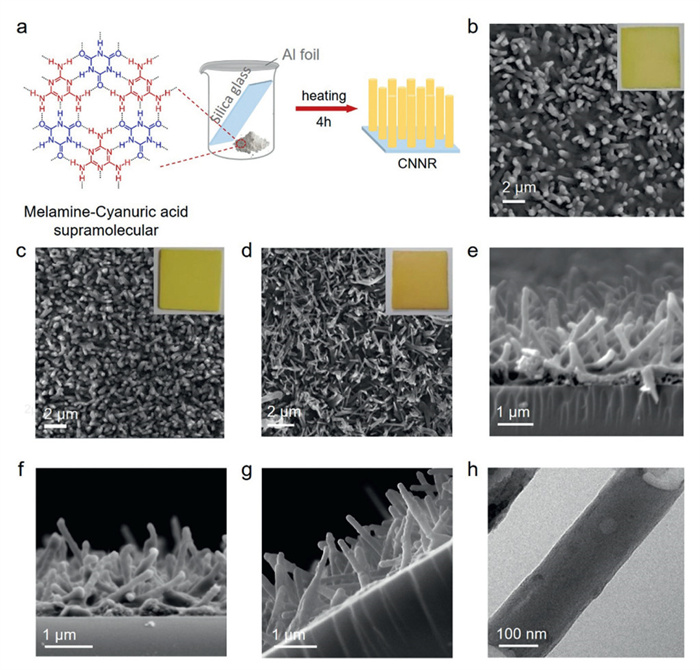
The uniform CNNR arrays on glass slide were synthesized by a thermal vapor deposition process in air atmosphere by using melamine-cyanuric acid supramolecular assembly as monomer (Fig. 1a). The detailed procedures are provided in Supporting information. The CNNR synthesized at 500, 550 and 600 ℃ are denoted as CNNR500, CNNR550, CNNR600, respectively. It is observed that the obtained CNNR film presents darker yellowish color at higher synthesis temperature (insets in Figs. 1b-d). Scanning electron microscopy (SEM) images show the 1D nanorod morphology of all CNNRs (Figs. 1b-g). However, it appears that the diameter decreases from ~300 nm for CNNR500 to ~130 nm for CNNR600. The cross-section SEM shows that all CNNRs share similar length of ~1.5 μm (Figs. 1e-g). Note that the unique nanorod morphology of CNNR is different from the amorphous irregular CN powder (PCN) (Fig. S1 in Supporting information), which was synthesized by direct thermal transformation of the melamine-cyanuric acid supramolecular, implying the inducing effect of the glass slide substrate to the formation of 1D nanoarchitecture [63]. Besides, the individual use of melamine or cyanuric acid as precursor during CVD process also yielded non-1D structures but randomly distributed CN particles (Fig. S2 in Supporting information). Transmission electron microscopy (TEM) image further confirms the nanorod structure of CNNR600 with diameter of ~130 nm (Fig. 1h).
Figure 1
Figure 1.
Synthesis and morphologies of CNNRs. (a) Scheme of the synthesis of CNNR. Top-view SEM images of CNNR500 (b), CNNR550 (c), and CNNR600 (d). (Insets are corresponding catalyst photos). Cross-section SEM images of CNNR500 (e), CNNR550 (f), and CNNR600 (g). (h) TEM image of CNNR600.
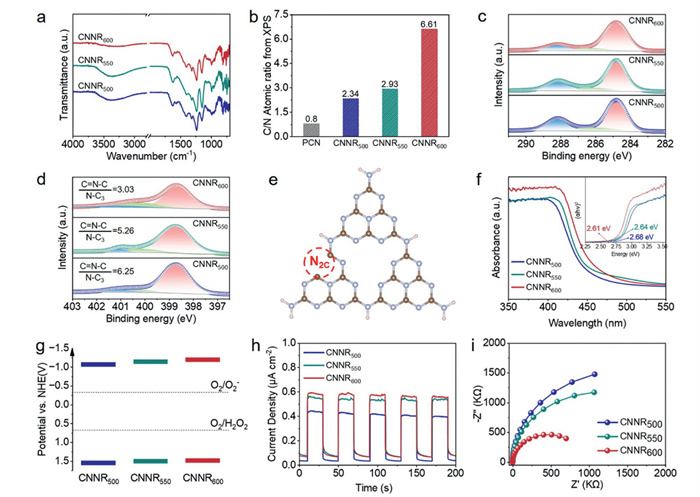
X-ray diffraction (XRD) patterns showed a broad (002) diffraction peak at 27.5° for all CNNRs, while the (001) diffraction peak at 13.1° is absent by comparing to CN powder (Fig. S3 in Supporting information) [64]. Fourier-transform infrared (FTIR) spectroscopy exhibits characteristic bands of CN. The peak at 812 cm−1 corresponds to the out-of-plane bending vibration of heptazine units, while the peaks in the range of 1200–1600 cm−1 are associated with the stretching modes of C—N in heterocycles (Fig. 2a and Fig. S4 in Supporting information). It is observed that the -NHx peak at 3200–3500 cm−1 decreases from CNNR500 to CNNR600 (Fig. 2a), suggesting higher temperature synthesis led to removal of -NHx groups [65]. In addition, X-ray photoelectron spectroscopy (XPS) survey results indicate CNNR600 has higher surficial C/N ratio (6.61 for CNNR600vs. 2.93, 2.34, 0.8 for CNNR550 and CNNR500, respectively) (Fig. 2b). All C/N ratios for CNNRs obtained from XPS survey are higher than PCN (0.8). More accurately, elemental analysis (EA) results which reflect the body element composition further confirm higher C/N atomic ratio in CNNR600 (0.67) than CNNR500 (0.65). The higher carbon content in CNNRs would benefit electron transfer and charge separation. The high-resolution C 1s XPS spectra (Fig. 2c and Fig. S5 in Supporting information) presents three peaks at 288.2, 286.3, and 284.8 eV, corresponding to N=C—N, C—NHx, and C—C/C=C, respectively. In consistence with higher C/N ratio in CNNR600, it shows stronger C—C/C=C peak in C 1s XPS (Fig. 2c). Moreover, different from C 1s XPS of PCN (Fig. S5), the CNNRs showed a dominant C—C/C=C peak in C 1s XPS rather than N=C—N peak [65]. N 1s XPS spectra (Fig. 2d) display three resolved peaks at 398.7, 400.2 and 401 eV, assigned to C—N=C, N—C3 and C—NHx, respectively. It is worthy to point out that the C=N—C/N—C3 ratio for CNNR600 (3.03) is significantly lower than CNNR500 (6.25), CNNR550 (5.26), and PCN (7.69) (Fig. 2d and Fig. S6 in Supporting information), suggesting higher temperature synthesis creates more C=N—C (N2C) vacancies in CNNR surface (Fig. 2e), in consistence with temperature effect on other CN material [37,66]. Another solid evidence for more N-vacancies in CNNR600 is its enhanced electron paramagnetic resonance (EPR) spectroscopy intensity (Fig. S7 in Supporting information). Further attempt to introduce more N2C vacancies in CNNR by synthesis at > 600 ℃ is limited by the deformation property of glass slide substrate.
Figure 2
Figure 2.
Chemical structure and photophysical properties characterizations of CNNRs. (a) FTIR spectra. (b) The C/N atomic ratios obtained from XPS survey. (c) XPS C 1s spectrum. (d) XPS N 1s spectrum. (e) The proposed N-defective chemical structure of CNNR600. (f) UV–vis spectra. Insets are the Tauc plots. (g) Bandgap diagrams. (h) Photocurrent response. (i) Nyquist plots.
UV–vis absorption spectra show that CNNR600 has a red-shifted absorption edge because of the introduced N-vacancies and C-rich structure (Fig. 2f) [65]. Correspondingly, their bandgaps are 2.68, 2.64, and 2.61 eV for CNNR500, CNNR550, and CNNR600, respectively. Comparing to PCN synthesized at 600 ℃, CNNR600 has significantly stronger light absorption (Fig. S8 in Supporting information), which should be a result of incident photon reflection and scattering across the ordered nanorod arrays. Combined with Mott–Schottky measurements which reflects the conduction band (flat band) positions (Fig. S9 in Supporting information), the bandgap diagrams of CNNRs are found straddling over the redox potentials of O2/O2-, O2/H2O2 (Fig. 2g), suggesting their potential in 2e photocatalytic oxygen reduction way to synthesize H2O2. Relative to that of CNNR500, CNNR550 and CNNR600 demonstrated upward-lifted conduction band position (Fig. 2g), meaning their stronger photocatalytic oxygen reduction ability. Apart from modulating the energy bandgap structure, the nanorod architecture is anticipated to accelerate the charge separation dynamics. Evidently, all CNNRs demonstrate much lower photoluminescence (PL) intensity than PCN, while CNNR600 has the lowest because of C-doping and the presence of N-vacancies (Fig. S10 in Supporting information) [52]. In consistence, transient photocurrent measurements under on/off 1-SUN illumination verify that CNNRs generate higher photocurrents when synthesis temperature gets higher and all those for CNNRs are higher than PCN (Fig. 2h and Fig. S11 in Supporting information) [67,68]. Electrochemical impedance spectroscopies (EIS) indicate their charge transfer resistances follow the trend of PCN > CNNR500 > CNNR550 > CNNR600 (Fig. 2i and Fig. S12 in Supporting information). All these evidences support CNNRs have superior charge separation and electron transfer over random CN nanosheets, and CNNR600 outperforms other two CNNRs because of the more N-vacancies and C-rich structure [69].
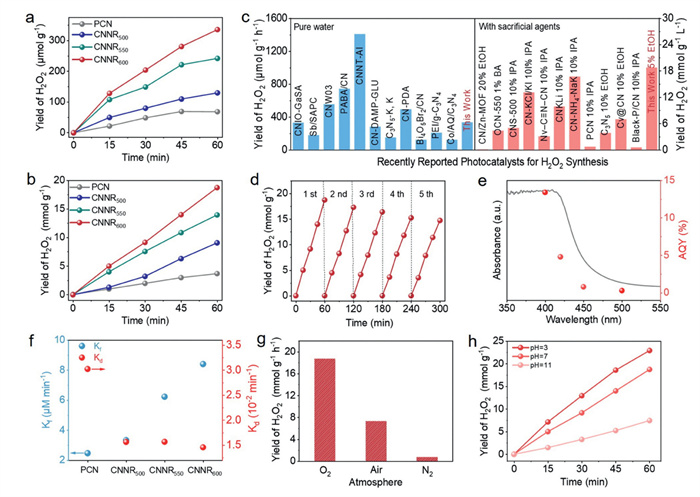
The excellent photophysical properties of the CNNRs pave the way for their photocatalytic application. To demonstrate this, we firstly performed the photocatalytic H2O2 production in water in O2 atmosphere under 2-SUN illumination using CNNR powders as photocatalysts which were collected by peeling off from the glass slide. The H2O2 concentration was monitored by the peroxidase colorimetric method coupled with a standard concentration-absorption plot (Fig. S13 in Supporting information) [33]. It was observed that all CNNRs delivered much higher H2O2 production activities in water than PCN (Fig. 3a). Specifically, CNNR600 shows a highest H2O2 yield of 336 μmol g-1 h-1, higher than CNNR550 (242 μmol g-1 h-1) and CNNR500 (130 μmol g-1 h-1), and about five folds as that of PCN (69 μmol g-1 h-1) (Fig. 3a). While in 5% ethanol aqueous solution, the H2O2 production rate is further boosted to 18.8 mmol g-1 h-1 by CNNR600, comparing to 3.6 mmol g-1 h-1 by PCN (Fig. 3b). To the best of our knowledge, both performances of CNNR600 outperform most previously reported CN based photocatalysts under similar conditions (Fig. 3c and Table S1 in Supporting information). This high H2O2 production performance maintained over continuous successive cycling tests (Fig. 3d). The AQY tests showed high values of 13.4% and 4.8% at 400 and 420 nm, respectively (Fig. 3e and Table S2 in Supporting information). Furthermore, the formation rate constant (Kf) and decomposition rate constant (Kd) were analyzed following the equation [H2O2] = (Kf/Kd){1-exp(-Kdt)} [70]. Results showed that all CNNRs possess advantageous Kf than PCN, while PCN has > 2 times-higher Kd (Fig. 3f). CNNR600 exhibited 3.4 times higher Kf (8.41 μmol L-1 min-1) than PCN, however, with reduced Kd (0.015 min-1 for CNNR600vs. 0.03 min-1 for PCN) (Fig. 3f). This indicates CNNRs not only exhibit accelerated H2O2 formation kinetics but also suppress the decomposition of H2O2, and accounts for the superior H2O2 production performance of CNNRs to PCN. In addition, the Kf increases from CNNR500 to CNNR600 while their Kd slightly decreases, probably because of more introduced N-vacancies. Control experiments in air led to a substantial decrease in H2O2 yield while in N2 atmosphere showed almost no H2O2 generation (Fig. 3g), implying the underlying oxygen reduction reaction (ORR). Photocatalytic H2O2 production in ethanol solution of different pH demonstrated that acidic media significantly enhances H2O2 synthesis, achieving a yield of 22.9 mmol g-1 h-1 (vs. 18.8 mmol g-1 h-1 for pH 7 vs. 7.4 g-1 h-1 for pH 11) (Fig. 3h). This finding indicates the photosynthesis of H2O2 by CNNR600 proceeds via a proton-coupled electron transfer process [71].
Figure 3
Figure 3.
Evaluation of H2O2 photogeneration performances. (a) H2O2 production in water. (b) H2O2 production in 5% ethanol aqueous solution. (c) Statistic of H2O2 yields by carbon nitride based photocatalysts. (d) Cycling tests of H2O2 production by CNNR600 in ethanol solution. (e) AQY in ethanol solution. (f) H2O2 formation rate constants and H2O2 decomposition rate constants. (g) H2O2 production in different atmosphere. (h) H2O2 production in ethanol solution of different pH.
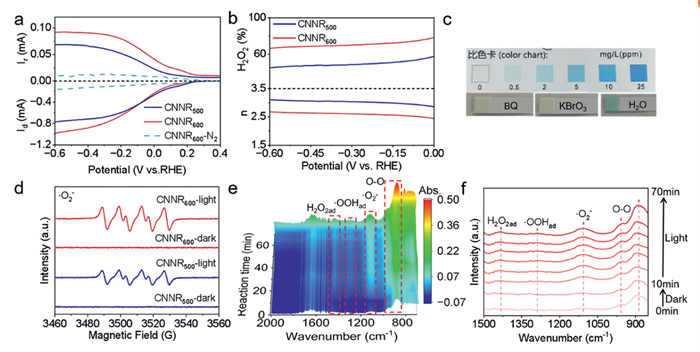
Rotating ring-disk electrode (RRDE) tests under O2 atmosphere witness obvious reduction current increase starting 0.3 V vs. RHE and establishes a lower plateau in range of 0–0.3 V. Further lowering the potential leads to another more prominent saturated reduction current step in range of −0.6~0 V (Fig. 4a). Note that there is no obvious reduction current in N2 atmosphere (Fig. 4a), as well as negligible current generated by bare glassy carbon electrode (Fig. S14 in Supporting information). This sharp comparison suggests ORR takes place on CNNR600 electrode. The ring current which manifested as H2O2 oxidation current evolves and follows the same trend as the disk current (Fig. 4a), confirming the production of H2O2 on surface of CNNR600 during this process. The higher disk and ring currents of CNNR600 than CNNR500 accords with CNNR600's higher H2O2 production performance. The electron transfer number (n) during ORR was obtained by the relationship between disk current (Id) and ring current (Ir): n = 4 Id/(Id + Ir/N), where N denotes collection efficiency [71]. Results show that the electron transfer number for CNNR600 is below 2.6 in the whole investigated potential range, while CNNR500 has higher n but still below 3.2 (Fig. 4b), indicating their preferable 2e ORR pathway. The H2O2 production selectivity of CNNR600 is > 65% while that of CNN500 is below 50% (Fig. 4b).
Figure 4
Figure 4.
H2O2 photogeneration process study. (a) RRDE voltammograms in O2 saturated solution. (b) Electron transfer number and H2O2 selectivity. (c) Colorimetric strip test with addition of different scavengers during photocatalytic H2O2 production. (d) EPR signals of DMPO-•O2-. (e) 3D color contour of in-situ FTIR. (f) In-situ FTIR spectra of CNNR600 during H2O2 photogeneration.
Since ethanol is an efficient hole sacrificial agent, the soaring H2O2 yield in ethanol-containing solution highlights the central role of photogenerated electrons in the photocatalytic H2O2 production process. To better reveal the 2e ORR process, colorimetric analysis via H2O2 test strips revealed that both KBrO3 and 1,4-benzoquinone (BQ), acting as electron and ·O2- scavengers individually, significantly inhibited H2O2 generation (Fig. 4c) [72,73]. EPR spectra were recorded using 5,5-dimethyl-1-pyrroline N-oxide (DMPO) as a spin trap under both visible-light irradiation and dark conditions. CNNR600 exhibits much stronger DMPO-·O2- adduct signals than CNNR500, confirming the ·O2- generation and stronger O2 activation by CNNR600 (Fig. 4d). In situ FTIR spectroscopy directly showed up the evolution of key intermediates signals during H2O2 photogeneration (Figs. 4e and f, and Fig. S15 in Supporting information). The increasing peaks at 888 and 965 cm−1 indicate effective O2 adsorption. Simultaneously, the ·O2- peak at 1100 cm−1 increased over time [74], verifying the generation of ·O2- in process of H2O2 photogeneration. The tiny peak at 1280 cm−1 is attributed to the vibration of ·OOH [46]. In addition, there appears a growing peak at 1435 cm−1, which is ascribed to the accumulation of ·HOOH species on the catalyst surface as photocatalysis progressed [75]. Combined all the pre-discussed evidences with this sequential spectroscopic fingerprint—directly observing ·O2- formation followed by proton-coupled reduction to ·OOH and ·HOOH, they constitute decisive evidences for the two-step 1e oxygen reduction pathway: O2 + e⁻ → ·O2⁻; ·O2⁻ + H⁺ + e⁻ → ·OOH; ·OOH + H⁺ + e⁻ → H2O2, which governs the H2O2 photosynthesis on surface of CNNR600.
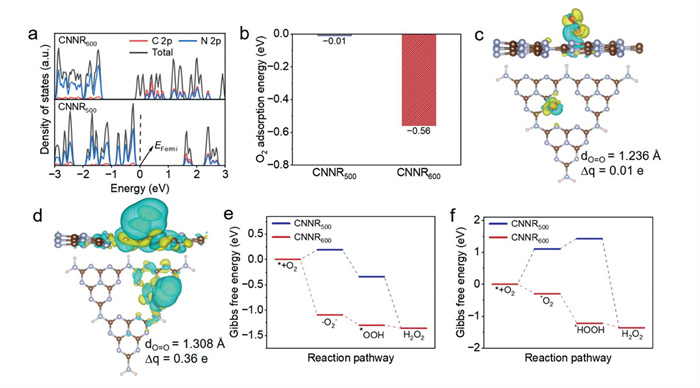
To better understand the role of N-vacancies (Nv) in CNNR600 in H2O2 photogeneration, density functional theory (DFT) calculations were adopted to disclose the electronic structure and H2O2 production mechanism. The structure models in Fig. S16 (Supporting information) and Fig. 2e were used to represent CN structures without (CNNR500) and with N2C vacancies (CNNR600). Density of states (DOS) analysis reveals that the conduction bands of both CNNR500 and N-defective CNNR600 are composed of N 2p orbitals, while the valence bands are contributed by both C 2p and N 2p orbitals (Fig. 5a) [52]. The introduction of N-vacancies reduces the bandgap and negatively shifts the conduction band of CNNR600 (Fig. 5a), which is in consistence with the experimental finding (Fig. 2g). The photogenerated electrons on more negative conduction band thermodynamically favors ORR. Concurrently, the N-vacancy site shows favorable O2 adsorption with lower adsorption energy (Fig. 5b and Fig. S17 in Supporting information). The Bader charge analysis indicates there is more electron transfer from N-defective CN to O2 molecule than from defect-free CN (0.36e vs. 0.01e, Figs. 5c and d). As a result, the O2 molecule adsorbed at the N2C vacancy site displays longer O=O bond (1.308 Å), meaning effective activation. The Gibbs free energy calculation shows that, comparing to the defect-free CNNR500 possesses positive energy barrier (0.19 eV) in ·O2- generation, N-vacancies abundant CNNR600 displays thorough down-hill two-step one-electron ORR pathway in H2O2 formation (Fig. 5e). Though the free energy diagram of one-step two-electron ORR pathway also demonstrates a downhill route (Fig. 5f), the more exoergic ·O2⁻ formation in two-step one-electron pathway (ΔG = −1.09 eV, Fig. 5e) than *HOOH formation (ΔG = −0.92 eV, Fig. 5f) in one-step two-electron pathway make it more preferable to follow the two-step one-electron pathway [76].
Figure 5
Figure 5.
DFT studies of CNNR500 and CNNR600 for H2O2 photogeneration. (a) Calculated density of states. (b) O2 adsorption energy. (c, d) Top-view and side-view of charge density differences after O2 absorption (isosurface value is 0.001 e/Å3) on (c) defect-free CNNR500 and (d) N-defective CNNR600. The yellow and cyan regions represent electron gaining and losing, respectively. Grey balls represent N atoms while brown balls represent C atoms. (e) Gibbs free energy diagrams for two-step 1e− ORR pathway and (f) one-step 2e− ORR pathway.
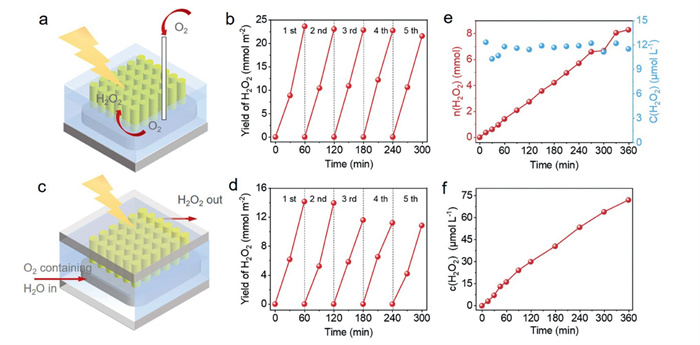
Besides functioning as powder catalyst, the CNNR600 grown on glass slide is a good photocatalyst panel for fixed-bed and flow photocatalysis, which would simplify the product separation and catalyst recovery and thus greatly reduce the H2O2 synthesis cost. Fig. 6 shows the H2O2 photosynthesis by the CNNR600 panel in static and flowing 5% ethanol solution. In static condition, the CNNR600 catalyst panel delivered a H2O2 yield of 23.6 mmol m-2 h-1 with good long-term stability (Figs. 6a and b). This yield is equivalent to 20.93 mmol g-1 h-1, which is higher than that of CNNRs powder-based yield (18.74 mmol g-1 h-1), indicating the advantageous CNNR panel form and flow photocatalysis mode over the powder suspension thanks to the well aligned structure and fast product separation. The CNNR600 panel can be easily lifted off the solution and then back into next round photocatalysis experiment. In addition, as a proof-of-concept, we assembled the CNNR600 panel in a fixed-bed flow photocatalysis reactor (Fig. 6c and Fig. S18 in Supporting information). It is observed that this flow photocatalysis reactor efficiently generates H2O2 at yield of 14.2 mmol m-2 h-1 (Fig. 6d). The lower yield in flow photocatalysis condition than in static condition could be aroused by the lower O2 concentration since there is no continuous O2 bubbling to saturate the flowing solution over CNNR600 surface but with merely naturally dissolved O2. By refreshing the solution, the as assembled flow-reactor demonstrated relatively stable flow photocatalytic H2O2 production over cycling test, with H2O2 yield slightly decreased from 14.2 mmol m-2 h-1 to 11.1 mmol m-2 h-1 after 5 successive tests (Fig. 6d). In addition, we monitored the H2O2 concentration in the downstream solution of a continuous flow reaction system over six hours. It was found that the H2O2 concentration in the outlet solution almost remains constant at 12 ± 0.5 μmol/L and thus with linear increase in the overall produced H2O2 (Fig. 6e). Though the concentration of the output H2O2 solution is low, the higher concentrated H2O2 solution can be obtained by circulating the reaction solution (Fig. 6f). For this purpose, apparently, the concentration of H2O2 monotonically increases over reaction time and reaches 72.1 μmol/L after 6 h (Fig. 6f). The above H2O2 photogeneration occasions demonstration suggests the CNNR600 photocatalyst panel has promising practical potential in fix-bed and continuous flow photoproduction of H2O2. After H2O2 photosynthesis, the morphology and chemical structure of CNNR600 remained intact with no prominent change (Figs. S19-S22 in Supporting information).
Figure 6
Figure 6.
Application of CNNR600 film in fixed bed and continuous-flow photocatalytic H2O2 production. (a) Scheme and (b) H2O2 production yield for fixed bed photocatalytic. (c) Scheme for continuous-flow photocatalytic H2O2 production. (d) H2O2 production test in continuous-flow photocatalysis. (e) Monitoring of the H2O2 concentration and total generated H2O2 in the outlet solution. (f) H2O2 concentration evolution when circulating the reaction solution in flow photocatalysis.
In summary, CN nanorods arrays on glass slide with tailored N-vacancies were demonstrated as good photocatalyst in conventional and emerging flow photocatalytic H2O2 production in this study. The one-dimensional morphology and designed N-vacancies endow with enhanced light absorption and superior charge separation and electron transfer. Besides, the introduction of N-vacancies uplifts the conduction band position and enhances the 2e ORR ability. Consequently, the N-defective CNNR600 powder delivered a H2O2 yield of 336 μmol g-1 h-1 in water, while in ethanol solution it is up to 18.8 mmol g-1 h-1 with AQY of 13.4% and 4.8% at 400 and 420 nm, respectively. Moreover, the N-defective CNNRs arrays can be used as photocatalyst panel in fixed bed photocatalysis and flow photocatalysis, which effectively overcomes the conventional mass transfer limitations and achieves instant product separation and catalyst recycling. The H2O2 yields in static and flow photoreactor are up to 23.6 mmol m-2 h-1 and 14.2 mmol m-2 h-1, respectively. The mechanism investigations indicate the N-defective CNNRs undergo a two-step 1e ORR process, while DFT studies reveal the key role of N-vacancies in selectively O2 adsorption and activation which subsequently proceeds with thermal-dynamically favorable step-wise proton-coupled electron addition to form H2O2 molecule. This work not only advances the fundamental understanding of CN nanorods in photosynthesis of H2O2 but also integrates material design with the emerging flow reactor for practical sustainable photosynthesis of H2O2.
This work is supported by Natural Science Foundation of China (No. 22462012), Natural Science Foundation of Jiangxi Province for Distinguished Young Scholars (No. 20224ACB213003), Natural Science Foundation of Jiangxi Province (No. 20252BAC250026), "Double Thousand Plan" of Jiangxi Province (No. jxsq2023101109), and Jiangxi Normal University.
Supplementary materials
Supplementary material associated with this article can be found, in the online version, at doi:10.1016/j.cclet.2025.112004.
[1]
E. Brillas, I. Sirés, M.A. Oturan, Chem. Rev. 109 (2009) 6570–6631. doi: 10.1021/cr900136g
[2]
X. Sun, J. Yang, X. Zeng, et al., Angew. Chem. Int. Ed. 63 (2024) e202414417. doi: 10.1002/anie.202414417
[3]
Z. Lu, G. Chen, S. Siahrostami, et al., Nat. Catal. 1 (2018) 156–162. doi: 10.1038/s41929-017-0017-x
[4]
Z. Wei, M. Liu, Z. Zhang, et al., Energy Environ. Sci. 11 (2018) 2581–2589. doi: 10.1039/c8ee01316k
[5]
J. Xu, X. Zheng, Z. Feng, et al., Nat. Sustain. 4 (2021) 233–241. doi: 10.54691/bcpbm.v13i.88
[6]
S.C. Perry, D. Pangotra, L. Vieira, et al., Nat. Rev. Chem. 3 (2019) 442–458. doi: 10.1038/s41570-019-0110-6
W. Hou, H. Guo, M. Wu, L. Wang, ACS Nano 17 (2023) 20560–20569. doi: 10.1021/acsnano.3c07411
[68]
Y. Che, K. Wang, C. Wang, et al., J. Mater. Sci. Technol. 243 (2026) 228–236.
[69]
Y. Cong, S. Zhang, Q. Zheng, et al., J. Colloid Interface Sci. 650 (2023) 1013–1021. doi: 10.1016/j.jcis.2023.07.075
[70]
J. Cheng, W. Wang, J. Zhang, et al., Angew. Chem. Int. Ed. 63 (2024) e202406310.
[71]
Z. Li, Y. Zhou, Y. Zhou, et al., Nat. Commun. 14 (2023) 5742.
[72]
L. Yang, G. Dong, D.L. Jacobs, et al., J. Catal. 352 (2017) 274–281.
[73]
X. Lin, X. Peng, S. Wu, et al., ChemCatChem 17 (2025) e202401408.
[74]
C. Shu, X. Yang, L. Liu, et al., Angew. Chem. Int. Ed. 63 (2024) e202403926.
[75]
H. Xie, J. Fu, J. Liu, et al., Adv. Funct. Mater. 34 (2024) 2411457.
[76]
S. Zhou, W. Chen, L. Kan, et al., Angew. Chem. Int. Ed. 64 (2025) e202508436.
Figure 1
Synthesis and morphologies of CNNRs. (a) Scheme of the synthesis of CNNR. Top-view SEM images of CNNR500 (b), CNNR550 (c), and CNNR600 (d). (Insets are corresponding catalyst photos). Cross-section SEM images of CNNR500 (e), CNNR550 (f), and CNNR600 (g). (h) TEM image of CNNR600.
Figure 2
Chemical structure and photophysical properties characterizations of CNNRs. (a) FTIR spectra. (b) The C/N atomic ratios obtained from XPS survey. (c) XPS C 1s spectrum. (d) XPS N 1s spectrum. (e) The proposed N-defective chemical structure of CNNR600. (f) UV–vis spectra. Insets are the Tauc plots. (g) Bandgap diagrams. (h) Photocurrent response. (i) Nyquist plots.
Figure 3
Evaluation of H2O2 photogeneration performances. (a) H2O2 production in water. (b) H2O2 production in 5% ethanol aqueous solution. (c) Statistic of H2O2 yields by carbon nitride based photocatalysts. (d) Cycling tests of H2O2 production by CNNR600 in ethanol solution. (e) AQY in ethanol solution. (f) H2O2 formation rate constants and H2O2 decomposition rate constants. (g) H2O2 production in different atmosphere. (h) H2O2 production in ethanol solution of different pH.
Figure 4
H2O2 photogeneration process study. (a) RRDE voltammograms in O2 saturated solution. (b) Electron transfer number and H2O2 selectivity. (c) Colorimetric strip test with addition of different scavengers during photocatalytic H2O2 production. (d) EPR signals of DMPO-•O2-. (e) 3D color contour of in-situ FTIR. (f) In-situ FTIR spectra of CNNR600 during H2O2 photogeneration.
Figure 5
DFT studies of CNNR500 and CNNR600 for H2O2 photogeneration. (a) Calculated density of states. (b) O2 adsorption energy. (c, d) Top-view and side-view of charge density differences after O2 absorption (isosurface value is 0.001 e/Å3) on (c) defect-free CNNR500 and (d) N-defective CNNR600. The yellow and cyan regions represent electron gaining and losing, respectively. Grey balls represent N atoms while brown balls represent C atoms. (e) Gibbs free energy diagrams for two-step 1e− ORR pathway and (f) one-step 2e− ORR pathway.
Figure 6
Application of CNNR600 film in fixed bed and continuous-flow photocatalytic H2O2 production. (a) Scheme and (b) H2O2 production yield for fixed bed photocatalytic. (c) Scheme for continuous-flow photocatalytic H2O2 production. (d) H2O2 production test in continuous-flow photocatalysis. (e) Monitoring of the H2O2 concentration and total generated H2O2 in the outlet solution. (f) H2O2 concentration evolution when circulating the reaction solution in flow photocatalysis.

 DownLoad:

 下载:
下载:


 下载:
下载:
