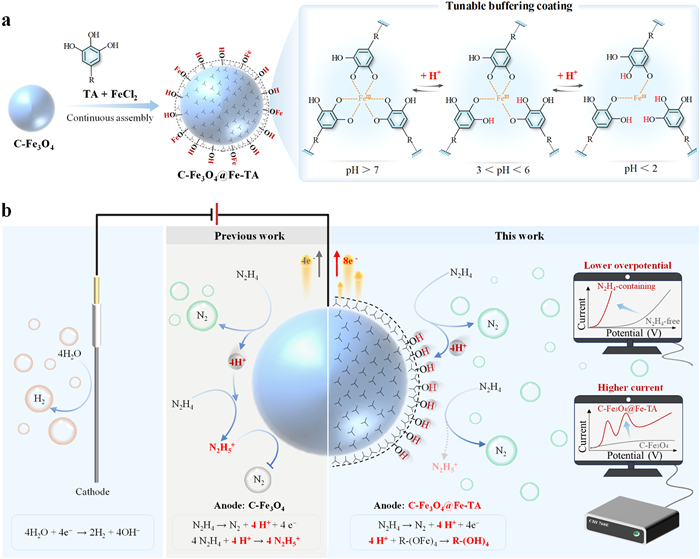
Figure 1.
(a) Local buffering mechanism of C-Fe3O4@Fe-TA, and (b) schematic illustrations of C-Fe3O4@Fe-TA in the hydrazine-assisted hydrogen production and the electrochemical hydrazine detection.

Towards reducing the overpotential of C-Fe3O4 in electrochemical hydrazine oxidation with Fe-TA coordination complexes as a tunable buffering coating
Jing Feng , Jing He , Qinling Liu , Qin Chen , Qin Deng , Yunxiang He , Yajing Zhang , Zhenju Jiang , Xinghua Zhu , Junling Guo


Hydrazine oxidation reaction (HzOR) is widely used in the energy and environmental fields, because of its advantages such as the simultaneous hydrogen production and hydrazine elimination, the ultralow theoretical potential for energy-efficient hydrogen production, the zero carbon emission, and avoiding forming the explosive mixture [1,2]. HzOR was applied as the anode reaction in direct hydrazine fuel cells and a promising form of new energy source for mobile device for the superiority of carbon-free nature and less catalyst poisoning [3]. Furthermore, HzOR as a substitute for oxygen evolution reaction can result in greatly reduced energy consumption for hydrogen production, avoid the formation of explosive hydrogen/oxygen mixtures, and make high-efficiency membrane-less water electrolysis reactors possible [4]. As an important chemical intermediate for plastic foam blowing agents, pesticides and pharmaceutical products, hydrazine could inadvertently be released into the environment and thus become a severe environmental pollutant [5]. The electrochemical HzOR is also a classical determination for highly virulent hydrazine, which overcomes a critical limitation of the toxicity and secondary pollution of additive in optical methods, allowing real-time and on-line analyses [6].
HzOR was reported to follow the four-electron process over wide range of pH conditions (N2H5+ → N2 + 5H+ + 4e−; N2H4 → N2 + 4H+ + 4e−) [7]. Although the four-electron process is thermodynamically favorable, HzOR is kinetically slow with a significant overpotential at most electrodes. For the above applications, the HzOR overpotential needs to be as low as possible to deliver a high-power density, which drives the need for the design of suitable electro-catalytic anode materials. The protons released in the four-electron process would interfere with the electrode reaction by altering the local solution pH and shifting the N2H4/N2H5+ equilibrium adjacent to the electrode. On glassy carbon electrode, HzOR releases four protons per molecule which are diffusing away from the electrode to rapidly protonate unreacted N2H4 molecules converting them into the electro-inactive form N2H5+; the reaction is self-inhibiting [8]. On palladium nanoparticle, both N2H4 and N2H5+ are electro-active; however, the rate determining steps are also strongly pH-dependent [9]. Without the kinetic considerations, the working potential of N2/N2H4 electrode would also be enhanced by 59.2 mV theoretically when the proton concentration in the electric double layer (EDL) adjacent to the electrode increased to 10 times. Therefore, an efficient HzOR electrode should have abundant adsorption sites for the hydrazine and sufficient proton-buffering capacity originating from weak acids and their conjugated bases to alleviate the drastic pH change in EDL.
The current strategies such as heteroatom doping, strain/defect engineering, and heterojunction construction were used to regulate the electronic structure and the adsorption/desorption ability and effectively promote the activity of anode materials [10]. For instance, researchers have modified the surface electronic state of catalyst by doping heteroatoms and thus optimized the reactant adsorption and product desorption, including non-noble metals, noble metals, and non-metals [11]. Researchers also found that the appropriate compressive strain and the cationic defect could efficiently adjust the d-band center of metal catalyst, thereby matching the appropriate adsorption strength and reducing the energy barrier of the HzOR [12]. Furthermore, by constructing phase heterojunctions, hybrid catalysts could generate synergistic effect between distinct components due to the presence of abundant nanoscale interfaces within hybrid catalysts [13,14]. However, the HzOR overpotential on the electrodes has not been studied from the perspective of effectively reducing the concentration and resistance overpotential. The "nano-buffering effect" and application of HzOR-electrode have limitations relating to the difficulties in designing and synthesizing the tunable buffering structure that can be readily integrated within the existing electrode materials.
Metal-polyphenolic networks (MPNs) have garnered significant interest across various research fields because of their good compatibility, pH responsiveness, high adsorption capacity, ease of synthesis and remarkable stability over a wide pH range [15,16]. Formed through robust coordination between metal ions (e.g., Fe(Ⅲ)) and polyphenol ligands such as tannic acid (TA), MPNs exhibit structurally dynamic and reversible characteristics that underlie their functional versatility [17]. A particularly valuable property of MPNs is their intrinsic proton-buffering capacity, attributed to the abundance of phenolic hydroxyl groups that undergo reversible protonation/deprotonation in response to local pH changes. This enables MPNs to serve as tunable interfacial buffers, with reported buffering capacities approximately two times and four times higher than those of polyelectrolyte complexes and conventional buffer solutions, respectively [18]. Moreover, the abundant electron-deficient metal sites in MPNs can act as Lewis acids, facilitating the adsorption of basic hydrazine [19]. Current studies have realized the application of MPNs in electrochemical systems by supporting them on various substrates. The MPN coatings endow the composite materials with higher adsorption capacities and lower charge-transfer resistances compared with the naked substrates [20]. While reduced charge-transfer resistance is expected to diminish activation overpotential, the role of MPNs in mitigating concentration polarization, particularly in proton-coupled electrochemical reactions, has remained largely unexplored. The inherent buffering capacity of MPNs suggests a potential to regulate proton flux at the electrode–electrolyte interface, thereby alleviating concentration gradients that contribute to overpotential. Nevertheless, the explicit mechanism and efficiency of MPN-mediated buffering in reducing concentration polarization, especially in the context of HzOR, have not been systematically investigated. Thus, examining the ability of MPN coatings to modulate interfacial proton activity and suppress concentration polarization offers a promising strategy for enhancing electrocatalytic performance.
Metals with higher coordination coefficients are likely to coordinate with a greater amount of catechol groups stoichiometrically and form tris-complexes, allowing more diverse coordination states to exist in the MPNs system and owning high buffering capacities [18,21]. Specifically, Fe-based MPNs are the most popular ones in various pH-responsive nanosystems, such as drug delivery, tissue engineering, treatment of infection, cancer therapy and biosensing [19,22]. For the conductive substrate, Fe3O4-based nanocomposite could be the potential material for the electrochemical HzOR thanks to its active redox couple of Fe(Ⅱ)/Fe(Ⅲ) [23]. In this study, we take Fe-TA MPNs as the tunable buffering coating for carbon-hybridized Fe3O4 particles (Fig. 1a), which buffers the protons by the transformation between the weak acids (-OH) and their conjugated bases (-O-Fe). The C-Fe3O4@Fe-TA composite exhibits a good HzOR performance and achieves the current density of 10 mA/cm2 at 23 mV (vs. RHE) in the electrolyte containing 1.0 mol/L KOH and 0.3 mol/L hydrazine, superior to the C-Fe3O4 (490 mV) and the commercial Pt/C (135 mV) [24]. Coupled with HzOR, C-Fe3O4@Fe-TA║Pt wire presents a superior cell voltage of only 0.22 V at 10 mA/cm2 for synchronous hydrogen production, which is substantially lower than that of the traditional overall water splitting system [11]. With the increased current density, C-Fe3O4@Fe-TA also shows good performance in electrochemical hydrazine detection, including high sensitivity of 1478 µA L mmol−1 cm−2, low detection limit of 0.15 µmol/L, high selectivity and excellent stability, superior to most of the recently reported materials (Fig. 1b) [25].
Fig. 2a shows that C-Fe3O4, prepared by a hydrothermal-calcination route, consists of smooth particles with the diameter of 340 ± 68 nm [26]. Fig. 2b presents the high-resolution transmission electron microscopy (HRTEM) image of C-Fe3O4, where the visible lattice fringes are indexed to the (311) plane of Fe3O4, confirming the presence of finely dispersed and embedded nanocrystals [23,27]. Subsequent coating via coordination-driven self-assembly with Fe(Ⅲ) and TA formed a rough supramolecular Fe-TA network on the particle surface, yielding the final C-Fe3O4@Fe-TA composite [19]. Fig. 2c shows that C-Fe3O4@Fe-TA maintains the morphological features of the pristine C-Fe3O4 particle but with a rougher surface. As shown in the TEM images of C-Fe3O4@Fe-TA (Fig. 2d and Fig. S1 in Supporting information), C-Fe3O4 is surrounded by a Fe-TA coating with a thickness of 3.5–5.0 nm. Fig. S2 (Supporting information) shows scanning transmission electron microscopy (STEM) images and corresponding energy-dispersive X-ray spectroscopy (EDS) elemental maps for C-Fe3O4 and C-Fe3O4@Fe-TA, demonstrating the uniform distribution of C, O, and Fe elements. The elemental ratios obtained from EDS analysis are C:O:Fe = 82.80:16.20:1.00 for C-Fe3O4 and 75.63:22.27:2.10 for C-Fe3O4@Fe-TA. The observed increase in Fe and O content, coupled with a concomitant decrease in C content, confirms the successful coating of the iron- and oxygen-rich Fe-TA complex onto the carbon-rich C-Fe3O4.

Fourier transform infrared (FTIR) spectroscopic analyses of C-Fe3O4 and C-Fe3O4@Fe-TA further confirm the successful coating (Fig. 2e). Compared to C-Fe3O4, the spectrum of C-Fe3O4@Fe-TA exhibits two new characteristic peaks: A band at 1716 cm-1, which is ascribed to the C═O stretching vibration of TA, and a strong band at 1199 cm−1, assigned to the C–O stretching vibration. Notably, the position of the C═O band (1716 cm−1) shows a clear red shift compared to that of free TA. This redshift is a definitive indicator that the carbonyl oxygen atoms of TA are coordinated to Fe(Ⅲ), leading to a decrease in the C═O bond order. The X-ray diffraction (XRD) patterns of C-Fe3O4 and C-Fe3O4@Fe-TA (Fig. 2f) exhibit two broad peaks at 21.5° and 44.3°, which are assigned to (002) and (100) crystal plane of amorphous carbon, respectively [26]. Moreover, the absence of characteristic diffraction peaks assigned to Fe3O4 corresponds to its ultra-small size. The elemental composition and chemical bonding of C-Fe3O4 and C-Fe3O4@Fe-TA were investigated by X-ray photoelectron spectroscopy (XPS). As shown in Fig. S3 (Supporting information), their XPS survey maps indicate the co-existence of C, O, and Fe on the surfaces of C-Fe3O4 and C-Fe3O4@Fe-TA. As shown in Fig. 2g, the C 1s XPS spectrum of C-Fe3O4 can be deconvoluted into three components, corresponding to C–C (sp2), C–C (sp3) and C–O species, respectively. In contrast, C-Fe3O4@Fe-TA exhibits two additional peaks, which are assigned to C═O and O–C═O functional groups originating from the TA framework. This provides direct evidence for the successful immobilization of TA onto the C-Fe3O4 surface [25]. The Fe 2p XPS spectra of C-Fe3O4 and C-Fe3O4@Fe-TA exhibit complex line shapes, indicative of multiple iron species (Fig. 2h). The spectrum of C-Fe3O4 was fitted with characteristic peaks of Fe3O4, including Fe2+ peaks (e.g., 2p3/2 at ~709.2 eV) and Fe3+ peaks (e.g., 2p3/2 at ~711.0 eV). The noticeable enhancement of the Fe3+ signal in the XPS spectrum of Fe3O4@Fe-TA, compared to Fe3O4, provides direct evidence for the successful formation of the Fe-TA coating [19,28].
As shown in Fig. 2i, the zeta potentials of both C-Fe3O4 and C-Fe3O4@Fe-TA gradually decrease as the solution pH increases. C-Fe3O4 is positively charged at pH < 6.5 and negatively charged at pH > 6.5. After coating with Fe-TA networks, the isoelectric point (pHpzc) of C-Fe3O4@Fe-TA shifted to pH 5.5. As shown in Fig. S4 (Supporting information), C-Fe3O4 has a zeta potential value of −22.40 ± 1.16 mV in water. After coating with Fe-TA, the zeta potential decreases to −31.78 ± 1.03 mV, which might be attributed to the ionization of the phenolic groups in C-Fe3O4@Fe-TA [25]. The Fe-TA coating enhances the electronegativity of C-Fe3O4, which might be an important factor to inhibit the further oxidation of C-Fe3O4 and improve its chemical stability. The surface properties of C-Fe3O4@Fe-TA were further studied through sedimentation kinetics and water contact angle measurements. As shown in Fig. S5 (Supporting information), sedimentation kinetics experiments demonstrate that C-Fe3O4@Fe-TA has higher dispersion stability in water than C-Fe3O4. In aqueous solution, well-distributed C-Fe3O4@Fe-TA forms a uniform suspension, whereas C-Fe3O4 exhibits typically hydrophobic behavior. Although C-Fe3O4@Fe-TA completely settles within 45 min, it exhibits good dispersibility, which can be ascribed to the modification with the electronegative Fe-TA coating [20].
An important downside of carbon-based materials in electrochemical applications is their poor wettability, since only the fraction of the surface wetted by the electrolyte contributes to the overall performance [29]. Correspondingly, the sessile drop method was conducted to compare the wettability of C-Fe3O4 and C-Fe3O4@Fe-TA. As shown in Fig. 2j, C-Fe3O4 exhibits the anti-wetting property against water (water contact angle of 119.9°). However, the water contact angle of C-Fe3O4@Fe-TA is only 45.4°, demonstrating that the Fe-TA coating is hydrophilic. Electrochemically driven charge transfer processes, including specific adsorption and surface redox reactions as well as the complex interplay between electrostatic and intermolecular forces among the solvent molecules, the electrolyte ions, and the electrode, can strongly affect the surface tension and the surface wettability of the electrode. This would be one of the reasons that the hydrophobic graphite-based nanomaterials are still excellent electrodes in aqueous electrochemical systems. According to the typical Young-Lippmann equation (Eq. S1 in Supporting information), the electrowetting ability (cos
In aqueous solution, the speciation of hydrazine as a function of pH is shown in Fig. S8 (Supporting information). At low pH (<6.0), the hydrazine exists in its protonated form, N2H5+, the hydrazinium cation. At pH 7.0 and 9.7, both N2H4 and N2H5+ co-exist. At pH 10.0, hydrazine exists predominantly in its N2H4 form [9]. Therefore, the electro-oxidation of hydrazine was first studied at the designed electrode in solutions of 1.5 mmol/L hydrazine supported by 0.1 mol/L KNO3, which had been adjusted to pH 5.0, 7.0 or 10.0 by the addition of small amounts of 1.0 mol/L HNO3 or KOH. As shown in Fig. S9 (Supporting information), at pH 5.0, no voltammetric features are observed for either C-Fe3O4 and C-Fe3O4@Fe-TA. This clearly indicates the absence of hydrazine electro-oxidation, which might be attributed to the fact that the hydrazinium cations have difficulty approaching the protonated electrode surface (the pHpzc are 6.5 for C-Fe3O4 and 5.5 for C-Fe3O4@Fe-TA). In contrast, at pH 7.0, C-Fe3O4@Fe-TA shows a fully electrochemically irreversible wave with peaks at ca. −0.25 and 0.42 V vs. Ag/AgCl (Fig. 3a). As shown in Eq. S2 (Supporting information), the peak at −0.25 V vs. Ag/AgCl corresponds to the direct oxidation of N2H4 while the peak at 0.42 V vs. Ag/AgCl is assigned to the indirect oxidation of N2H5+. The protons from the electro-oxidation of hydrazine can significantly change the local pH, thus in turn affecting the oxidation process. As shown in Fig. 3b, an increase in pH leads to an increase in the anodic current for N2H4 oxidation, whereas that for N2H5+ oxidation decreases. As shown in Fig. 3c, the C-Fe3O4 and C-Fe3O4@Fe-TA electrodes were polarized at 0.42 V in 1.5 mmol/L hydrazine solution for 0.5 h, respectively. The concentration of hydrazine on C-Fe3O4@Fe-TA decreases rapidly and linearly; however, the concentration of hydrazine on C-Fe3O4 decreases slowly and nonlinearly.
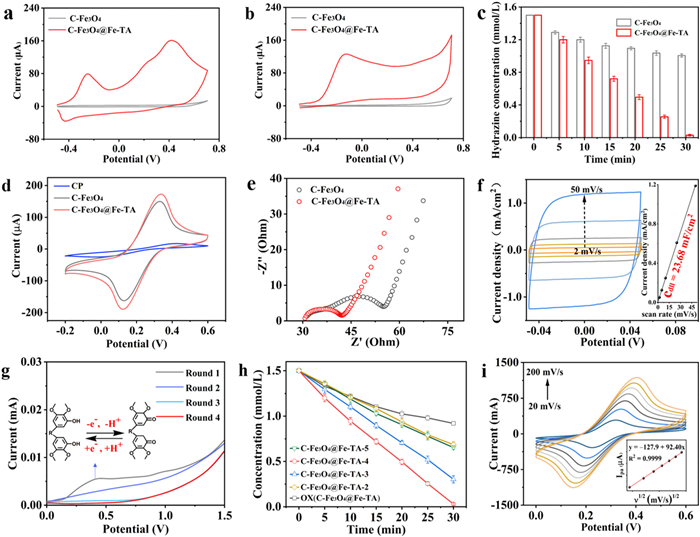
The electroactive surface area (A), internal resistance (Rct), and EDL capacitance of the C-Fe3O4@Fe-TA electrode were investigated to study its electrochemical mechanism in the HzOR. Fig. 3d shows the cyclic voltammograms recording the transformation between [Fe(CN)6]3− and [Fe(CN)6]4− on the designed electrodes, corresponding to bare CP, C-Fe3O4 and C-Fe3O4@Fe-TA, respectively. C-Fe3O4@Fe-TA exhibits higher redox peak currents than C-Fe3O4, indicating that the Fe-TA coating increases the A. Among these electrodes, C-Fe3O4@Fe-TA exhibits the highest peak currents. According to the Randles-Ševčík equation (Eq. S3 in Supporting Information), its A is calculated to be 0.22 cm2, which is substantially larger than that of bare CP (0.02 cm2) and C-Fe3O4 (0.19 cm2) [25]. A typical electrochemical process caused the energy consumption and storage in EDL. When a current pulse is applied to the electrode, one part is consumed by the EDL charging and the other part is used for the electrochemical reaction. Moreover, the current pulse produces an electric potential delay in the diffusion boundary layers (DBL) for the reason of the diffusional time delay in the variation in concentration. Correspondingly, there is an Rct of electrode affecting the charge transfer at the interface. The ions diffusion in DBL would also influence the charge transfer and form the Warburg impedance (ZW). The electrolyte solution, taking the positive/negative ions as the charge carriers, owns an external resistance (Rs) affecting the charge transfer.
Electrochemical impedance spectroscopy (EIS), often represented in the form of a Nyquist plot, is a powerful technique for characterizing these parameters and revealing the interfacial structure of the electrode/electrolyte system. Fig. 3e illustrates the EIS of C-Fe3O4 and C-Fe3O4@Fe-TA at an alternating-current amplitude of 5 mV and the open-circuit potential condition, where Rct of C-Fe3O4 and C-Fe3O4@Fe-TA were 34.5 and 15.3 Ω, respectively. The Rct, derived from the diameter of the semicircle, was obtained by fitting the data to an appropriate equivalent circuit (Fig. S10 in Supporting information) using Zview 2 software. The Rct of C-Fe3O4@Fe-TA is much lower than that of C-Fe3O4, demonstrating that the surface Fe-TA notably accelerates the charge transfer at the interface. Moreover, the fitted Rs in the system of C-Fe3O4 and C-Fe3O4@Fe-TA were 30.5 and 39.2 Ω, respectively. The significantly lower Rct of C-Fe3O4@Fe-TA can be attributed to the enhanced proton conductivity imparted by the metal-organic framework, as reported for similar nanocomposites [28,31]. This suggests that the Fe-TA coating, which is distinct from the C-Fe3O4 core, functions as an ion-conducting layer. The amorphous Fe-TA coating endows C-Fe3O4@Fe-TA with a much higher EDL capacitance (23.68 mF/cm2) compared to C-Fe3O4 (3.77 mF/cm2) (Fig. 3f and Fig. S11 in Supporting Information). This enhancement can be attributed to an increased effective thickness of the EDL adjacent to the electrode surface.
As shown in Eq. S4 (Supporting information), taking Fe-TA coating as a proton conducting membrane, the transmembrane potential is decided from the activities of protons in the solutions of the either side. When the membrane is far away from the anode, the impedance of the system may be presented as a series connection of five circuits (Fig. S12 in Supporting information) [2]. Three of them are consisted of a geometric capacitance connected in parallel with an ohmic resistance, respectively, for both diffusion layers and for the membrane bulk; the two others are the double-layer capacitance in parallel with the finite-length Warburg impedance for the left-hand and the right-hand interfaces, respectively. When calculating the ohmic resistance of diffusion layers, their concentration polarization induced by direct current should be accounted. When the membrane was adjacent to the anode, the EDL of anode overlapped with the diffusion layer of membrane, forming a new EDL for this multiple system. The increase of the proton activity in the solution of the left side would cause a decrease in the transmembrane potential, showing a higher Rct and a lower Rs. Therefore, Rct of C-Fe3O4@Fe-TA was much lower than that of C-Fe3O4, revealing that protons could more easily transfer through C-Fe3O4@Fe-TA to form an effective closed loop (Eq. S5 in Supporting information) [31].
The electrochemical mechanism of C-Fe3O4@Fe-TA was further studied by investigating the electron transfer and proton transport on the surface. In 0.1 mol/L phosphate-buffered saline (PBS, pH 7), the linear sweep voltammetry (LSV) curves for C-Fe3O4@Fe-TA exhibited a gradual decrease in oxidation current over the first four successive cycles (Fig. 3g). The obtained electrode was denoted as OX(C-Fe3O4@Fe-TA). The redox reaction of the surface phenolic hydroxyls on C-Fe3O4@Fe-TA enables the electron transfer and proton transport in electrochemical process (Fig. 3g (inset) and Eq. S6 in Supporting information). Therefore, 1.5 mmol/L hydrazine was polarized on the oxidized C-Fe3O4@Fe-TA electrode (OX(C-Fe3O4@Fe-TA)) at 0.42 V for 0.5 h. As shown in Fig. 3h, the concentration of hydrazine on OX(C-Fe3O4@Fe-TA) decreases slowly and nonlinearly, which could be attributed to its weaker electron transfer and proton transport than C-Fe3O4@Fe-TA. Moreover, C-Fe3O4@Fe-TA with the different molar ratios of Fe(Ⅱ) to TA (5:1, 4:1, 3:1, 2:1) were also used as the electrodes for the hydrazine oxidation at 0.42 V for 0.5 h. This comparative experiment demonstrated that the surface phenolic hydroxyl decided both the electron transfer and the proton transport, and thus affected HzOR performance of C-Fe3O4@Fe-TA.
HzOR releases four protons per molecule, and then the proton-lacking Fe-TA (solution pH > pHpzc) would capture the adjacent protons and keep the local N2H4/N2H5+ equilibrium. The details of the scan rate study at pH 7.0 are given in Fig. S13 (Supporting information), which demonstrates that the proton transport is the rate-determining step. The kinetics on C-Fe3O4@Fe-TA was further evaluated by cyclic voltammetry (CV) measurements in 5.0 mmol/L [Fe(CN)6]3−, 4− under the different scan rates (20, 50, 80, 110, 140, 170, and 200 mV/s). As shown in Fig. 3i, the Ipa increases gradually with the increasing scan rate. Its linear relationship equation is y = −127.9 + 92.40x with the correlation coefficient (R2) of 0.9999 (Fig. 3i inset), which demonstrates that this electrochemical process is a typical diffusion-controlled reaction. HzOR occurs in the six consecutive elementary steps with four protons release (Eq. S7 in Supporting information), which are subject to the slow reaction kinetics [32]. Therefore, the transport of the released protons is critical to the reaction systems.
Furthermore, the Fe(Ⅱ)/TA molar ratio and pH condition in the preparation process were investigated through a series of comparative experiments. In 0.1 mol/L PBS containing 200 µmol/L hydrazine, C-Fe3O4@Fe-TA exhibits the maximum current response at pH 7.0 (Figs. 4a and b). Meanwhile, the peak potential shows an approximately linear dependence on pH. As shown in Fig. 4c, C-Fe3O4@Fe-TA exhibits the maximum current response when the molar ratio of Fe(Ⅱ) to TA is 4. According to the Nernst equation (Eq. S8 in Supporting information), the potential of the N2/N2H4 redox couple (φ(N2/N2H4)) is influenced by the proton concentration within the EDL adjacent to the electrode. At 298 K, the φ(N2/N2H4) decreases by 59.2 mV for every order-of-magnitude decrease in proton concentration. Therefore, the titration studies were conducted to compare the buffering effects of C-Fe3O4 and C-Fe3O4@Fe-TA. The buffering strength of ultrapure water (18.2 MΩ cm) is particularly weak because its total salt concentration is below 1 ppb. It is extremely prone to receiving CO2 pollution in the atmosphere, resulting in its acidic pH [18]. As shown in Fig. 4d, the pH of the CO2-saturated solution (Blank) initially rises sharply upon NaOH addition, but this effect is attenuated, indicating a pH-buffering behavior. However, its buffering strength is much lower than that of a commercial buffer solution (e.g., 20 mmol/L acetate buffer at pH 3.8). Moreover, C-Fe3O4@Fe-TA exhibits much higher buffering strength than the acetate buffer and has an initial pH of 5.8. The buffering capacity (β) was calculated using the Eq. S9 (Supporting information). As shown in Fig. 4e, C-Fe3O4@Fe-TA exhibits a fourfold higher β value than the acetate buffer solution, which can be attributed to its multivalent metal-phenolic coordination.
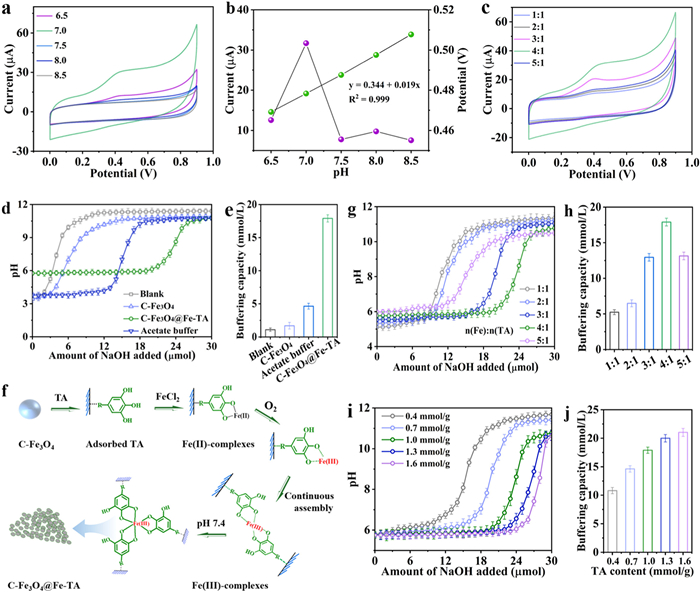
The pH-sensitive nature of C-Fe3O4@Fe-TA can be attributed to the reversible transformations among the mono, bis-, and tris-complexes of Fe(Ⅲ)-TA [18]. The abundant hydroxyl groups in the Fe-TA coating provide a high β for C-Fe3O4@Fe-TA, which helps to alleviate the drastic pH change within the EDL adjacent to the electrode. This local pH stabilization thereby reduces the overpotential of the N2/N2H4 electrode (φ′(N2/N2H4)). As shown in Fig. 4f, Figs. S14 and S15 (Supporting information), the adsorbed TA molecules on the C-Fe3O4 surface underwent a complexation reaction with the newly added Fe(Ⅱ) ions, forming unstable Fe(Ⅱ)-TA complexes. Under prolonged stirring, O2 from air entered the mixture and oxidized Fe(Ⅱ) to Fe(Ⅲ) [19]. In 3-(N-morpholino)propanesulfonic acid solution (MOPS), a continuous assembly process occurred, leading to the formation of mono-, bis- and tris-complexes of Fe(Ⅲ)-TA and ultimately engineering the coating on C-Fe3O4. The oxidation-mediated coordination assembly, which involves the use of Fe(Ⅱ) precursors that are oxidized to Fe(Ⅲ) during the growth process to stabilize the films, can be used to engineer films with microporous structures and continuous gradients [19].
The titration studies were also conducted to investigate the effect of Fe-to-TA molar ratio on the β of C-Fe3O4@Fe-TA. As shown in Fig. 4g, C-Fe3O4@Fe-TA with different Fe-to-TA molar ratios exhibit different initial pH values and buffering behaviors. To reach pH 7, C-Fe3O4@Fe-TA with an Fe-to-TA molar ratio of 4:1 consumed the largest amount of NaOH. This is because it possesses a wider variety of complex species capable of buffering more OH− before the system transitions to a tris-dominant coordination state. Increasing the Fe-to-TA molar ratio from 1:1 to 4:1 remarkably improved the β of C-Fe3O4@Fe-TA, whereas a further increase to 5:1 resulted in a decrease in β (Fig. 4h). From an acid-base perspective, a sufficient density of hydroxyl groups provides the capacity to buffer OH-. Nevertheless, coordination not only induces the enhanced deprotonation degree of the phenolic ligand but also enables the formation of distinct coordination modes at different pH, resulting in the improved pH-buffering capacity compared with that of the ligands alone. Lastly, titration studies were conducted to investigate the effect of relative dosage of TA to C-Fe3O4 substrate on the β of C-Fe3O4@Fe-TA. As shown in Figs. 4i and j, increasing the thickness of the Fe-TA coating also remarkably improved the β of C-Fe3O4@Fe-TA.
Recently, HzOR-assisted hydrogen production has attracted considerable research attention due to its advantages, which include simultaneous hydrogen production and hydrazine elimination, an ultralow thermodynamic potential (−0.33 V vs. RHE), zero carbon emission, and the avoidance of explosive mixture formation [33]. However, HzOR usually involves multi-step dehydrogenation processes and typically exhibits large energy barriers for activating adsorbed hydrazine (*N2H4), thereby suffering from the much higher practical working potentials than theoretical ones [34]. Electrocatalysts are needed to lower the reaction overpotential and direct it towards clean N2(g). The electrocatalytic activity of C-Fe3O4@Fe-TA and the reference electrodes (e.g., C-Fe3O4 and commercial Pt/C) towards HzOR was investigated by LSV. Measurements were performed at a scan rate of 5 mV/s in 1.0 mol/L KOH containing 300 mmol/L hydrazine, with 85% iR compensation applied. All the potentials are calibrated to the reversible hydrogen electrode (RHE) using the following equation: E(vs. RHE) = E(vs. Ag/AgCl) + 0.0591 × pH + 0.197 V, where E(vs. RHE) and E(vs. Ag/AgCl) represent the potential relative to RHE and the measured potential against the Ag/AgCl reference electrode, respectively. Over the measured potential window from −0.1 V to 0.7 V (vs. RHE), C-Fe3O4@Fe-TA achieves a higher current density than commercial Pt/C, whereas C-Fe3O4 shows negligible current response (Fig. 5a). C-Fe3O4@Fe-TA requires the working potentials of only 23, 118, 192, 301, and 451 mV to achieve the current densities of 10, 50, 100, 200, and 500 mA/cm2, respectively (Fig. S16 in Supporting information). These values are substantially lower than those required by commercial Pt/C (135, 189, 233, 320, and 590 mV) and outperform most recently reported catalysts [11,24]. Furthermore, the corresponding Tafel slope of C-Fe3O4@Fe-TA is 44.3 mV/dec, which is lower than that of C-Fe3O4 (533.1 mV/dec) and Pt/C (101.4 mV/dec), suggesting the most favorable kinetics of C-Fe3O4@Fe-TA for HzOR (Fig. 5b).
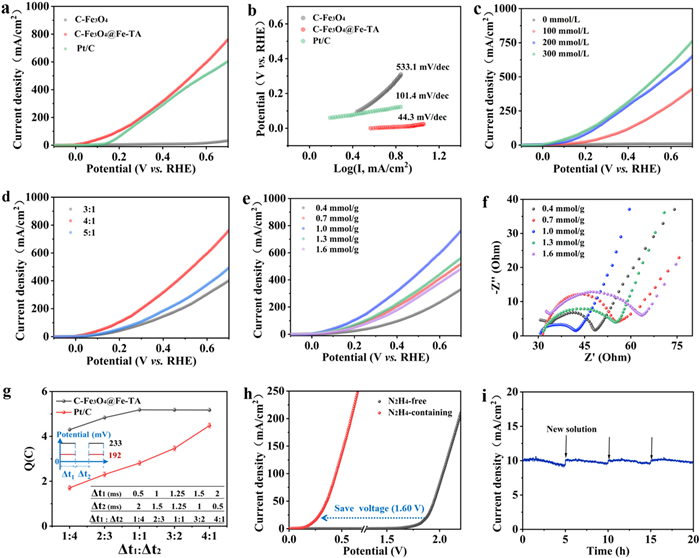
To optimize the performance of HzOR-assisted hydrogen production, the influences of hydrazine concentration, Fe-to-TA molar ratio, and TA-loaded amount were investigated by a series of comparative experiments. As shown in Fig. 5c, the current density of HzOR gradually increases with the increase of the hydrazine concentration, until the working potential decreases to 23 mV (vs. RHE) achieving the current densities of 10 mA/cm2. This working potential of HzOR is far below that of the traditional OER. As shown in Fig. 5d, C-Fe3O4@Fe-TA with different Fe-to-TA molar ratios had different HzOR-performance, achieving the highest current density at 4:1 in the measured potential window of −0.1~0.7 V (vs. RHE). C-Fe3O4@Fe-TA with the highest β could alleviate the drastic pH change in the EDL adjacent to the electrode; meanwhile, it has abundant adsorption sites for the hydrazine. Accordingly, increasing the thickness of Fe-TA coating should also improve the current density of HzOR. However, C-Fe3O4@Fe-TA prepared by different n(TA) (0.4, 0.7, 1.0, 1.3, and 1.6 mmol TA) at per gram of C-Fe3O4 substrate had different HzOR-performance, achieving the highest current density at 1.0 mmol/g (Fig. 5e). EIS analyses are consistent with the above results (Fig. 5f), where the Rct of C-Fe3O4@Fe-TA (1.0 mmol/g) is much lower than the rests. By further enhancing the charge transfer, C-Fe3O4@Fe-TA only needs 23 mV to reach 10 mA/cm2 and exhibits much better intrinsic activity than Pt/C.
Considering the favorable kinetics of C-Fe3O4@Fe-TA toward HzOR, the double potential step technique (DPST) was employed to further investigate the electrochemical kinetics. Since C-Fe3O4@Fe-TA achieves a current density of 100 mA/cm2 at 192 mV, this working potential was applied in the DPST measurements. The theoretical charge quantity (Q) passed under these conditions was calculated to be 5.4 C. Furthermore, Fig. S17 (Supporting Information) shows the effect of pulse frequency on the actual Q at a fixed power-on/off time ratio (Δt1: Δt2) of 1:1. The optimal Q value for HzOR on C-Fe3O4@Fe-TA was achieved at a frequency of 400 Hz. Fig. 5g compares the effect of the Δt1: Δt2 on the Q for C-Fe3O4@Fe-TA and Pt/C. When the ratio of Δt1 to Δt2 was 1:1, the material achieved the best Q (5.2 C) and approached the theoretical value. In contrast, Pt/C, operating at its required overpotential of 233 mV, reached a maximum Q of only 4.5 C, which is lower than the ideal value. A longer power-on time favors the HzOR, while the buffering effect of C-Fe3O4@Fe-TA concurrently contributes to a reduction in the required overpotential.
Considering the outstanding activity of C-Fe3O4@Fe-TA toward HzOR, the asymmetric two-electrode electrolysis configuration (C-Fe3O4@Fe-TA║Pt wire) was constructed to demonstrate the low-voltage-driven hydrogen generation plus hydrazine degradation in alkaline electrolyte, in which C-Fe3O4@Fe-TA and Pt wire worked as the anode and the cathode, respectively. Compared to the cell voltage of 1.82 V required to achieve 10 mA/cm² in a hydrazine-free electrolyte, the C-Fe3O4@Fe-TA║Pt wire system requires only 0.22 V in 1.0 mol/L KOH with 300 mmol/L hydrazine (Fig. 5h). This represents a voltage reduction of approximately 1.60 V for electrolytic hydrogen generation at 10 mA/cm² when 300 mmol/L hydrazine is present. Meanwhile, the stability of this H2-producing electrolysis system was tested by the time-dependent current density under a static cell voltage of 0.22 V in 1.0 mol/L KOH electrolyte containing 300 mmol/L hydrazine (Fig. 5i). The electrolysis current consistently recovered after each electrolyte refresh over the 20 h test, demonstrating the outstanding long-term stability of the electrolysis system. The remarkable energy-saving effect and excellent stability of the C-Fe3O4@Fe-TA║Pt wire system are comparable to, and in many cases superior to, those of most previously reported low-voltage-driven electrolysis systems (Table S1 in Supporting Information). The XRD patterns, SEM images, and XPS spectra (C 1s and Fe 2p) for both C-Fe3O4@Fe-TA and C-Fe3O4 after the long-term HzOR were collected. As shown in Figs. S18 and S19 (Supporting information), the crystal structure and spherical morphology are well preserved without any observable deterioration, indicating outstanding structural and morphological stability. The distinct contrast in the spectral evolution of the Fe 2p XPS before and after use—with significant changes observed for C-Fe3O4 but minimal variation for C-Fe3O4@Fe-TA—strongly indicates that the Fe-TA coating markedly enhances the catalytic stability (Fig. S20 in Supporting information).
Hydrazine is a severe environmental pollutant because of its corrosiveness and strong reducibility. It is widely used in industrial and agricultural applications, such as in the production of antioxidants, insecticides, preservatives, fuel cells, and rocket propellants [35]. Moreover, hydrazine is highly toxic to humans, as it may cause headache, nausea, dizziness, and even damage the kidneys and central nervous system. Diverse methods, including flow injection chemiluminescence, colorimetry, high-performance liquid chromatography, spectrophotometry, capillary electrophoresis, fluorescence, surface-enhanced Raman scattering, and electrochemistry, have been employed to detect hydrazine in environmental samples [35]. Among these, the electrochemical method has been extensively studied in recent years due to its advantages such as low cost, operational simplicity, and potential for real-time and online analysis. The application of C-Fe3O4@Fe-TA for the electrochemical detection of hydrazine was investigated in the 0.1 mol/L PBS (pH 7.0) containing 1.0 mmol/L hydrazine. Fig. 6a shows that the oxidation current on C-Fe3O4@Fe-TA is much higher than that on C-Fe3O4, indicating that C-Fe3O4@Fe-TA has superior performance for the hydrazine electrochemical detection. Fig. 6b shows the CV curves of C-Fe3O4@Fe-TA in PBS with varying hydrazine concentrations. The increase in the oxidation current is clearly observed as the concentration of hydrazine increases from 1.0 mmol/L to 6.0 mmol/L. Correspondingly, Fig. 6c illustrates the linear relationship between the Ipa and the hydrazine concentration. The corresponding linear regression equation is y = 74.944x + 52.63 (R2 = 0.9996). This well-defined linear relationship demonstrates the excellent responsiveness of C-Fe3O4@Fe-TA to hydrazine concentration.
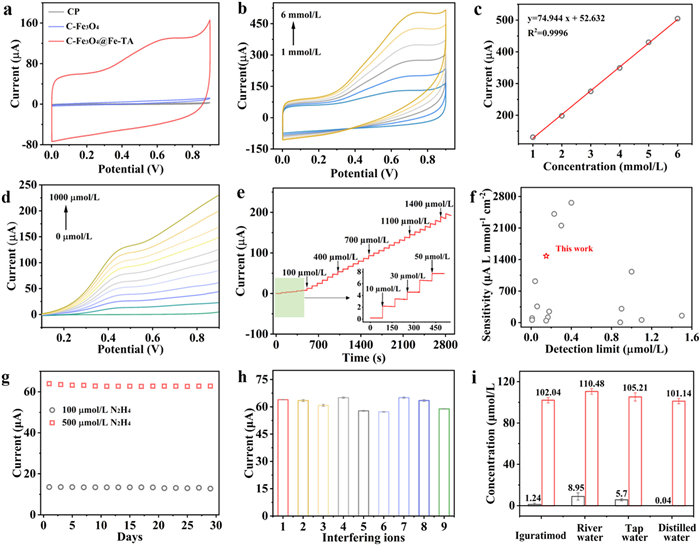
The detection performance of C-Fe3O4@Fe-TA for hydrazine was further investigated using LSV by recording the oxidation current at the point of inflexion (Iinflex). The Iinflex value increased with the hydrazine concentration from 0 to 1000 µmol/L (Fig. 6d). Fig. S21 (Supporting information) shows the corresponding calibration curve satisfies the equation of y = 0.131x + 0.019 (R2 = 0.9998). The amperometric response was conducted to further evaluate the sensitivity, linear range and detection limit of C-Fe3O4@Fe-TA. As shown in Fig. 6e, the response current increases with the hydrazine concentration from 0 up to 1450 µmol/L during the successive addition of hydrazine. Based on this result, the response current of C-Fe3O4@Fe-TA towards hydrazine concentration exhibits a wide linear range from 0 to 1450 µmol/L, satisfying the equation y = 0.133x + 0.075 (R2 = 0.9995) (Fig. S22 in Supporting information). Accordingly, the sensitivity of C-Fe3O4@Fe-TA is calculated as 1478 µA L mmol−1 cm−2. The detection limit was determined from the linear regression of the calibration plot using Eq. S10 (Supporting information). Accordingly, the detection limit of C-Fe3O4@Fe-TA was determined to be 0.15 µmol/L (S/N = 3). A detailed comparison of the detection performance of C-Fe3O4@Fe-TA with those of other electrodes reported in the literature is summarized in Fig. 6f and Table S2 (Supporting information). It should be stressed that C-Fe3O4@Fe-TA electrode simultaneously has high sensitivity and a low detection limit, comparing favorably with most of the recently reported electrodes [36–38].
The stability was assessed by testing hydrazine one time on every two days on the same electrode. As shown in Fig. 6g, C-Fe3O4@Fe-TA has an insignificant current loss during 28-day use, demonstrating that it has high stability for hydrazine detection. The excellent stability of C-Fe3O4@Fe-TA can be attributed to the protective effect of the Fe-TA coating for the active centers of C-Fe3O4. The reproducibility of C-Fe3O4@Fe-TA for the hydrazine detection was evaluated by detecting the current response of three identically fabricated sensors. Fig. S23 (Supporting information) shows that all as-prepared sensors based on C-Fe3O4@Fe-TA exhibit nearly identical current responses, with a relative standard deviation of 2.29%, confirming the excellent reproducibility of the fabrication process. The influence of potential interfering substances (Na+, K+, Zn2+, Co2+, Al3+, Cl−, SO42−, and NO3−) on the response current of the C-Fe3O4@Fe-TA electrode was investigated. As shown in Fig. 6h, the response currents from hydrazine are insignificantly affected by these interfering substances, demonstrating that C-Fe3O4@Fe-TA has excellent selectivity for hydrazine detection.
Hydrazine serves as a widely utilized building block for the preparation of N–N containing molecules in organic synthesis, such as iguratimod. Iguratimod is a novel anti-rheumatic drug with remarkable effectiveness, but is easy to mix with residual hydrazine because of the synthetic route and the hydrolysis reaction. Considering the maximum daily dose of iguratimod (50 mg) and the permitted daily exposure of ICH M7 Guidelines (39 µg/d), the limit in iguratimod should be 0.078%. Therefore, the development of an easy-to-use, inexpensive, and efficient analytical method for the precise determination of hydrazine in iguratimod is crucial for patient drug safety. The preparation of real samples is described in Text S8 (Supplementary information). As shown in Fig. 6i, the hydrazine concentrations in the iguratimod sample, river water, tap water, and distilled water were determined to be (1.24 ± 1.22), (8.95 ± 3.47), (5.70 ± 1.10), and (0.04 ± 0.06) µmol/L, respectively, using the proposed C-Fe3O4@Fe-TA sensor. After spiking with 100 µmol/L of hydrazine, the measured concentrations in the iguratimod sample, river water, tap water, and distilled water were found to be (102.48 ± 2.66), (110.48 ± 2.68), (105.21 ± 4.01) and (101.14 ± 2.56) µmol/L, respectively. These results suggest that C-Fe3O4@Fe-TA has good accuracy in the analysis of real samples.
This study takes Fe-TA MPN as the tunable buffering coating for C-Fe3O4, significantly reducing the pHpzc, enhancing the wettability, increasing the EDL capacitance and decreasing the charge transfer resistance. The resulting C-Fe3O4@Fe-TA exhibits an excellent buffering effect, thereby decreasing the concentration overpotential for electrochemical HzOR. This can be attributed to the reversible transformations among its mono-, bis-, and tris-complexes of Fe-TA. Comparative experiments reveal that the loading dosage and the Fe-to-TA ratio significantly influences the buffering capacity and the HzOR current density. C-Fe3O4@Fe-TA shows good electrocatalytic performance in the multiple-proton-involved HzOR and requires the low working potentials of 23, 118, 192, 301 and 451 mV (vs. RHE) in the electrolyte containing 1.0 mol/L KOH and 300 mM hydrazine to achieve the current densities of 10, 50, 100, 200 and 500 mA/cm2, respectively. Coupled with HzOR, the C-Fe3O4@Fe-TA║Pt wire system presents a superior cell voltage of only 0.22 V at 10 mA/cm2 for synchronous hydrogen production. Moreover, C-Fe3O4@Fe-TA shows good performance in electrochemical hydrazine detection, including the high sensitivity of 1478 µA L mmol−1 cm−2, the low detection limit of 0.15 µmol/L, and the excellent selectivity and stability. It also shows high reliability for analyzing real samples, including iguratimod, river water, and tap water. This study reveals that MPN-based functional coating can effectively decrease the concentration and resistance overpotentials in electrochemical HzOR, highlighting their significant advantage for this class of proton-involved reactions.
Jing Feng: Writing – original draft, Visualization, Validation, Supervision, Resources, Methodology, Investigation, Funding acquisition, Formal analysis, Data curation, Conceptualization. Jing He: Writing – original draft, Visualization, Validation, Software, Methodology, Investigation, Formal analysis, Data curation. Qinling Liu: Visualization, Methodology, Investigation, Formal analysis. Qin Chen: Software, Methodology, Data curation. Qin Deng: Software, Methodology. Yunxiang He: Visualization, Methodology. Yajing Zhang: Software, Data curation. Zhenju Jiang: Software, Methodology. Xinghua Zhu: Writing – review & editing, Validation, Supervision, Project administration, Investigation, Formal analysis, Conceptualization. Junling Guo: Writing – review & editing, Supervision, Funding acquisition, Conceptualization.
The authors declare that they have no known competing financial interests or personal relationships that could have appeared to influence the work reported in this paper.
The authors acknowledge financial support from the National Key R&D Program of China (No. 2022YFA0912800), National Excellent Young Scientists Fund (No. 00308054A1045), National Natural Science Foundation of China (No. 22178233), Talents Program of Sichuan Province, Double First-Class University Plan of Sichuan University, State Key Laboratory of Polymer Materials Engineering (No. sklpme 2020–03–01), Tianfu Emei Program of Sichuan Province (No. 2022-EC02–00073-CG), Fundamental Research Funds for the Central Universities (No. SCU2025D014), Key Laboratory of Leather Chemistry and Engineering (Sichuan University), Ministry of Education National Engineering Research Center of Clean Technology in Leather Industry, Sichuan Innovation and Entrepreneurship Project of China (No. S202510623078), Sichuan Innovative Experimental Project of China (No. 25–107), and Sichuan Science and Education Integration Fund (No. 25LHJJ0132).
Supplementary material associated with this article can be found, in the online version, at doi:
G. Feng, Y. Pan, D. Su, et al., Adv. Mater. 36 (2024) 2309715. doi: 10.1002/adma.202309715
B. Habibi, A. Pashazadeh, S. Pashazadeh, et al., J. Electroanal. Chem. 907 (2022) 116038. doi: 10.1016/j.jelechem.2022.116038
H.Y. Wang, M.L. Sun, J.T. Ren, et al., Adv. Energy Mater. 13 (2023) 2203568. doi: 10.1002/aenm.202203568
X.H. Chen, H.C. Fu, L.L. Wu, et al., Green Chem. 24 (2022) 5559. doi: 10.1039/d2gc01158a
X.Y. Zhang, Y.S. Yang, W. Wang, et al., Coordin. Chem. Rev. 417 (2020), 213367. doi: 10.1016/j.ccr.2020.213367
R. Razavi, F.G. Nejad, S.A. Ahmadi, et al., Electrochem. Commun. 159 (2024) 107639. doi: 10.1016/j.elecom.2023.107639
R. Miao, L. Shao, R.G. Compton, Nano Res. 14 (2021) 4132–4139. doi: 10.1007/s12274-021-3353-8
R. Miao, R.G. Compton, J. Phys. Chem. Lett. 12 (2021) 1601–1605. doi: 10.1021/acs.jpclett.1c00070
R. Miao, R.G. Compton, Electrochim. Acta 388 (2021) 138655. doi: 10.1016/j.electacta.2021.138655
J. Ding, H.F. Wang, X. Yang, et al., Natl. Sci. Rev. 10 (2023) 231.
S. Li, Y. Hou, L. Jiang, et al., Energy. Rev. 4 (2025) 100105. doi: 10.1016/j.enrev.2024.100105
J. Shi, Q. Sun, W. Zhu, et al., Chem. Eng. J. 463 (2023) 142385. doi: 10.1016/j.cej.2023.142385
Y. Guo, X. Liu, Y. Zang, et al., J. Mater. Chem. A 10 (2022) 17297–17306. doi: 10.1039/d2ta03659b
J. Jiang, X. Cui, Y. Huang, et al., Nano Biomed. Eng. 16 (2024) 152–187. doi: 10.26599/nbe.2024.9290060
S. Pan, E. Goudeli, J. Chen, et al., Angew. Chem. Int. Ed. 60 (2021) 14586–14594. doi: 10.1002/anie.202103044
H. Tian, W. Li, G. Wang, et al., Angew. Chem. Int. Ed. 63 (2024) 202411498. doi: 10.1002/anie.202411498
S. Zhou, H. Tian, J. Yan, et al., Chin. Chem. Lett. 35 (2024) 108312. doi: 10.1016/j.cclet.2023.108312
J. Chen, S. Pan, J. Zhou, et al., Chem. Mater. 33 (2021) 2557–2566. doi: 10.1021/acs.chemmater.1c00015
Q.Z. Zhong, S. Li, J. Chen, et al., Angew. Chem. Int. Ed. 58 (2019) 12563–12568. doi: 10.1002/anie.201907666
G. Lang, J. Feng, B. Feng, et al., Chin. Chem. Lett. 35 (2024) 109113. doi: 10.1016/j.cclet.2023.109113
F. Soyekwo, C. Liu, W. Huang, et al., Adv. Mater. Interfaces 13 (2021) 2100245.
A. Bigham, V. Rahimkhoei, P. Abasian, et al., Chem. Eng. J. 432 (2022) 134146. doi: 10.1016/j.cej.2021.134146
X. Jia, J. Wu, K. Lu, et al., J. Mater. Chem. A 23 (2019) 14302–14308. doi: 10.1039/c9ta03339d
Y. Li, W. Qiang, T. Ji, et al., Sci. Adv. 6 (2020) 5993. doi: 10.1126/sciadv.aay5993
J. Feng, G. Lang, T.T. Li, et al., Appl. Surf. Sci. 604 (2022) 154548. doi: 10.1016/j.apsusc.2022.154548
J. Feng, X. Zhu, Q. Chen, et al., J. Mater. Chem. A 46 (2019) 26227–26230. doi: 10.1039/c9ta09439c
Z. Xiang, Y. Song, J. Xiong, et al., Carbon 142 (2019) 20–31. doi: 10.1016/j.carbon.2018.10.014
J. Feng, G. Lang, T.T. Li, et al., J. Environ. Manag. 319 (2022) 115619. doi: 10.1016/j.jenvman.2022.115619
A.A. Papaderakis, M. Leketas, Z. Wei, et al., ChemElectroChem 10 (2024) 202400143.
H. Cui, Y. Song, D. Ren, et al., Joule 8 (2024) 29–44. doi: 10.1016/j.joule.2023.11.012
Y. Hu, G. Zhan, X. Peng, et al., Chem. Eng. J. 389 (2020) 124414. doi: 10.1016/j.cej.2020.124414
V.V. Nikonenko, A.E. Kozmai, Electrochim. Acta 56 (2011) 1262–1269. doi: 10.1016/j.electacta.2010.10.094
Y. Tong, P. Chen, Inorg. Chem. Front. 11 (2024) 6218–6245. doi: 10.1039/d4qi01789g
Y. Wang, Z. Chen, H. Wu, et al., ACS Sustain. Chem. Eng. 6 (2018) 15727–15736. doi: 10.1021/acssuschemeng.8b04274
F. Nabeel, T. Rasheed, J. Hazard. Mater. 388 (2020) 121757. doi: 10.1016/j.jhazmat.2019.121757
A. Mohammad, M.E. Khan, I.M. Alarifi, et al., Microchem. J. 171 (2021) 106784. doi: 10.1016/j.microc.2021.106784
A. Kaur, U. Chakraborty, M. Chauhan, et al., Electrochim. Acta 419 (2022) 140384. doi: 10.1016/j.electacta.2022.140384
S. Tajik, M.B. Askari, S.A. Ahmadi, et al., Nanomaterials 12 (2022) 491. doi: 10.3390/nano12030491

Figure 1 (a) Local buffering mechanism of C-Fe3O4@Fe-TA, and (b) schematic illustrations of C-Fe3O4@Fe-TA in the hydrazine-assisted hydrogen production and the electrochemical hydrazine detection.

Figure 2 Material characterization. (a) SEM and (b) HRTEM images of C-Fe3O4. (c) SEM and (d) TEM images of C-Fe3O4@Fe-TA. (e) FTIR spectra, (f) XRD patterns, (g) C 1s XPS spectra, (h) Fe 2p XPS spectra, (i) zeta potentials, and (j) water contact angles of C-Fe3O4 and C-Fe3O4@Fe-TA. (k) CV curves of Fe(Ⅱ), Fe(Ⅲ) and Fe(Ⅱ)-TA.

Figure 3 Electro-oxidation of hydrazine. Cyclic voltammetry at C-Fe3O4 and C-Fe3O4@Fe-TA of 1.5 mmol/L hydrazine supported by the 0.1 mol/L KNO3 electrolytes: (a) pH 7 and (b) pH 10. (c) Concentration evolutions of hydrazine oxidized by C-Fe3O4 and C-Fe3O4@Fe-TA electrodes at 0.42 V. (d) CV curves and (e) local Nyquist plots of C-Fe3O4 and C-Fe3O4@Fe-TA in 5.0 mmol/L [Fe(CN)6]3−, 4−. (f) Evaluation of the EDL capacitance for C-Fe3O4@Fe-TA. (g) LSV curves of C-Fe3O4@Fe-TA in 0.1 mol/L KNO3 (pH 7), and (inset) the redox reaction of surface phenolic hydroxyl. (h) Concentration evolutions of hydrazine oxidized by OX(C-Fe3O4@Fe-TA) and C-Fe3O4@Fe-TA (prepared by the different molar ratio of Fe to TA 5:1, 4:1, 3:1, 2:1) electrodes at 0.42 V. (i) Voltammograms recorded in 5.0 mmol/L [Fe(CN)6]3−, 4− on C-Fe3O4@Fe-TA electrode at various scan rates (20–200 mV/s), and (inset) the corresponding calibration curve between the oxidation peak current and the square root of scan rate.

Figure 4 Buffering effect. (a) Current responses for 200 µmol/L hydrazine in different PBS (pH 6.5–8.5). (b) Relationship of the pH-peak current and pH-peak potential. (c) Current responses for 200 µmol/L hydrazine on different C-Fe3O4@Fe-TA prepared by different Fe(Ⅱ)/TA molar ratios. (d) Titration curves as a function of NaOH added and (e) buffering capacity of water (blank), C-Fe3O4, C-Fe3O4@Fe-TA and 20 mmol/L acetate buffer solution. (f) Schematic illustration of the preparation process of C-Fe3O4@Fe-TA. (g) Titration curves as a function of NaOH added and (h) buffering capacity of C-Fe3O4@Fe-TA prepared by different Fe:TA molar ratios (1:1–5:1). (i) Titration curves as a function of NaOH added and (j) buffering capacity of C-Fe3O4@Fe-TA prepared by different n(TA) (0.4, 0.7, 1.0, 1.3, and 1.6 mmol TA) at per gram of C-Fe3O4 substrate.

Figure 5 HzOR-assisted hydrogen production. (a) LSV curves and (b) Tafel slope plots of C-Fe3O4, C-Fe3O4@Fe-TA and Pt/C. The solution is 1.0 mol/L KOH containing 0.3 mol/L N2H4. (c) LSV curves of C-Fe3O4@Fe-TA in 1.0 mol/L KOH containing different concentrations of N2H4. (d) LSV curves of C-Fe3O4@Fe-TA prepared by different Fe:TA molar ratios (3:1, 4:1, and 5:1). (e) LSV curves and (f) local Nyquist plots of C-Fe3O4@Fe-TA prepared by different n(TA) (0.4, 0.7, 1.0, 1.3, and 1.6 mmol TA) at per gram of C-Fe3O4 substrate. (g) The quantity of electric charge of C-Fe3O4@Fe-TA and Pt/C under different power-on/off time ratios (Δt1: Δt2 = 1:1, 400 Hz, 10 min, the solution is 1.0 mol/L KOH containing 0.3 mol/L N2H4). (h) LSV curves of C-Fe3O4@Fe-TA║Pt wire in 1.0 mol/L KOH with and without 0.3 mol/L hydrazine, respectively. (i) The chronoamperometry curve of C-Fe3O4@Fe-TA║Pt wire electrolysis system at 0.22 V.

Figure 6 Electrochemical hydrazine detection. (a) CV curves of bare CP, C-Fe3O4 and C-Fe3O4@Fe-TA in the solutions containing 1.0 mmol/L hydrazine and 0.1 mol/L PBS (pH 7.0). (b) CV curves of C-Fe3O4@Fe-TA in 0.1 mol/L PBS (pH 7.0) with different concentrations of hydrazine and (c) the corresponding calibration curve between the oxidation peak current and the hydrazine concentration. (d) LSV curves to various concentrations of hydrazine on C-Fe3O4@Fe-TA. (e) Amperometric responses to the successive addition of hydrazine. (f) Sensitivity and detection limit of C-Fe3O4@Fe-TA (red star), compared with the reported electrodes in the literatures (black circles). (g) Stability of C-Fe3O4@Fe-TA for hydrazine detection. (h) Amperometric responses towards hydrazine in the presence of interfering substances, including 1-None, 2-Na+, 3-K+, 4-Zn2+, 5-Co2+, 6-Al3+, 7-Cl−, 8-SO42−, and 9-NO3−. (i) Hydrazine detection for the real samples, including the iguratimod sample, the river water, the tap water, and the distilled water.

 扫一扫看文章


扫一扫关注我们
 DownLoad:
 下载:
下载:
 下载:
下载: