Figure 1.
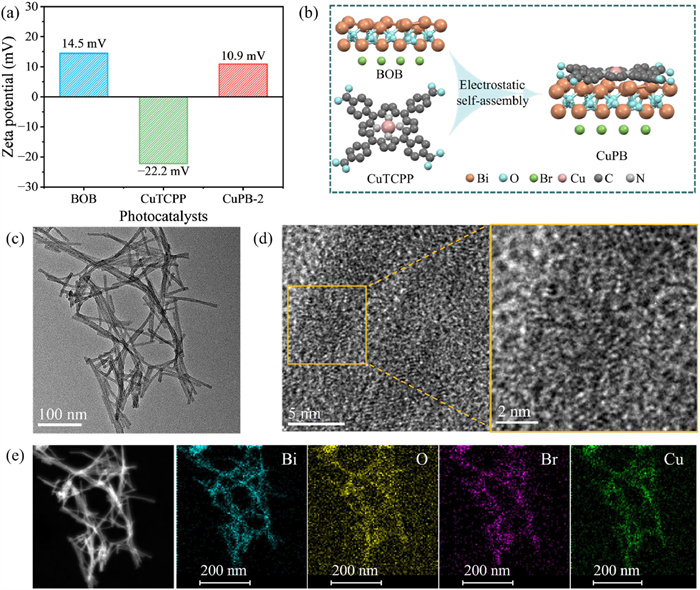
(a) Zeta potential measurements of BOB, CuTCPP and CuPB-2. (b) Schematic diagram of the assembly process of CuPB. (c) TEM and (d) HR-TEM of CuPB-2. (e) Element mapping images of Bi, O, Br and Cu over CuPB-2.
Synergistic optimization of charge transfer and active sites in Bi12O17Br2/CuTCPP for efficient CO2 photoreduction
Tiange Wei , Mengxia Ji , Yi Zhang , Keke Wang , Meng Wang , Yuanbin She , Jiexiang Xia , Huaming Li

The rising concentration of atmospheric CO2 disrupts the global carbon cycle and exacerbates climate warming, posing an urgent and complex issue [1,2]. Motivated by plant photosynthesis, photocatalytic technology directly utilizes solar energy to convert CO2 into carbon-based fuels, offering a sustainable scheme to this issue [3,4]. However, a typical photocatalytic CO2 reduction process involves sluggish kinetics of photoexcited charge transfer and stable thermodynamic of CO2 molecules, which significantly impedes the catalytic performance [5]. Developing high-efficiency semiconductor photocatalysts represents a promising strategy in field of CO2 photoreduction, contributing to sustainable carbon management and renewable fuel production [6].
To date, various semiconductor materials have been employed for photocatalysis, such as titanium dioxide [7,8], carbon nitride [9,10], sulfide [11,12], and bismuth-based catalysts [13,14]. Notably, bismuth oxyhalide (BiOX, X = I, Br, Cl) have garnered significant attention because of its low toxicity, exceptional chemical stability, adjustable layered structure, and excellent light-harvesting capability [15,16]. Nevertheless, the overall efficiency of photocatalytic CO2 reduction is constrained by poor charge separation and inadequate catalytically active sites. To address these limitations, advanced strategies including heterojunction construction [17,18], defect engineering [19,20], and elemental doping [21,22] have been extensively investigated. Among various strategies, the construction of heterojunction structures demonstrates distinct benefits by simultaneously facilitating charge transfer and reconfiguring interfacial reactive centers [23]. For example, Liang et al. created a closely connected interface between CoAl-LDH and Bi12O17Cl2 to establish a rapid electron transfer channel, which enhanced the charge transfer process [23]. Wan’s group found that NiCoP/Bi4O5Br2 material exhibited high degradation efficiency for phenolic pollutants due to the superior adsorption capacity of NiCoP. This characteristic endowed NiCoP/Bi4O5Br2 with an advantage in activating O2, resulting in the production of more superoxide radicals [24].
However, the design strategy of heterojunction emphasizes the selection of materials and the construction of heterogeneous interfaces. The structure flexibility and tunability substituents on porphyrin ring facilitate precise modulation of optical and electronic properties, rendering porphyrins highly versatile for constructing composites with inorganic/organic materials [25,26]. According to previous reports, Jing et al. constructed electrostatically self-assembled ZnTCPP/C60-EDA to improve charge separation efficiency [27]. Gao et al. developed TiO2 nanosheets/TCPP via the Ti-O-C=O bond, which efficiently enhanced the light absorption ability and the charge separation and transfer efficiency [28]. Furthermore, after coordination of porphyrin with metal ions to form metalloporphyrin complexes, the optimization of optical properties over inorganic semiconductors would be significantly improved compared to using porphyrin [29]. Particularly, the carboxyl and phenyl groups in CuTCPP as electron accepting groups promote the separation efficiency of photogenerated electrons and holes [30]. And Cu(Ⅱ) sites facilitate the adsorption and activation of CO2, playing an important role in improving the CO2 conversion efficiency [31].
Herein, an electrostatic self-assembly method was adopted to attach CuTCPP to ultrafine Bi12O17Br2 nanotubes for the construction of CuTCPP/Bi12O17Br2 heterojunctions. The interfacial built-in electric field drives directional transfer of excited electrons from Bi12O17Br2 to CuTCPP, facilitating charge separation. Furthermore, the Cu(Ⅱ) sites in CuTCPP act as the supplementary catalytic centers for the adsorption and activization of CO2, thus accelerating the generation of *CO intermediate. The CuTCPP/Bi12O17Br2 heterojunction demonstrated enhanced photoreduction activity of CO2, achieving a CO evolution rate of 92.2 μmol g-1 h-1. This performance represents a 4.0-fold improvement over the pristine Bi12O17Br2.
The CuTCPP/Bi12O17Br2 (CuPB) heterojunction was synthesized by an electrostatic self-assembly method. Due to the carboxyl groups -COOH in the periphery of CuTCPP, CuTCPP undergoes NaOH-induced deprotonation, generating a negatively charged [32]. As observed in zeta potential measurements (Fig. 1a), Bi12O17Br2 (BOB) and deprotonated CuTCPP are oppositely charged, providing the necessary condition for the electrostatic self-assembly of the CuTCPP/Bi12O17Br2 heterojunction (Fig. 1b). The zeta potential of CuPB-2 composite catalyst is between BOB and CuTCPP, which illustrates the effectiveness of electrostatic self-assembly strategy. According to ICP-OES analysis (Fig. S1 and Table S1 in Supporting information), the CuTCPP loading amounts in CuPB-1, CuPB-2, and CuPB-3 materials are 0.1148 wt%, 0.1749 wt% and 0.3319 wt%, respectively, close to theoretical loading. These values demonstrate effective assembly of CuPB driven by electrostatic forces. The morphology of BOB and CuPB-2 are observed by transmission electron microscopy (TEM). Both BOB and CuPB-2 samples consist of the ultrafine hollow nanotubes with a diameter of around 5 nm (Fig. 1c and Fig. S2a in Supporting information). As shown in the HR-TEM of BOB and CuPB-2 (Fig. 1d and Fig. S2b in Supporting information), the lattice stripes of the CuPB-2 appear less distinct than those of BOB, possibly due to the CuTCPP molecules assembling on the BOB nanotubes surface. Elemental mapping shows that Bi, O, Br, and Cu elements uniformly distribute on CuPB-2, proving that BOB and CuTCPP were homogeneously assembled (Fig. 1e).
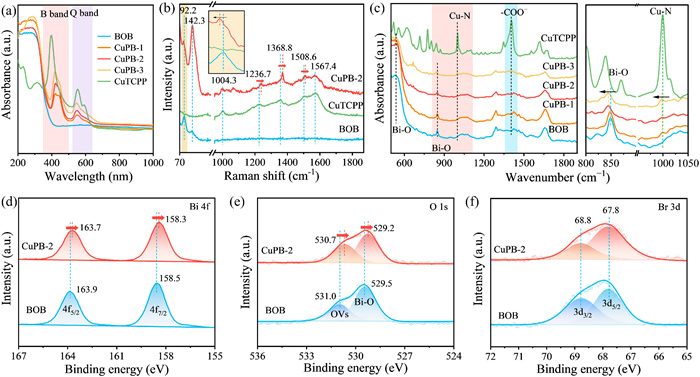
X-ray diffraction (XRD) technique was employed to investigate the phase composition of the prepared catalysts. The diffraction peaks of the pure BOB are well aligned with those of Bi12O17Br2 (JCPDS No. 37–0701). After the introduction of CuTCPP, the XRD patterns of the CuPB composite catalysts do not exhibit any new diffraction peaks, might be attributing to the relatively low loading of CuTCPP (Fig. S3 in Supporting information). With the adding amount of CuTCPP increases, the peak intensity of the CuPB composites shows a downward trend, which suggests that CuTCPP loaded on the surface of BOB. Fig. 2a shows the optical properties of prepared samples explored by ultraviolet-visible diffuse reflection spectroscopy (UV–vis DRS). The characteristic peaks in the ranges of 340–450 and 520–640 nm are attributed to the B band and Q band of CuTCPP, respectively [27]. Additionally, a shoulder peak appears at 440 nm, possibly arising from the intermolecular interactions within CuTCPP [25]. In the UV–vis absorption spectra (Fig. S4 in Supporting information), CuTCPP exhibits peaks at 418 and 541 nm, corresponding to B band and Q band. Compared to CuTCPP, the B band and Q band of CuPB are red-shifted, proving the ground state electrons interaction between the porphyrin molecule [33]. As the CuTCPP increases, the B band shows an increasing red-shift trend. This phenomenon provides evidence for the formation of the CuPB composite, demonstrating the interfacial interaction enhances the electron delocalization and decreases transition energy [27,34]. Raman spectroscopy was employed to further study the structure of catalysts. The Raman peaks at 92.2 and 142.3 nm-1 are attributed to A1g1 and A1g2 modes of BOB (Fig. 2b), respectively, corresponding to compression-type movement of Bi–O bonds in the Bi2O2 cluster layers and the coupling between magnetic and electric orders [35,36]. And peaks associated with CuTCPP are also observed in the Raman spectrum of CuPB-2, located at 1004.3 cm-1 (deformation motion of the phenyl ring), 1236.7 cm-1 (stretching mode of the phenyl ring), 1368.8 cm-1 (in-plane bending of C–H bonds in the phenyl ring), 1508.6 cm-1 (stretching mode of the pyrrole ring), and 1567.4 cm-1 (breathing vibration of the pyrrole ring) [37-40]. This proves the presence of CuTCPP in composite photocatalyst. Compared with BOB and CuTCPP monomer, Raman spectrum of CuPB-2 exhibits red shift in A1g1 mode and blue shift in phenyl and pyrrole ring, which indicates that interaction between BOB and porphyrin macrocycle leads to Bi–O tensile strain [41]. In the attenuated total reflection Fourier transform infrared (ATR-FTIR) spectra (Fig. 2c), the absorption peaks of 535.6 and 848.1 cm-1 belong to the Bi–O bond [42]. With the increase of the CuTCPP loading, the peak intensity of Bi–O bond gradually decreases, which suggests that CuTCPP loaded on the surface of BOB. Meanwhile, the characteristic peaks of CuTCPP in the composite material appear at 999.3 and 1404.9 cm-1, corresponding to the asymmetric tensile vibration modes of the Cu–N bond and -COO-, respectively [29,43]. In the ATR-FTIR spectra of CuPB, no peaks other than BOB and CuTCPP were observed, indicating no interfacial bonds formed between BOB and CuTCPP. The redshift of the Bi–O, Cu–N, and -COO− peaks in the ATR-FTIR spectra of CuPB-2 (Fig. 2c and Fig. S5 in Supporting information), along with the zeta potential analysis, demonstrate that BOB and CuTCPP are assembled through electrostatic forces. X-ray photoelectron spectroscopy (XPS) was performed to investigate the surface chemical state of BOB and CuPB-2. Both the XPS spectra and Cu electron paramagnetic resonance (EPR) signal confirmed the successful assembly of CuPB-2 (Fig. S6 in Supporting information) [44,45]. The high-resolution Bi 4f spectrum of BOB reveals characteristic peak at binding energies of 163.9 and 158.5 eV are assigned to Bi 4f5/2 and Bi 4f7/2 (Fig. 2d), respectively, corresponding to the Bi3+–O species [46]. The fitted peaks at 531.0 and 529.5 eV in the O 1s spectrum of BOB are attributed to oxygen species adsorbed at oxygen vacancies and lattice oxygen (Fig. 2e), respectively. As exhibited in the Br 3d spectrum of BOB, the peaks at 68.8 and 67.8 eV are identified as Br 3d3/2 and Br 3d5/2 (Fig. 2f), respectively, corresponding to Br− species [47]. In the high-resolution XPS of CuPB-2, the characteristic peaks of O 1s and Bi 4f exhibit a shift to the lower binding energy compared to those of BOB, suggesting that an electron redistribution occurs between BOB and CuTCPP. The above result indicates that the CuPB-2 heterojunction was constructed through strong electrostatic interactions between BOB and CuTCPP.
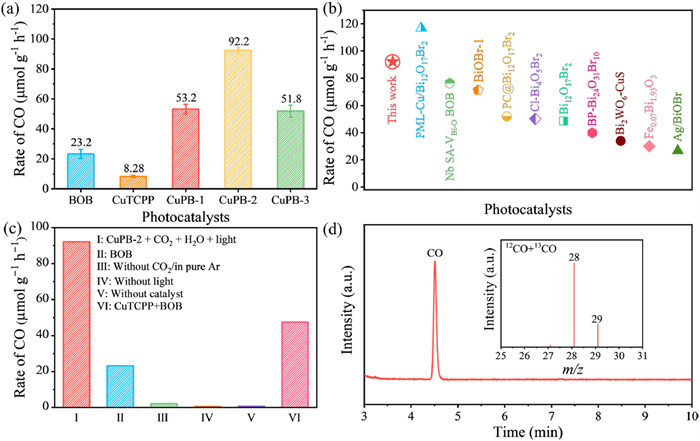
To evaluate the photocatalytic performance of BOB and the CuPB composite samples, photocatalytic CO2 reduction experiments were conducted in a closed reactor under a CO2 atmosphere. During the tests, 30 mg of the catalyst was uniformly dispersed in 50 mL of distilled water without the use of any cocatalysts or sacrificial agents. Except for CO, no peaks are observed in gas chromatogram and hydrogen nuclear magnetic resonance spectroscopy (H NMR) regarding CO2 reduction products (Fig. S7 in Supporting information). This shows that the CuPB-2 heterojunction can achieve 100% CO production. After 5 h of light irradiation, the CO yield of CuPB composites significantly increased compared to pure BOB and CuTCPP (Fig. S8 in Supporting information). The CO evolution rate for CuPB-2 is 92.2 μmol g−1 h−1, which is 4.0 and 11.1 times higher than that of BOB and CuTCPP, respectively (Fig. 3a). This suggests that the significant improvement in CO2 photoreduction activity is attributed to synergistic effects of CuPB heterojunction. Compared to other reported Bi-based catalysts tested in liquid-solid phase system, CuPB-2 maintains excellent performance in photocatalytic CO2 reduction (Fig. 3b and Table S2 in Supporting information). The stability of CuPB-2 was further evaluated over a 20 h irradiation, during which the CO yield exhibited a steady increase (Fig. S9 in Supporting information), highlighting the robust durability of the CuPB-2 heterojunction. Further analysis of the liquid phase after 5 h of irradiation revealed that H2O2 was the oxidative product (Fig. S10 in Supporting information). Trace CO were detected in control experiments conducted under pure Ar, in the dark, or in the absence of the catalysts (Fig. 3c), confirming the necessity of the photocatalytic experiments. Moreover, the CO revolution rate for the mixture of CuTCPP and BOB, fabricated using the impregnation method, is 47.5 μmol g−1 h−1, significantly lower than that of the CuPB-2 heterojunction synthesized via electrostatic self-assembly. To confirm the origin of CO product, a 13C isotope-labelling experiment was conducted on CuPB-2 using a mixture of 12CO2 and 13CO (Fig. 3d). The total ions chromatographic shows a peak at 4.51 min contributing to CO. The corresponding mass spectrum analysis reveals peaks at m/z = 28 and 29 are attributed to 12CO and 13CO, respectively. This isotopic labelling study testifies that the CO product originates from the reduction of CO2.
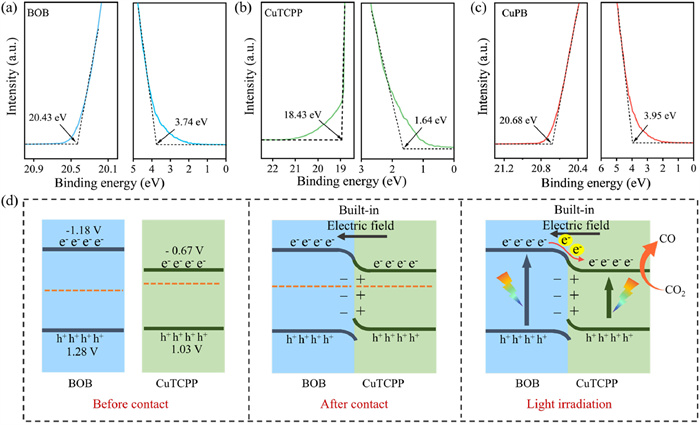
The bandgap energies (Eg) were determined using the (αEphoton)1/2 vs. Ephoton plots. The slope of the curve is extrapolated to the x-axis, and the intercept represents the Eg of photocatalysts [48]. As displayed in Fig. S11a (Supporting information), the Eg are 2.46 eV for BOB and 1.70 eV for CuTCPP, which is close to the research reported [49,50]. According to XPS valence band (XPS VB) spectra (Fig. S11b in Supporting information), the valance band energies (EVB) of BOB and CuTCPP are determined to be 1.28 and 1.03 V (vs. NHE, pH 7), respectively. The conduction band energy (ECB) is calculated to be −1.18 V for BOB and −0.67 V for CuTCPP based on the formula ECB = EVB − Eg [51].
According to ultraviolet photoelectron spectroscopy (UPS), the work function (Ф) of BOB, CuTCPP and CuPB-2 are calculated to be 4.53, 4.43 and 4.49 eV, respectively (Figs. 4a-c) [52]. Based on the above analysis, the Feimi level (EFermi) of CuTCPP is higher than that of BOB, and the EFermi of CuPB-2 heterojunction lies intermediate between BOB and CuTCPP. When CuTCPP and BOB contact, electrons will flow from CuTCPP to BOB to equilibrate the EFermi, resulting in a built-in electric field constructed at the interface between CuTCPP and BOB [53,54]. Consequently, upon irradiation, the photoexcited electrons will migrate from BOB to CuTCPP (Fig. 4d).
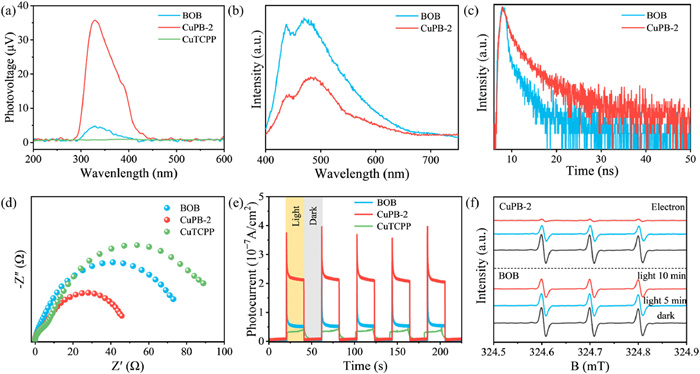
To further explore the charge transfer mechanism of CuPB-2, surface photovoltage (SPV) measurement was carried out to demonstrated (Fig. 5a). Compared with pure BOB and CuTCPP, the SPV response of CuPB-2 significantly increases, suggesting the enhanced charge separation efficiency in the CuPB-2 heterojunction [55]. The charge separation dynamics were further explored by photoluminescence (PL) spectroscopy. The steady-state PL spectra (Fig. 5b) show that the apparent PL quenching in CuPB-2 suggests a decrease in the recombination of photoexcited electron-hole pairs [56]. Moreover, time-resolved PL decay spectra were analyzed by tri-exponential fitting (Fig. 5c and Table S3 in Supporting information). The lifetime τ1 represents the radiative decay process of electrons from the CB or defect state to the VB of semiconductor. The longer τ1 lifetime observed for CuPB-2 compared to BOB indicates the lower charge carriers’ recombination rate [57]. Meanwhile, the higher proportion and shorter lifetime of τ3 in CuPB-2 suggest the presence of a rapid electron transfer channel in the electrostatically assembled CuPB-2 heterojunction. CuPB-2 displays longer average lifetime than that of BOB, further indicating the faster electron transfer kinetics in CuPB-2 heterojunction [58]. The charge transfer behaviors were evaluated by electrochemical impedance spectra (EIS) and transient photocurrent response curves. As shown in Fig. 5d, the Nyquist plot radius of CuPB-2 is smaller than BOB and CuTCPP, confirming the smaller charge transfer resistance at the interface between BOB and CuTCPP [59]. The current density value of CuPB-2 is much higher than those of BOB and CuTCPP (Fig. 5e), verifying that more electrons are rapidly transferred to the surface of CuPB-2 [60]. Electron spin resonance (ESR) was conducted to determine the concentration of electrons and holes. 2,2,6,6-Tetramethylpiperidine-1-oxyl (TEMPO) with unpaired electrons exhibits triplet signals with an intensity of 1:1:1 in the dark. Upon illumination, the signals intensity would decrease due to the facts that TEMPO react with photoexcited electrons to form TEMPOH in aqueous solution or react with holes to form TEMPO+ in acetonitrile solution [61]. Compared to BOB, the signals of TEMPO-e− and TEMPO-h+ in CuPB-2 were more significantly suppressed after light exposure (Fig. 5f and Fig. S12 in Supporting information). This demonstrates that higher concentration of electrons and holes are transferred to the surface of CuPB-2, thereby facilitating photocatalytic CO2 reduction.
The hydrophilicity of BOB and CuPB-2 were analyzed by water contact angle experiments. As displayed in Fig. S13 (Supporting information), the contact angle of BOB is measured at 15°, while CuPB-2 exhibits a higher contact angle of 19°, indicating that CuPB-2 has a more hydrophobic surface. The hydrophobicity of CuPB-2 might suppress the hydrogen evolution reaction, thereby enhancing the photoreduction CO2 activity and selectivity over the CuPB-2 heterojunction [62]. Linear sweep voltammetry (LSV) was further analyzed for the electron competition between CO2 reduction and hydrogen evolution during the photoreduction process. As shown in Fig. S14 (Supporting information), under an Ar atmosphere, the cathodic current mainly originates from hydrogen evolution reaction, whereas under a CO2 atmosphere, the current is mainly derived from CO2 reduction reaction. CuPB-2 shows a higher current in CO2 atmosphere than in Ar atmosphere, demonstrating its preference for the CO2 reduction reaction. After illumination, the current density of CuPB-2 significantly increases, suggesting the significant role of light in driving CO2 reduction process.
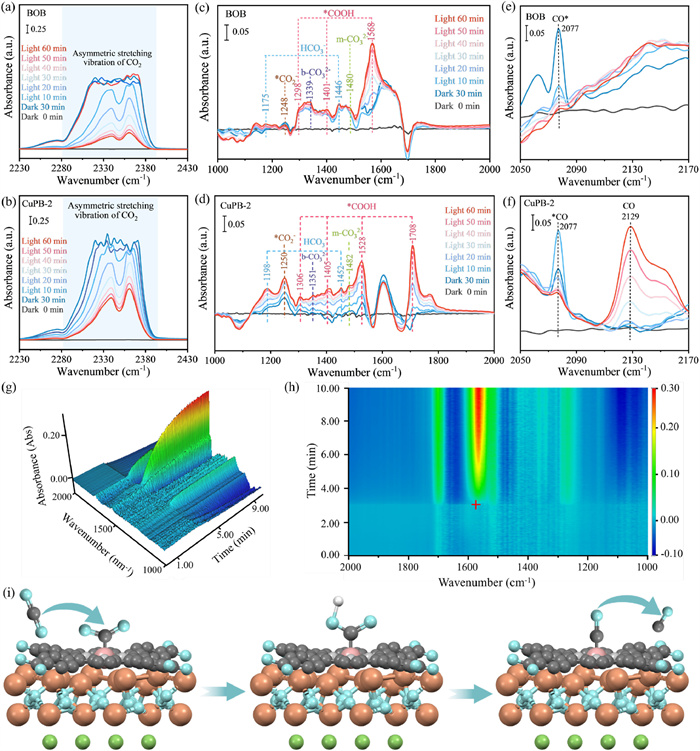
The process of CO2 adsorption, activation, and conversion on the catalyst surface was investigated using in situ DRIFTS. The vibrational bands at 2334 and 2360 cm−1 correspond to the asymmetric stretching vibration of O=C=O [63,64]. As the CuTCPP loading increases, the CO2 adsorption peaks progressively intensify, indicating that CuTCPP promotes the adsorption of CO2 (Fig. S15 in Supporting information). Furthermore, as displayed in Fig. S16 (Supporting information), the CO2 adsorption capacity of CuPB-2 significantly enhances upon CO2 injection in the dark, suggesting a greater amount of CO2 is restrained on the CuPB-2 surface. The decrease of CO2 adsorption peaks (Figs. 6a and b) and vanishment of Cu(Ⅱ) signal in EPR spectra (Fig. S6b) after irradiation reveal that photogenerated electrons accumulate at the Cu(Ⅱ) active sites and react with the absorbed CO2 [65]. The in situ DRIFTS spectra of the intermediates over BOB shown in Fig. 6c, peaks at 1248, 1339 and 1480 cm−1 are respectively assigned to *CO2−, b-CO32−, and m-CO32− [66-68], while peaks at 1175 and 1446 cm−1 are assigned to HCO3− [66,69]. In CuPB-2, these peaks display a blue shift due to d-orbital coupling between Cu(Ⅱ) active sites and reaction intermediate, strengthening the chemical bonding of the intermediates (Fig. 6d). Furthermore, characteristic peaks at 1298, 1401, and 1568 cm−1 are assigned to the key intermediate *COOH over BOB [70,71]. In contrast, CuPB-2 exhibits distinct vibrational signatures of *COOH. Specifically, the strongest characteristic peak of *COOH over BOB appears at 1568 cm−1, corresponding to the b-*COOH configuration. For CuPB-2, the b-*COOH peak rapidly increases during the initial photoreduction period, while the m-*COOH peak at 1708 cm−1 becomes dominant after 20 min of light exposure (Figs. 6d, g and h). This difference originates from the existence of Cu(Ⅱ) active site, which alters the adsorption configuration of the intermediate [72]. As shown in Figs. 6e and f, the peak at 2077 cm−1 corresponds to *CO [73]. The *CO intensity was strongest at 10 min of light exposure (Figs. S17 and S18 in Supporting information), indicating the initial accumulation of *CO at the beginning of the reaction. As the reaction time extends, the *CO peak diminishes and stabilizes, indicating an equilibrium between the formation and desorption of *CO. CuPB-2 exhibits a larger peak area after reaching equilibrium, suggesting that the Cu(Ⅱ) sites accelerate the formation of *CO intermediate. Therefore, more prominent CO peaks at 2129 cm−1 are observed in Fig. 6f. Based on above analysis, the possible photocatalytic CO2 reduction process on CuPB-2 was shown in Fig. 6i.
In summary, CuTCPP was anchored onto the surface of Bi12O17Br2 nanotubes to construct a CuTCPP/Bi12O17Br2 heterojunction for photocatalytic CO2 reduction. Owing to the built-in electric field at the interface, photoexcited electrons effectively transfer from Bi12O17Br2 to CuTCPP, which significantly promotes charge separation and transfer efficiency. The Cu(Ⅱ) active sites significantly enhance CO2 adsorption and activation, promoting the generation of *CO intermediates. The CuTCPP/Bi12O17Br2 heterojunction exhibits a CO evolution rate of 92.2 μmol g−1 h−1 under irradiation, representing a 4.0-fold enhancement compared to Bi12O17Br2 monomer. This work establishes valuable insights into the development of heterojunctions that optimize charge transfer and active sites.
The authors declare that they have no known competing financial interests or personal relationships that could have appeared to influence the work reported in this paper.
Tiange Wei: Writing – original draft, Validation, Methodology, Investigation, Formal analysis, Data curation, Conceptualization. Mengxia Ji: Writing – review & editing, Validation, Methodology, Investigation, Formal analysis, Conceptualization. Yi Zhang: Writing – review & editing, Validation, Methodology, Investigation, Formal analysis, Conceptualization. Keke Wang: Validation, Resources, Investigation, Formal analysis. Meng Wang: Validation, Investigation. Yuanbin She: Writing – review & editing, Resources, Conceptualization. Jiexiang Xia: Writing – review & editing, Resources, Methodology. Huaming Li: Supervision, Resources, Funding acquisition, Conceptualization.
This work was supported by the National Natural Science Foundation of China (Nos. 22138011 and 22378172) and the Outstanding Youth Fund of Jiangsu Province (No. BK20240043).
Supplementary material associated with this article can be found, in the online version, at doi:
S.Y. Fang, M. Rahaman, J. Bharti, et al., Nat. Rev. Methods Primer. 3 (2023) 61. doi: 10.1038/s43586-023-00243-w
C. Zhang, M. Akhlaq, H.F. Yan, et al., Agr. Water Manage. 284 (2023) 108333. doi: 10.1016/j.agwat.2023.108333
M. Bonchio, J. Bonin, O. Ishitani, et al., Nat. Catal. 6 (2023) 657–665. doi: 10.1038/s41929-023-00992-7
J. Xie, Z.J. Lu, Y. Feng, et al., Nano Res. 17 (2024) 297–306. doi: 10.1007/s12274-023-5828-2
Y. Tao, J.P. Guan, J. Zhang, et al., Angew. Chem. Int. Ed. 63 (2024) e202400625. doi: 10.1002/anie.202400625
X.C. Jiao, K. Zheng, L. Liang, et al., Chem. Soc. Rev. 49 (2020) 6592–6604. doi: 10.1039/d0cs00332h
A.A. Saraev, A.Y. Kurenkova, D.D. Mishchenko, et al., Trans. Tianjin Univ. 30 (2024) 140–151. doi: 10.1007/s12209-024-00384-3
S.Y. Xu, W.X. Shi, J.R. Huang, et al., Angew. Chem. Int. Ed. 63 (2024) e202406223. doi: 10.1002/anie.202406223
J.T. Dong, J.Z. Zhao, X.W. Yan, et al., Appl. Catal. B: Environ. Energy 351 (2024) 123993. doi: 10.1016/j.apcatb.2024.123993
J.M. Yang, K.F. Tang, X.W. Zhu, et al., Chem. Eng. J. 461 (2023) 141841. doi: 10.1016/j.cej.2023.141841
X.L. Zheng, Y.Q. Yang, Y.M. Song, et al., Interdiscip. Mater. 2 (2023) 669–688. doi: 10.1002/idm2.12120
S.H. Zhou, W.R. Ma, U. Anjum, et al., Nat. Commun. 14 (2023) 5872. doi: 10.1038/s41467-023-41362-y
L. Jiang, H.R. Du, L. Li, et al., Trans. Tianjin Univ. 29 (2023) 462–472. doi: 10.1007/s12209-023-00376-9
L. Liu, J.C. Hu, Z.Y. Ma, et al., Nat. Commun. 15 (2024) 305. doi: 10.1007/978-981-99-6423-9_7
J. Di, J.X. Xia, H.M. Li, S.J. Guo, S. Dai, Nano Energ. 41 (2017) 172–192. doi: 10.1016/j.nanoen.2017.09.008
H.Q. Wang, Z.H. Chen, Y.R. Shang, et al., ACS Catal. 14 (2024) 5779–5787. doi: 10.1021/acscatal.3c06169
C.C. Jiao, G.X. Dong, K. Su, et al., Chin. Chem. Lett. 37 (2026) 110752. doi: 10.1016/j.cclet.2024.110752
D.J. Feng, X.Y. Li, Y.P. Liu, X.B. Chen, S.J. Li, Renewables 1 (2023) 485–513. doi: 10.31635/renewables.023.202300037
J. Di, C. Zhu, M.X. Ji, et al., Angew. Chem. Int. Ed. 57 (2018) 14847–14851. doi: 10.1002/anie.201809492
S.K. Xue, C.G. Wei, M. Shen, et al., Proc. Natl. Acad. Sci. U. S. A. 121 (2024) e2319751121. doi: 10.1073/pnas.2319751121
Y.T. Yu, Z.J. Zhu, F. Chen, T.Y. Ma, H.W. Huang, Adv. Mater. 36 (2024) 2413835. doi: 10.1002/adma.202413835
Y.M. Feng, D.M. Chen, M. Niu, et al., Appl. Catal. B: Environ. Energy 365 (2025) 124931. doi: 10.1016/j.apcatb.2024.124931
J.Y. Guo, H.B. Sun, X.Z. Yuan, et al., Water Res. 219 (2022) 118558. doi: 10.1016/j.watres.2022.118558
W.J. Yang, K.L. Sun, J. Wan, et al., Appl. Catal. B 320 (2023) 121978. doi: 10.1016/j.apcatb.2022.121978
N. Zhang, L. Wang, H.M. Wang, et al., Nano Lett. 18 (2018) 560–566. doi: 10.1021/acs.nanolett.7b04701
E.S.D. Silva, N.M.M. Moura, M.G.P.M.S. Neves, et al., Appl. Catal. B 221 (2018) 56–69. doi: 10.22478/ufpb.1809-4775.2017v13nespec.38579
J.F. Jing, J.S. Li, Y.G. Su, Y.F. Zhu, Appl. Catal. B: Environ. Energy 324 (2023) 122284. doi: 10.1016/j.apcatb.2022.122284
H.Y. Gao, J.Y. Wang, M.Y. Jia, et al., Chem. Eng. J. 374 (2019) 684–693. doi: 10.1016/j.cej.2019.06.002
L. Wang, S.H. Duan, P.X. Jin, et al., Appl. Catal. B: Environ. Energy 239 (2018) 599–608. doi: 10.1016/j.apcatb.2018.08.007
J.J. Liu, D. Yang, Y. Zhou, et al., Angew. Chem. Int. Ed. 60 (2021) 14473–14479. doi: 10.1002/anie.202103398
Y. Zhang, F.Y. Guo, J. Di, et al., Nano Micro Lett. 16 (2024) 90. doi: 10.1007/s40820-023-01309-w
J. Lu, H.C. Zhang, J. Hou, et al., Nat. Mater. 19 (2020) 767–774. doi: 10.1038/s41563-020-0634-7
C.B. Kc, F. D’Souza, Coord. Chem. Rev. 322 (2016) 104–141. doi: 10.1016/j.ccr.2016.05.012
F. D’Souza, O. Ito, Chem. Commun. (2009) 4913. doi: 10.1039/b905753f
M.M. Ferrer, J.E.F.S. Rodrigues, M.A.P. Almeida, et al., J. Raman Spectrosc. 49 (2018) 1356–1363. doi: 10.1002/jrs.5377
P.C. Sati, M. Arora, S. Chauhan, S. Chhoker, M. Kumar, J. Appl. Phys. 112 (2012) 094102. doi: 10.1063/1.4761968
B. Yu, J.L. Xing, P. Zhang, et al., Inorg. Chem. 64 (2025) 1258–1262. doi: 10.1021/acs.inorgchem.4c05080
J.M. Wan, H.G. Wang, Z.Z. Wu, et al., Phys. Chem. Chem. Phys. 13 (2011) 10183. doi: 10.1039/c0cp02933e
M. Aydin, Vib. Spectrosc. 68 (2013) 141–152. doi: 10.1016/j.vibspec.2013.06.005
A. Fularz, S. Almohammed, J.H. Rice, et al., ACS Sustainable Chem. Eng. 9 (2021) 16808–16819. doi: 10.1021/acssuschemeng.1c06685
J.J. Wang, W. Tang, Z.Z. Zhu, et al., Angew. Chem. Int. Ed. 64 (2025) e202423658. doi: 10.1002/anie.202423658
Y. Zhang, F.Y. Ma, M.H. Ling, et al., Chem. Eng. J. 464 (2023) 142762. doi: 10.1016/j.cej.2023.142762
M.T. Ma, L.K. Xiong, Y. Dong, et al., Adv. Funct. Mater. 34 (2024) 2315667. doi: 10.1002/adfm.202315667
X.C. Zhang, Y.R. Zhang, X. Fan, W.B. Song, ACS Sens. 9 (2024) 3253–3261. doi: 10.1021/acssensors.4c00608
V. Polliotto, S. Livraghi, A. Krukowska, et al., ACS Appl. Mater. Interfaces 10 (2018) 27745–27756. doi: 10.1021/acsami.8b05528
Q.L. Wang, Z.R. Miao, Y.F. Zhang, et al., ACS Catal. 12 (2022) 4016–4025. doi: 10.1021/acscatal.1c05553
J. Xie, Z.J. Lu, Y. Feng, et al., Nano Res. 17 (2024) 297–306. doi: 10.1007/s12274-023-5828-2
J. Yuan, F. Chen, W.H. Feng, et al., Adv. Mater. 37 (2025) 2504015. doi: 10.1002/adma.202504015
J. Di, P. Song, C. Zhu, et al., ACS Mater. Lett. 2 (2020) 1025–1032. doi: 10.1021/acsmaterialslett.0c00306
Y.P. Dong, R. Nie, J.X. Wang, et al., Chin. J. Catal. 40 (2019) 1222–1230. doi: 10.1016/S1872-2067(19)63375-9
Y. Dai, W.G. Peng, Y. Ji, et al., J. Food Sci. 89 (2024) 8022–8035. doi: 10.1111/1750-3841.17398
X.J. Zou, Y.Y. Dong, J. Ke, et al., Chem. Eng. J. 400 (2020) 125919. doi: 10.1016/j.cej.2020.125919
H.F. Li, Y.H. Zhang, J.M. Li, et al., Chin. J. Catal. 69 (2025) 111–122. doi: 10.1016/S1872-2067(24)60191-9
L. Zhang, B.H. Wang, W. Yang, Chin. Chem. Lett. 37 (2026) 111142. doi: 10.1016/j.cclet.2025.111142
X.Y. Meng, S.Y. Wang, C.C. Zhang, et al., ACS Catal. 12 (2022) 10115–10126. doi: 10.1021/acscatal.2c01877
X.J. Du, W.H. Du, J. Sun, D. Jiang, Food Chem. 385 (2022) 132731. doi: 10.1016/j.foodchem.2022.132731
W.L. Li, Z. Wei, K.J. Zhu, et al., Appl. Catal. B 306 (2022) 121142. doi: 10.1016/j.apcatb.2022.121142
K.Y. Ma, J.X. Li, J.L. Liu, et al., Nano Res. 17 (2024) 3653–3659. doi: 10.1007/s12274-023-6258-x
J.J. Lai, L.J. Ding, Y. Liu, et al., Food Chem. 423 (2023) 136285. doi: 10.1016/j.foodchem.2023.136285
L.J. Luo, X.H. Liu, S. Ma, L.B. Li, T.Y. You, Food Chem. 423 (2023) 136285. doi: 10.1016/j.foodchem.2023.136285
Q.Q. Zhang, Y.C. Chu, Z.L. Liu, et al., Appl. Catal. B: Environ. Energy 331 (2023) 122688. doi: 10.1016/j.apcatb.2023.122688
X.L. Liu, C.X. Huang, B. Ouyang, et al., Chem. Eur. J. 28 (2022) e202201034. doi: 10.1002/chem.202201034
X.Y. Yue, L. Cheng, F. Li, J.J. Fan, Q.J. Xiang, et al., Angew. Chem. Int. Ed. 61 (2022) e202208414. doi: 10.1002/anie.202208414
Z.G. Li, G.Q. Zhu, W.B. Zhang, et al., Chem. Eng. J. 452 (2023) 139378. doi: 10.1016/j.cej.2022.139378
T.Y. Yang, Y.M. Dong, C.Y. Liu, et al., Adv. Funct. Mater. 35 (2025) 2422348. doi: 10.1002/adfm.202422348
M.J. Cheng, B. Gao, X.L. Zheng, et al., Appl. Catal. B: Environ. Energy 353 (2024) 124097. doi: 10.1016/j.apcatb.2024.124097
X.C. Jiao, X.D. Li, X.Y. Jin, et al., J. Am. Chem. Soc. 139 (2017) 18044–18051. doi: 10.1021/jacs.7b10287
Z.X. Lin, Z.W. Yang, J.J. Wang, et al., Adv. Mater. 37 (2025) 2408906. doi: 10.1002/adma.202408906
H. Li, C.L. Gao, G. Yang, et al., Chin. Chem. Lett. 36 (2025) 110547. doi: 10.1016/j.cclet.2024.110547
J.Y. Wang, T.T. Bo, B.Y. Shao, Appl. Catal. B 297 (2021) 120498. doi: 10.1016/j.apcatb.2021.120498
Z.R. Miao, Q.L. Wang, Y.F. Zhang, L.P. Meng, X.X. Wang, Appl. Catal. B 301 (2022) 120802. doi: 10.1016/j.apcatb.2021.120802
J.C. Wu, J.C. Zhu, W.Y. Fan, et al., Nano Lett. 24 (2024) 696–702. doi: 10.1021/acs.nanolett.3c04012
T.T. Zhang, B.W. Yuan, W.L. Wang, et al., Angew. Chem. Int. Ed. 62 (2023) e202302096. doi: 10.1002/anie.202302096

Figure 1 (a) Zeta potential measurements of BOB, CuTCPP and CuPB-2. (b) Schematic diagram of the assembly process of CuPB. (c) TEM and (d) HR-TEM of CuPB-2. (e) Element mapping images of Bi, O, Br and Cu over CuPB-2.

Figure 2 (a) UV–vis DRS of prepared samples. (b) Raman spectra of BOB, CuTCPP, and CuPB-2. (c) ATR-FITR spectra of prepared catalysts. High-resolution XPS spectra of BOB and CuPB-2: (d) Bi 4f; (e) O 1s, and (f) Br 3d.

Figure 3 (a) CO production rates of prepared catalysts. (b) Comparison of CO2 photoreduction performance with other Bi-based materials. (c) CO production rates of CuPB-2 under different conditions (without CO2/in pure Ar, without light, without catalyst) and CuTCPP+BOB catalyst prepared by impregnation method. (d) The total ions chromatographic in photoreduction CO2 process with 12CO2+13CO2 and the corresponding mass spectra at the reaction time of 4.51 min over CuPB-2.

Figure 4 UPS of (a) BOB, (b) CuTCPP and (c) CuPB-2. (d) Internal electric structure model of CuPB-2.

Figure 5 (A) SPV spectra of BOB, CuPB-2 and CuTCPP. (b) Steady-state PL spectra and (c) time-resolved PL decay spectra of BOB and CuPB-2. (d) EIS and (e) transient photocurrent response spectra of BOB, CuTCPP and CuPB-2. (f) TEMPO-e− ESR spectra of BOB and CuPB-2 in the dark, upon irradiation for 5 and 10 min.

Figure 6 In situ DRIFTS of photocatalytic CO2 reduction process: asymmetric stretching vibration of CO2 over (a) BOB and (b) CuPB-2; the intermediates during the photoreduction process over (c) BOB and (d) CuPB-2; the *CO and CO over (e) BOB and (f) CuPB-2. (g) 3D time-resolved FTIR spectra and (h) 2D color-projected map over CuPB-2. (i) Adsorption configurations of key intermediates over CuPB-2.

 扫一扫看文章

扫一扫关注我们
 DownLoad:
 下载:
下载:
 下载:
下载: