Figure 1.
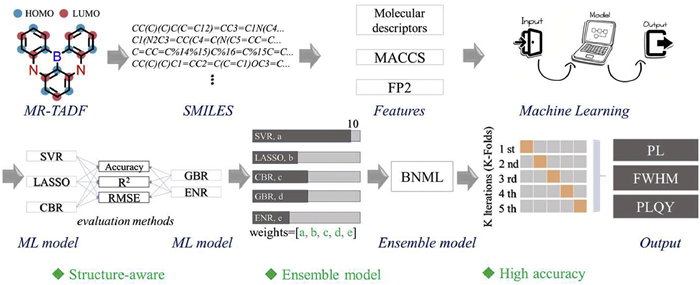
Schematic diagram of the BNML model structure design and machine learning modeling process of MR-TADF compounds.
Structure-aware machine learning for predicting photophysical properties of MR-TADF materials
Zhiyuan Chen , Jinyu Song , Lai Hu , Peng Xu , Zhengyi Sun , Xiao-Chun Hang , Hongjun Zhu , Senqiang Zhu , Rui Liu

Multi-resonance thermally activated delayed fluorescence (MR-TADF) materials are considered promising candidates for next-generation organic light-emitting diode (OLED) emitters due to their unique ability to achieve narrowband emission and 100% internal quantum efficiency [1–10]. Distinct from conventional TADF materials, MR-TADF compounds realize efficient emission through unique molecular engineering strategies. Typically, they feature a rigid π-conjugated planar centered around a boron (B) atom, which facilitates stable electron delocalization. By introducing electron-donating atoms, such as nitrogen (N), oxygen (O), and sulfur (S) atoms, at para positions relative to the boron center, generating strong resonance effects and constructing short-range charge transfer (SR-CT) channels, enabling the rapid migration of intra-molecular charges within an extremely small spatial scale. This type of materials ensures a small energy level difference (ΔEST) between the singlet state (S1) and the triplet state (T1) (<0.5 eV), promoting excitons' efficient triplet-to-singlet delivery via reverse intersystem crossing (RISC), thereby enhancing photoluminescence quantum yield (PLQY >80%). Meanwhile, the synergistic effect between the rigid π-conjugated skeleton and the donor-acceptor units significantly reduces excited-state structural relaxation, resulting in narrowband emission characteristics (<50 nm). Obviously, the full width at half maximum (FWHM) of the emission, the photoluminescence quantum yield (PLQY), and the photoluminescence emission wavelength (PL), play a critical role in evaluating the emission performance of MR-TADF compounds [11–13].
With the continuous advancement of display technology, the new Broadcast Television Standard (BT2020), released by the International Telecommunication Union (ITU) in 2012, has set significantly higher requirements for color performance. It mandates that the chromaticity coordinates of the three primary colors, as defined by the Commission Internationale del'Éclairage (CIE), should reach (0.708, 0.292), (0.170, 0.797), and (0.131, 0.046) for red, green, and blue, respectively [14,15]. In this context, constructing new types of MR-TADF molecules with narrow spectral emission and high efficiency to meet the requirements of high-standard color display has become an important direction for promoting the development of OLED material. However, the photoluminescence performance of MR-TADF materials is highly dependent on the molecular configuration, and their PL, PLQY, and FWHM properties are governed by a combination of structural and conformational factors [16–18]. At present, performance evaluation of newly designed MR-TADF compounds primarily relies on two approaches: density functional theory (DFT) simulations and experimental validation. Due to the structural sensitivity of MR-TADF performance, an extensive amount of screening and synthesis is often required within a vast molecular design space, making the process time-consuming and labor-intensive. Although DFT and time-dependent DFT (TD-DFT) methods can accurately predict key excited-state parameters and offer key references for molecular design, their high computational cost and time demands render them unsuitable for high-throughput screening and rapid iterative optimization. These factors are becoming the bottleneck of rapid development of new materials.
In recent years, QSPR-based (quantitative structure-property relationships) machine learning (ML) enables rapid prediction of target material properties via mathematical models linking molecular structures to performance [19–21]. Its core strengths include data-driven extraction of hidden molecular features without complex calculations, which facilitates efficient handling of large datasets for high-throughput screening, and strong nonlinear fitting capabilities that accurately capture structural impacts on properties [22–24]. These strengths have allowed ML to demonstrate broad application potential across various material systems, such as perovskite photovoltaics [25–27], organic emitters [28,29], and bio-functional molecules [30–32].
Currently, machine learning in the research of TADF materials has been able to predict properties and better assist molecular design, demonstrating great promise [33,34]. Machine learning research on MR-TADF has also gained momentum in the last two years. In 2024, Shi et al. [35] introduced PLQY as prediction targets. By combining E-state and other electronic properties descriptors, they achieved high-precision regression prediction of PLQY for 402 MR-TADF molecules through models such as XGBoost and neural networks (NN) with the highest test accuracy of 88%, and significantly improved the screening efficiency by using a variational autoencoders (VAE) for high-throughput virtual screening. This year, Adachi et al. [36] established an interpretable QSPR model by combining molecular fingerprints and the kernel-based partial least-squares (KPLS) algorithm. They accurately predicted the main emission wavelength (λpeak) and FWHM of more than 400 MR-TADF molecules (λpeak, R2 = 0.87, RMSE = 21.4), successfully designed and synthesized ν-DABNA-O-xy, and developed a deep blue OLED device with an external quantum efficiency (EQE) of 41.3%, demonstrating the guiding value of ML in the design of practical devices. Despite the progress made in machine learning-based modeling of MR-TADF materials, several challenges remain. Most studies are concentrated on a single property, typically the PLQY value, which limits comprehensive evaluation. Common feature types, such as electrotopological state (E-state) indices or topological descriptors, fail to reflect crucial structural features. Moreover, existing models usually rely on pure regression models, which often result in evaluation metrics such as accuracy not performing perfectly. This restricts their practical application in new material screening. Consequently, there is a current need for a prediction framework that not only integrates multiple structural features and supports interpretability but also enables more accurate and practical property predictions.
For this, we propose a structure-aware ensemble learning model (BNML) that integrates multiple molecular representations, including molecular access system (MACCS) fingerprints, fingerprint2 (FP2) fingerprints, and molecular descriptors (MDs), to predict three photophysical properties (PL, FWHM, and PLQY) of MR-TADF materials. The BNML model consists of five base learners and demonstrates strong generalization capability when trained on the combined feature set, as illustrated in Fig. 1. It is important to note that BNML(Ⅰ) is a model for training and predicting fixed-value results, while BNML(Ⅱ) is a model for training and predicting range-value results. Under small-data (415) conditions, the model achieves high regression accuracy, with prediction reaching nearly 100% correctness (100%, 100%, and 96%, respectively) for specific target intervals. By incorporating SHapley Additive exPlanations (SHAP) analysis, this model can provide interpretable insights into structure-property relationships, highlighting the roles of donor/acceptor fragments and conjugated fragments in regulating emission behavior. Fifteen novel MR-TADF molecules were designed based on key features, and the trained BNML model was employed to predict their properties (PL, FWHM, and PLQY). For experimental verification, seven of these molecules were synthesized. The test results showed that there was only a deviation in the PL performance of one molecule. This demonstrates the excellent predictive performance of the model in three performance indicators. This work not only provides a performance prediction strategy that balances efficiency, accuracy, and interpretability but also offers theoretical and methodological support for achieving structure-driven design and intelligent screening of MR-TADF materials.
Since the first report of the prototypical MR-TADF compound (DABNA) by Hatakeyama's group in 2016 [1], boron-centered MR-TADF materials have attracted considerable attention, with a rapidly growing number of derivatives and continuous advancements in related studies. By the end of this work, 415 compounds with different structures were included in many journals as the dataset of this work. Each entry includes the standardized molecular structure, PL, FWHM, PLQY, corresponding test methods, special conditions annotation, and sources (Fig. S1 in Supporting information).
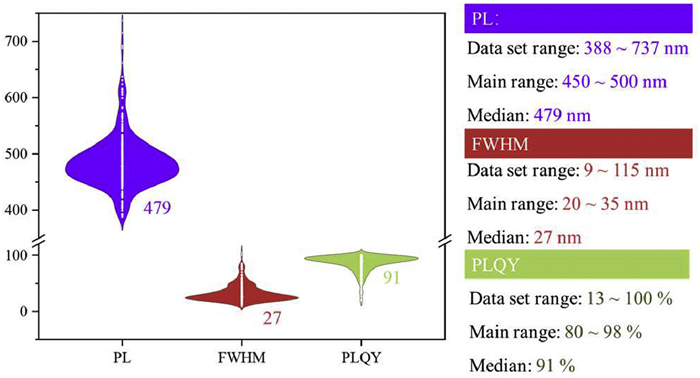
This dataset reflects the high variability in the photophysical properties of MR-TADF materials. The recorded PL values range from 388 nm to 737 nm, FWHM values from 9 nm to 115 nm, and PLQYs span from as low as 13% to as high as 100% (Fig. 2). Although all molecules are derived from the DABNA framework, their emission properties vary significantly due to differences in donor/acceptor substitution, the extent of π-conjugation, and conformational diversity. Currently, the research on MR-TADF materials mainly focuses on blue-green light (450–500 nm), with a median wavelength of 479 nm. There is a deficiency in the development of long-wavelength materials, specifically narrowband green and red emission materials. When developing long-wavelength MR-TADF materials, especially green emission materials, structural modulation strategies such as introducing electron-donating groups or expanding the conjugated region are commonly adopted. This structural modulation renders the excited states of molecules more complex, thus significantly influencing other photophysical properties (FWHM and PLQY). As a result, it becomes extremely challenging to precisely identify efficient MR-TADF materials that meet the BT.2020 standard. This further emphasizes the necessity of constructing a predictive tool that is both versatile and efficient.
To address this, we studied several mainstream machine-learning theory, including support vector machines (SVM) [37], gradient boosting decision trees (GBDT) [38], and elastic net (EN) [39]. Five representative regression models, support vector regression (SVR) [40], CatBoost regression (CBR) [41], gradient boosting regression (GBR) [42], least absolute shrinkage and selection operator (LASSO) [43], and elastic net regression (ENR) [44], were selected as base learners, as they cover datasets of various levels of complexity, as well as the forms of features and results. All models were trained and evaluated using five-fold cross-validation, and their performance was assessed by three metrics: coefficient of determination (R2), root mean square error (RMSE), and accuracy. Based on their prediction results, we constructed a structure-aware ensemble model (BNML) by combining the outputs of all base models through a dynamic weighting strategy. GridSearchCV was used to optimize the hyperparameters of each model before integration. The BNML model was applied to train on the curated dataset and subsequently used to predict PL, FWHM, and PLQY for newly designed MR-TADF compounds.
The chemical structures of 415 MR-TADF compounds were converted into simplified molecular input line entry system (SMILES) strings composed of standardized atomic symbols, offering a mathematically tractable format for molecular processing [45]. Using cheminformatics toolkits such as RDKit [46], a total of 208 molecular descriptors (MDs) were extracted for each compound to quantitatively represent their structural features, physical properties, and chemical properties (Fig. 3a).
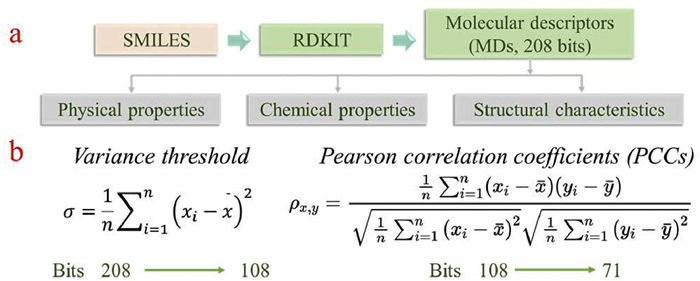
To reduce redundancy among features, an initial screening was performed using the variance threshold method [47], reducing the descriptor space from 208 bits to 108 bits. Correlation heatmap analysis revealed that linear dependencies still existed among the retained features (Fig. 3b). Therefore, Pearson correlation coefficient (PCC) filtering was further applied as a secondary step [48], resulting in a final set of 71 bits. As shown in Fig. 3b, the two-step screening significantly reduced feature collinearity, providing a more stable basis for subsequent model training. Details of the thermal map are shown in Figs. S14 and S15 (Supporting information).
The filtered MDs features, along with the three target variables (PL, FWHM, and PLQY), were used to construct the training and testing sets at a ratio of 8:2. Through the random_state function, the training and test sets selected in each run are fixed, enabling the results to achieve reproducibility. The training and prediction were conducted using the BNML(Ⅰ) ensemble framework. Performance details of the individual base models are provided in Supporting information and are not discussed in detail here due to their lower predictive performance compared to the ensemble model (Figs. S2–S13 in Supporting information).
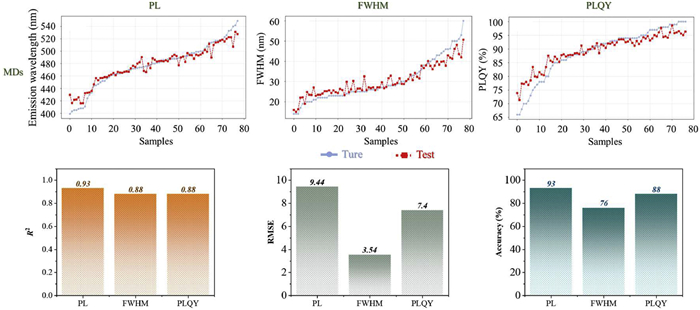
As shown in Fig. 4, most predictions aligned well with experimental values among the 83 test samples, although several outliers were observed. For the three prediction tasks, the R2 reached 0.93, 0.88, and 0.88, while RMSE values were 9.44, 3.54, and 7.40, respectively. To complement the regression accuracy, a range-based correctness evaluation was introduced by defining acceptable value intervals: PL ± 10 nm (within 2% error), FWHM ± 2 nm (within 6% error), and PLQY ± 4% (within 5% error). Within these ranges, the prediction accuracies were 93%, 76%, and 88%, respectively. While PL showed excellent consistency and predictive stability, the performance for FWHM and PLQY remained less satisfactory, reflecting greater variability or noise in the data.
Although molecular descriptors (MDs) can partially reflect the molecular structure, their capacity to capture complex structure-property relationships remains limited. To enhance the structural sensitivity of the BNML(Ⅰ) model, two types of structural fingerprint features were further introduced: MACCS fingerprints and FP2 fingerprints. MACCS fingerprints encode the presence or absence of 167 predefined functional groups using binary vectors with one null value [49], while FP2 fingerprints generate 1024-bit vectors by mapping path-based substructures [50], offering higher resolution of local chemical environments (Fig. 5a). All fingerprint features were subjected to consistency checks to ensure input data quality.
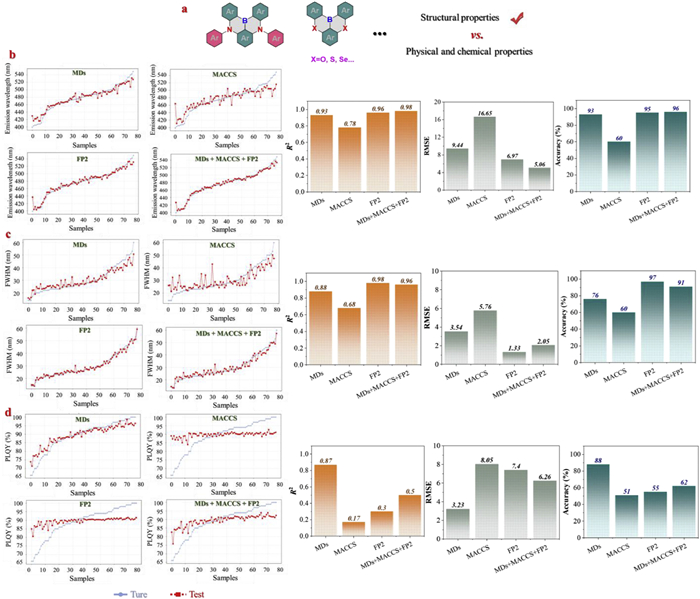
Using MACCS and FP2 fingerprints as features separately, the BNML(Ⅰ) models were trained to predict PL, FWHM, and PLQY. The results indicate that MACCS features yielded relatively poor performance across all tasks, with R2 of 0.78, 0.68, and 0.17, RMSE values of 16.65, 5.76, and 8.05, and prediction accuracies of 60%, 60%, and 51%, respectively. The possible cause of low prediction accuracy (<60%) is that MACCS fingerprints contain only 166 fixed structural fragments, which imposes limitations on the structural interpretation of recently developed MR-TADF molecules with specific conjugated cores. In contrast, FP2 fingerprints with more comprehensive structural analysis significantly improved model performance for PL (Fig. 5b) (R2 = 0.96) and FWHM (Fig. 5c) (R2 = 0.98), with corresponding accuracies of 95% and 97%. However, PLQY (Fig. 5d) prediction remained suboptimal (R2 = 0.30, accuracy = 55%), indicating underfitting. The introduction of two fingerprint features led to a marginal improvement in the predictive performance of the BNML model. However, the results still fell short of expectations (high accuracy, >95%), highlighting the inherent limitations of relying on a single feature for predictive modeling.
Given the complementary nature of different feature types, we further constructed a unified input space by combining MDs, MACCS fingerprints, and FP2 fingerprints. The integrated feature set improved prediction performance for PL (Fig. 5b) and FWHM (Fig. 5c), achieving the R2 of 0.98 and 0.96 and accuracies of 96% and 91%, respectively. However, for PLQY (Fig. 5d), the R2 only increased to 0.50, with RMSE decreasing to 6.26, while accuracy reached 62%, still significantly lower than those for PL and FWHM. These results suggest that while combining features enhances the ability of model to capture multi-level structural information, it may also introduce redundant variables or noise, leading to limited improvements in certain tasks. In addition, the relatively low performance for PLQY may be partly attributed to the heterogeneity of the dataset, where some samples were measured in solid-state films and others in solution, introducing variation in labeling conditions and increasing model uncertainty. This is attributed to the ubiquitous large π-conjugated structure of MR-TADF materials, which may induce fluorescence quenching in thin films. Conversely, introducing single-bonded bulky steric groups during MR structure construction can suppress non-radiative transitions in the thin-film state, thereby enhancing quantum efficiency. Overall, the BNML(Ⅰ) model demonstrates strong robustness and adaptability in feature-rich structural spaces but still requires refinement for properties with high label variability such as PLQY.
Although the BNML(Ⅰ) model demonstrated strong regression capability, performance discrepancies were still observed among tasks, particularly for PLQY prediction (poor accuracy, ~62%). To improve the practical utility of the model in materials screening scenarios, we implemented a range-based prediction strategy by mapping the initial regression outputs into binary evaluations, reflecting realistic decision-making conditions (e.g., acceptable vs. unacceptable) to construct BNML(Ⅱ) model. It should be noted that the original ensemble model framework remained unchanged. In view of the analysis of the dataset mentioned above, and the current emphasis on green MR-TADF materials, three threshold-based criteria were defined to represent practical performance targets: PL ≥ 500 nm (approaching the green emission window), FWHM ≤ 25 nm (indicative of high color purity), and PLQY ≥ 90% (representing high efficiency) (Fig. 6a). Based on these criteria, the original continuous labels were converted to binary values (0/1), and the BNML(Ⅱ) model was adapted to output probability scores, with a classification threshold set at 0.5. This transforms the model's prediction from original exact value estimation to binary "yes/no" output via threshold-based judgment.
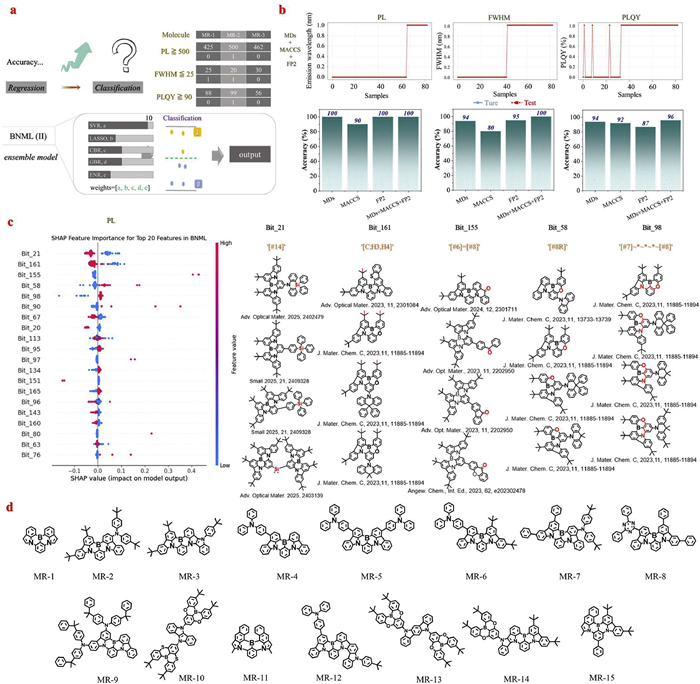
The results show that under this range-based evaluation framework, the prediction accuracies for PL, FWHM, and PLQY reached 100%, 100%, and 96%, respectively, each higher than the corresponding regression-based accuracies (Fig. 6b). This confirms the effectiveness of the approach, especially under small-data and high-precision constraints. It is worth noting that label distributions for PL and FWHM were more concentrated, leading to improved training outcomes. Although PLQY prediction exhibited slightly lower accuracy (96%), it remains within an acceptable range, likely affected by data heterogeneity. It should be supplemented that the application of IQR-based (interquartile range) outlier treatment in the initial sample processing of the BNML model precludes direct tracing of the original number of mispredicted samples, thereby hindering straightforward analysis of the intrinsic characteristics of erroneous predictions.
To further elucidate the structural driving factors behind model performance, MACCS fingerprints, featuring well-defined substructure meanings, were selected as interpretable features. The SHAP (SHapley Additive exPlanations) method was applied to quantify the contribution of each structural fragment to model output across the three prediction tasks. As shown in Fig. 6c, Figs. S16–S18, and Table S2 in Supporting information, the SHAP importance distributions for PL, FWHM, and PLQY were calculated, and the top five contributing fragments for each property were identified. In Fig. S16b (Supporting information), the PL-related analysis reveals that functional groups containing electron-donating atoms such as oxygen and silicon contribute strongly to a red-shift in emission wavelength. These groups tend to raise the molecular orbital energy levels, resulting in lower singlet excited state (S1) energies and thus longer emission wavelengths. The prediction of FWHM relies heavily on saturated ring structures and rigid linear conjugated segments, which help restrict excited-state relaxation and narrow the emission bandwidth, thereby improving color purity (Fig. S17b in Supporting information). PLQY is mainly influenced by large conjugated systems and electron-donating groups, which enhance π-orbital overlap and radiative transition probability, thereby improving luminescence efficiency (Fig. S18b in Supporting information).
SHAP analysis combined with experimental validation indicates that achieving long-wavelength, narrowband, and high-efficiency MR-TADF emission requires a rigid π-conjugated backbone to suppress structural relaxation, carefully positioned donor fragments (e.g., N, O, Si) to enhance radiative transitions, and a balanced conjugation length that red-shifts emission without excessive broadening. In addition, introducing sterically bulky substituents at key positions can effectively suppress non-radiative decay and aggregation-induced quenching. Overall, SHAP-based interpretation not only validates the interpretability of the BNML(Ⅱ) model but also offers guidance for future molecular optimization through structure-driven design.
To verify the practical applicability and reliability of the BNML(Ⅱ) model in molecular design, we designed fifteen new MR-TADF compounds based on structural fragments with high SHAP values (Fig. 6d). These candidates were not included in the training set. Their combined structural features (MDs, MACCS, and FP2) were processed and input into the BNML(Ⅱ) model to predict three key properties: PL, FWHM, and PLQY (Table S3 in Supporting information). The first seven molecules were selected for experimental synthesis (Figs. S20–S34 in Supporting information) and photophysical testing (Fig. S19 in Supporting information). Among them, the compound MR-1 had previously been regarded as synthetically inaccessible due to excessive reactivity at the β-position of its indole framework during the electrophilic borylation step, which hindered regioselective boron insertion [51]. In this work, MR-1 was successfully synthesized for the first time, and its structure was confirmed by high-quality single-crystal analysis (Fig. S35 and Table S4 in Supporting information).
All seven compounds were measured in deoxygenated toluene solutions under conditions consistent with those used for most training data, ensuring comparability between experimental results and model predictions. As shown in Fig. S19 (Supporting information), and Tables 1 and 2, the BNML(Ⅱ) model achieved 100% prediction accuracy for both FWHM and PLQY, while PL predictions were accurate for 6 out of 7 compounds, with only one case showing minor deviation. The primary reason for the predictive deviation of the fluorescence emission peak in MR-3 might be the introduction of 5,10-dihydro-indolo[3,2-b]indole as a donor unit. With only a single-digit number of samples (in 415 samples) featuring this structure, the learning capacity of the BNML model for this specific motif was impeded. These results demonstrate that the BNML model not only performs well within the training set but also exhibits strong generalization ability and structural tolerance when applied to novel molecular structures. This offers a practical pathway for efficient screening and optimization of high-performance MR-TADF emitters.
 DownLoad:
CSV
DownLoad:
CSV
| Empty Cell | PL (nm) a | FWHM (nm) a | PLQY (%) b |
| MR-1 | 465 | 25 | 70 |
| MR-2 | 489 | 20 | 92 |
| MR-3 | 519 | 38 | 90 |
| MR-4 | 483 | 25 | 94 |
| MR-5 | 488 | 25 | 95 |
| MR-6 | 490 | 25 | 99 |
| MR-7 | 495 | 22 | 93 |
| a Tested at room temperature in toluene, c = 1 × 10⁻⁵ mol/L. b Tested at room temperature in degassed toluene, c = 1 × 10⁻⁵ mol/L. | |||
DownLoad:
CSV
| Empty Cell | PL (≧ 500 nm) | FWHM (≦ 25 nm) | PLQY (≧ 90%) | |||||
| prediction | true | prediction | true | prediction | true | |||
| MR-1 | 0 | 0 | 1 | 1 | 0 | 0 | ||
| MR-2 | 0 | 0 | 1 | 1 | 1 | 1 | ||
| MR-3 | 0 | 1 | 0 | 0 | 1 | 1 | ||
| MR-4 | 0 | 0 | 1 | 1 | 1 | 1 | ||
| MR-5 | 0 | 0 | 1 | 1 | 1 | 1 | ||
| MR-6 | 0 | 0 | 1 | 1 | 1 | 1 | ||
| MR-7 | 0 | 0 | 1 | 1 | 1 | 1 | ||
A structure-aware ensemble learning model (BNML) was constructed to address the challenges of structural complexity, property coupling, and time-consuming experimental validation in MR-TADF materials. Based on a dataset of 415 reported compounds, the model integrates multiple structural features, including molecular descriptors (MDs), MACCS, and FP2 fingerprints, enabling simultaneous prediction of photoluminescence wavelength (PL), full width at half-maximum (FWHM), and photoluminescence quantum yield (PLQY). Comparative analysis showed that FP2 outperformed other individual feature sets, and the feature combination further improved model performance, yielding R2 values of 0.98, 0.96, and 0.50 and RMSE values of 5.06, 2.05, and 6.26 for PL, FWHM, and PLQY, respectively. Prediction accuracies within predefined thresholds reached 96%, 91%, and 62%. To enhance screening applicability, a range-based prediction strategy was introduced, converting regression outputs into binary evaluations, which improved predictive accuracies to 100%, 100%, and 96% for the respective properties. SHAP analysis revealed the dominant influence of conjugated fragments and electron-donating groups, offering interpretability into structure-property relationships. Guided by these insights, fifteen new compounds were designed and evaluated, seven of which were successfully synthesized and tested. The model achieved a 100% accurate prediction of FWHM and PLQY. The model correctly predicted PL in six out of seven cases. This deviation may result from the limited number of samples of the new structure. These results confirm the generalization ability and structural tolerance of the BNML model, providing a practical tool for the intelligent design and rapid evaluation of high-performance MR-TADF emitters. At the same time, since the BNML model is structure-oriented and built on generalizable descriptors and fingerprints, it is not intrinsically limited to DABNA-type frameworks. With sufficient training data and by employing transfer learning strategies, the framework can be extended to other molecular scaffolds, and we believe it will also contribute to molecular design in broader areas beyond MR-TADF.
The authors declare that they have no known competing financial interests or personal relationships that could have appeared to influence the work reported in this paper.
Zhiyuan Chen: Writing – original draft, Methodology, Data curation. Jinyu Song: Investigation. Lai Hu: Data curation. Peng Xu: Data curation. Zhengyi Sun: Conceptualization. Xiao-Chun Hang: Conceptualization. Hongjun Zhu: Supervision, Funding acquisition. Senqiang Zhu: Supervision, Funding acquisition. Rui Liu: Writing – review & editing, Supervision, Conceptualization.
The authors greatly acknowledge the Natural Science Foundation of Jiangsu Province (No. BK20220351), and the Natural Science Foundation of the Jiangsu Higher Education Institutions of China (No. 22KJB150027) for financial support.
Supplementary material associated with this article can be found, in the online version, at doi:
T. Hatakeyama, K. Shiren, K. Nakajima, et al., Adv. Mater. 28 (2016) 2777–2781. doi: 10.1002/adma.201505491
X. Gong, W. Yang, H. Zhang, et al., Sci. China Mater. 67 (2024) 3537–3542. doi: 10.1007/s40843-024-3047-4
J. Liu, X. Yin, M. Huang, et al., Adv. Mater. 37 (2025) 2411610. doi: 10.1002/adma.202411610
H. Chen, M. Du, C. Qu, et al., Angew. Chem. Int. Ed. 64 (2025) e202415400. doi: 10.1002/anie.202415400
H. Shi, Y. Shi, Z. Liang, et al., Chem. Eng. J. 494 (2024) 153150. doi: 10.1016/j.cej.2024.153150
Z. Wu, Y. Xin, C. Lu, et al., Angew. Chem. Int. Ed. 63 (2024) e202318742. doi: 10.1002/anie.202318742
W. Zhang, H. Zhuang, S. Chen, et al., Chem. Eng. J. 498 (2024) 155350. doi: 10.1016/j.cej.2024.155350
P. Palanisamy, O.P. Kumar, H.U. Kim, et al., Chem. Eng. J. 481 (2024) 148781. doi: 10.1016/j.cej.2024.148781
X. Zeng, X. Luo, G. Meng, et al., Angew. Chem. Int. Ed. 64 (2025) e202423670. doi: 10.1002/anie.202423670
W. Yuan, Q. Jin, M. Du, L. Duan, Y. Zhang, Adv. Mater. 36 (2024) 2410096. doi: 10.1002/adma.202410096
M. Mamada, M. Hayakawa, J. Ochi, T. Hatakeyama, Chem. Soc. Rev. 53 (2024) 1624–1692. doi: 10.1039/d3cs00837a
L. Wan, Z. Cheng, F. Liu, P. Lu, Mater. Chem. Front. 7 (2023) 4420–4444. doi: 10.1039/d3qm00498h
Q. He, M. Li, S. Su, ChemPhysChem 26 (2025) e202400955. doi: 10.1002/cphc.202400955
R.K. Konidena, K.R. Naveen, Adv. Photonics Res. 3 (2022) 2200201. doi: 10.1002/adpr.202200201
S. M. Suresh, D. Hall, D. Beljonne, Y. Olivier, Adv. Funct. Mater. 30 (2020) 1908677. doi: 10.1002/adfm.201908677
H.J. Kim, T. Yasuda, Adv. Opt. Mater. 10 (2022) 2201714. doi: 10.1002/adom.202201714
Y. Li, X. Tan, B. Cai, C. Chan, Adv. Opt. Mater. 13 (2025) 2403556. doi: 10.1002/adom.202403556
T.Y. Zhang, X.C. Fan, K. Wang, X.H. Zhang, Chem. Commun. 60 (2024) 14168–14179. doi: 10.1039/d4cc05040a
J. Li, N. Wu, J. Zhang, et al., Nano-Micro Lett. 15 (2023) 227. doi: 10.1007/s40820-023-01192-5
K.T. Butler, D.W. Davies, H. Cartwright, O. Isayev, A. Walsh, Nature 559 (2018) 547–555. doi: 10.1038/s41586-018-0337-2
F. Strieth-Kalthoff, F. Sandfort, M. Kühnemund, et al., Angew. Chem. Int. Ed. 61 (2022) e202204647. doi: 10.1002/anie.202204647
T. Zhang, Q. Ye, Y. Liu, et al., Nat. Commun. 16 (2025) 3644. doi: 10.1038/s41467-025-59053-1
M. Suvarna, J. Pérez-Ramírez, Nat. Catal. 7 (2024) 624–635. doi: 10.1038/s41929-024-01150-3
Z. Zhao, Y. Han, Q. Zhang, et al., ACS Appl. Nano Mater. 8 (2025) 579–588. doi: 10.1021/acsanm.4c05950
L. Zhang, N. Li, D. Liu, et al., Angew. Chem. Int. Ed. 61 (2022) e202209337. doi: 10.1002/anie.202209337
F. Lu, Y. Liang, N. Wang, et al., Adv. Photon. 6 (2024) 054001.
Q. Tao, P. Xu, M. Li, W. Lu, Npj Comput. Mater. 7 (2021) 23. doi: 10.1038/s41524-021-00495-8
X.Y. Ma, J.P. Lewis, Q.B. Yan, G. Su, J. Phys. Chem. Lett. 10 (2019) 6734–6740. doi: 10.1021/acs.jpclett.9b02420
M. Wu, E. Tikhonov, A. Tudi, et al., Adv. Mater. 35 (2023) 2300848. doi: 10.1002/adma.202300848
K.M. Eltohamy, M.G. Alashram, A.I. ElManawy, et al., Biochar 7 (2025) 57. doi: 10.1007/s42773-025-00442-6
G.M. Landwehr, J.W. Bogart, C. Magalhaes, et al., Nat. Commun. 16 (2025) 865. doi: 10.1038/s41467-024-55399-0
A. López Cortés, A. Cabrera Andrade, G.E. Garcés, et al., Sci. Rep. 14 (2024) 19359. doi: 10.1038/s41598-024-68565-7
R. N, A. Mondal, J. Chem. Phys. 162 (2025) 144103. doi: 10.1063/5.0263384
H. Shi, Y. Li, S. Zhao, et al., J. Phys. Chem. C 127 (2023) 23526–23535. doi: 10.1021/acs.jpcc.3c07392
H. Shi, Y. Shi, Z. Liang, et al., Chem. Eng. J. 494 (2024) 153150. doi: 10.1016/j.cej.2024.153150
H.S. Kim, H.J. Cheon, S.H. Lee, et al., Sci. Adv. 11 (2025) eadr1326. doi: 10.1126/sciadv.adr1326
S. Wang, S. Liu, X. Che, et al., Spectrochim. Acta A 224 (2020) 117404. doi: 10.1016/j.saa.2019.117404
T. Zhang, W. He, H. Zheng, et al., Chemosphere 268 (2021) 128801. doi: 10.1016/j.chemosphere.2020.128801
Y. Zhang, S. Xing, L. Wei, et al., ACS Omega 9 (2024) 14368–14374. doi: 10.1021/acsomega.3c10469
S. Wang, W. Bi, W. Gan, et al., Spectrochim. Acta A 268 (2022) 120711. doi: 10.1016/j.saa.2021.120711
X. Lv, D. Gu, X. Liu, Y. Li, Sci. Rep. 14 (2024) 18834. doi: 10.1038/s41598-024-69876-5
Q. Zhang, H. Liang, Y. Tao, J. Yang, et al., Small Methods 6 (2022) 2200208. doi: 10.1002/smtd.202200208
H. Wang, C.M. Lee, R. Feng, C.S. Leung, Neural Comput. Appl. 29 (2018) 389–400. doi: 10.1007/s00521-017-2863-5
H. Zou, T. Hastie, J. R. Stat. Soc. Ser. B 67 (2005) 301–320. doi: 10.1111/j.1467-9868.2005.00503.x
D. Weininger, J. Chem. Inf. Comput. Sci. 28 (1988) 31–36. doi: 10.1021/ci00057a005
F. Kruger, N. Stiefl, G.A. Landrum, J. Chem. Inf. Model. 60 (2020) 3331–3335. doi: 10.1021/acs.jcim.0c00296
A. Treistman, D. Mughaz, A. Stulman, et al., Expert Syst. Appl. 208 (2022) 118157. doi: 10.1016/j.eswa.2022.118157
R. Huang, M.F. Hanif, M.K. Siddiqui, et al., Sci. Rep. 14 (2024) 26552. doi: 10.1038/s41598-024-77838-0
J.L. Durant, B.A. Leland, D.R. Henry, J.G. Nourse, J. Chem. Inf. Comput. Sci. 42 (2002) 1273–1280. doi: 10.1021/ci010132r
B. Ji, X. He, Y. Zhang, et al., J. Chem. Inform. 13 (2021) 11.
C.Z. Du, Y. Lv, H. Dai, et al., J. Mater. Chem. C 11 (2023) 2469–2474. doi: 10.1039/d2tc04952j

Figure 1 Schematic diagram of the BNML model structure design and machine learning modeling process of MR-TADF compounds.

Figure 2 PL, FWHM, and PLQY distribution of the molecules with different MR building blocks of the reported MR-TADF materials (415).

Figure 3 (a) The generation process and meaning of molecular descriptors. (b) The feature screening process of variance threshold method and pearson coefficient method.

Figure 4 Regression prediction results of the BNML(Ⅰ) model based on molecular descriptors (MDs) features for three photophysical properties (PL, FWHM, and PLQY), including the comparison between predicted and experimental values for test samples, as well as the evaluation metrics (R2, RMSE, and accuracy within the defined error range).

Figure 5 (a) Schematic illustration of the transition from MDs to structural fingerprints, including MACCS and FP2. Regression prediction results of PL (b), FWHM (c) and PLQY (d) performance for BNML(Ⅰ) model based on different features, including the comparison between predicted and experimental values for test samples, and evaluation metrics (R2, RMSE, and accuracy within the defined error range).

Figure 6 (a) Schematic representation of the modeling strategy transition from continuous regression to range-based prediction and the operational mechanism of the BNML(Ⅱ) model under the range-based prediction framework. (b) Range-based prediction results of the BNML(Ⅱ) model based on combined features (MDs, MACCS, FP2, and MDs + MACCS + FP2) for PL, FWHM, and PLQY, including the comparison between predicted and experimental values for test samples, and classification accuracy under a 0.5 threshold. (c) The SHAP importance analysis of the BNML(Ⅱ) model for PL prediction based on MACCS fingerprints, showing the top 20 contributing structural fragments. Structural interpretations and representative molecular examples of the top five most influential MACCS fingerprints. (d) The fifteen new MR-TADF compounds are designed based on SHAP structure contribution analysis.
Table 1. Experimental results of three types of results (PL, FWHM, and PLQY) of seven MR-TADF compounds.
| Empty Cell | PL (nm) a | FWHM (nm) a | PLQY (%) b |
| MR-1 | 465 | 25 | 70 |
| MR-2 | 489 | 20 | 92 |
| MR-3 | 519 | 38 | 90 |
| MR-4 | 483 | 25 | 94 |
| MR-5 | 488 | 25 | 95 |
| MR-6 | 490 | 25 | 99 |
| MR-7 | 495 | 22 | 93 |
| a Tested at room temperature in toluene, c = 1 × 10⁻⁵ mol/L. b Tested at room temperature in degassed toluene, c = 1 × 10⁻⁵ mol/L. | |||
 下载: 导出CSV
Table 2. Comparison of predicted and true values of three types of results (PL, FWHM, and PLQY) for seven MR-TADF compounds.
| Empty Cell | PL (≧ 500 nm) | FWHM (≦ 25 nm) | PLQY (≧ 90%) | |||||
| prediction | true | prediction | true | prediction | true | |||
| MR-1 | 0 | 0 | 1 | 1 | 0 | 0 | ||
| MR-2 | 0 | 0 | 1 | 1 | 1 | 1 | ||
| MR-3 | 0 | 1 | 0 | 0 | 1 | 1 | ||
| MR-4 | 0 | 0 | 1 | 1 | 1 | 1 | ||
| MR-5 | 0 | 0 | 1 | 1 | 1 | 1 | ||
| MR-6 | 0 | 0 | 1 | 1 | 1 | 1 | ||
| MR-7 | 0 | 0 | 1 | 1 | 1 | 1 | ||
下载: 导出CSV

 扫一扫看文章

扫一扫关注我们
 下载:
下载: