Citation:
Shang-Wei Yuan, Li Zeng, Li Wu, Ji-Li Yuan, Chao Kang, Xi Zeng, Pei-Hua Ma, Xin Xiao. A smartphone sensing platform based on cucurbit[8]uril for rapid visual quantitative detection of S2O82-[J]. Chinese Chemical Letters,
2026, 37(7): 111962.
doi:
10.1016/j.cclet.2025.111962
A smartphone sensing platform based on cucurbit[8]uril for rapid visual quantitative detection of S2O82-
English
A smartphone sensing platform based on cucurbit[8]uril for rapid visual quantitative detection of S2O82-
Guizhou Key Laboratory of Macrocyclic and Supramolecular Chemistry, School of Chemistry and Chemical Engineering, Guizhou University, Guiyang 550025, China
b.
Department of Polymer Materials and Engineering, College of Materials & Metallurgy, Guizhou University, Guiyang 550025, China
* Corresponding author. E-mail address: xxiao@gzu.edu.cn (X. Xiao). 1 These authors contributed equally to this work.
Received Date:
15 May 2025 Accepted Date:
13 October 2025 Revised Date:
30 September 2025 Available Online:
15 July 2026
Abstract:
In this paper, a novel multicolor-responsive fluorescent probe for the rapid and sensitive detection of persulfate ions (S2O82-), KT@Q[8], is constructed via host-guest interactions between cucurbit[8]uril (Q[8]) and 3,6-bis[4-(4-bromophenyl)pyridinium]-carbazole dichloride (KT). Upon interaction with S2O82-, the KT@Q[8] probe exhibits a fluorescence emission blue shift concurrent with a fluorescence color transition gradually from yellow to green. Notably, the probe demonstrates high selectivity for S2O82- even in the presence of competing anions and sulphur-containing metal salts, achieving a detection limit of 0.38 μmol/L. When integrated with smartphone-based RGB analysis, this probe enables rapid visual quantification of S2O82- without requiring sophisticated instrumentation, and can be effectively used to detect S2O82- in tap water, lake water, honey, and white wine. Furthermore, machine learning algorithms enhanced predictive accuracy during data analysis. Overall, this work not only advances a practical approach for persulfate monitoring but also expands the application range of cucurbituril-based fluorescence supramolecular assemblies.
Persulfate (S2O82-), a strong oxidizer, plays a crucial role in advanced oxidation processes (AOPs) for removing organic pollutants [1-3], soil contaminants [4,5], wastewater treatment, and in-situ groundwater remediation [6-10]. Additionally, it has potential applications in the food industry. For instance, Zhu et al. [11] utilized a flavin mononucleotide/sodium persulfate system to photocrosslink casein, resulting in photocurable hydrogel materials that generate hydrogen peroxide through flavin mononucleotide and tryptophan as photosensitizers. These hydrogels are used to inactivate pathogenic microorganisms in food. Meanwhile, Lee et al. [12] investigated the antibacterial effects of ammonium persulfate against Staphylococcus aureus under different growth conditions. Notably, residual persulfate in tap water, lake water, or food poses a potential health risk. Studies have shown correlations between persulfate and occupational asthma/dermatitis [13,14]. Therefore, developing highly sensitive and selective detection methods for persulfate holds significant importance and has attracted increasing research attention.
Currently, various analytical techniques have been employed for determining sulfur compounds in aqueous, food, and environmental matrices, including high-performance liquid chromatography (HPLC) [15], chemiluminescence [16], electrochemical methods [17], visible spectrophotometry [18], and colorimetric sensor arrays [19]. Although these conventional approaches exhibit satisfactory sensitivity and accuracy, they still suffer from notable limitations in practical applications. Typical constraints include reliance on sophisticated laboratory instrumentation that requires professional operation, elevated detection costs, complex sample pretreatment procedures, time-consuming signal processing, and difficulties in achieving real-time on-site analysis. These inherent drawbacks significantly restrict their applicability for large-scale sample monitoring and real-time analysis. Furthermore, the coexistence of multiple sulfur-containing compounds in real samples frequently induces mutual interference, making specific recognition of S2O82- particularly challenging under complex matrices. Therefore, there is an urgent need to create straightforward, rapid, efficient, and user-friendly methodologies that will allow on-site analysis of S2O82- in aqueous and food samples, preferably with the capacity for visual semi-quantitative detection.
Fluorescent sensing platforms have gained widespread utilization in sulfate detection for environmental and food safety monitoring, owing to their operational simplicity, superior sensitivity, rapid response kinetics, exceptional selectivity, and real-time analytical capabilities [20-25]. The continuous advancement of innovative fluorescent materials has driven the development of more portable and high-performance sensors, making this area a key focus in modern analytical chemistry research. Particularly promising is the strategic design of fluorescent probes leveraging host-guest chemistry, where macrocyclic compounds demonstrate remarkable molecular recognition through selective encapsulation [26-29]. Among these supramolecular hosts, cucurbiturils (Q[n]s, n = 5–8, 10, 13–15) have emerged as particularly noteworthy candidates due to their unique structural features: Hydrophobic nanocavities with tunable dimensions, moderate binding constants, and exceptional affinity for neutral or cationic organic guests [30-32]. When molecules containing fluorescent groups enter the non-polar environment of the Q[n]s cavity, significant changes in the physicochemical properties of the guests occur, enabling effective recognition and detection of target substances [33-39]. In recent years, supramolecular fluorescent probes constructed from Q[n]s have garnered considerable interest for their applications in detecting various substances [40-46]. Particularly noteworthy is the emergence of smartphone-assisted supramolecular fluorescent sensors, which serve as excellent portable detection tools, providing new solutions for on-site substance detection and analysis [47-50].
Building on previous research, we designed and synthesized a novel guest molecule, dichloro-3,6-di[4-(4-bromophenyl)pyridinyl]carbazole (KT). The 1:1 host-guest assembly (KT@Q[8]) formed between KT and cucurbit[8]uril (Q[8]) demonstrates progressive fluorescence intensity enhancement at 590 nm. Utilizing the host-guest interactions between Q[8] and KT, a supramolecular fluorescent probe for the detection of S2O82- in aqueous solutions has been successfully developed. Remarkably, this probe identifies and detects S2O82- even in the presence of various anions and sulfur-containing metal salts. By employing RGB analysis technology through a smartphone, the probe allows for intuitive and quantitative detection of S2O82- without requiring sophisticated instruments. This method has been successfully implemented for S2O82- detection in real samples, including tap water, lake water, honey, and white wine. This study not only expands the practical application of supramolecular fluorescent probes in the realm of food and environmental safety but also injects new vitality into visual quantitative detection research.
The fluorescent guest molecule carbazole derivative (KT) was synthesized through a two-step synthetic procedure (Scheme S1 in Supporting information). Subsequently, host-guest assembly with Q[8] enabled the construction of a KT@Q[8] supramolecular fluorescent probe. Comprehensive characterization data of the relevant compounds are detailed in Figs. S1-S4 (Supporting information). The host-guest interaction between Q[8] and KT was studied by UV–visible spectroscopy, fluorescence spectroscopy, and other analytical techniques. Finally, we explored the potential applicability of the KT@Q[8] supramolecular fluorescent probe in practical implementations.
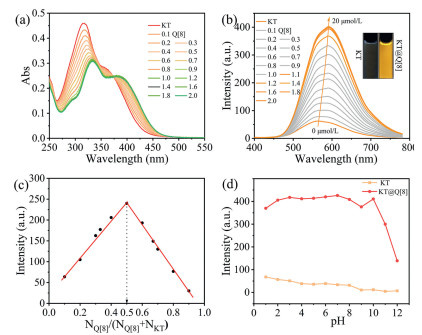
Firstly, the binding characteristics of Q[8] with KT in aqueous solution were investigated using UV–vis and fluorescence spectroscopy. As depicted in Fig. 1a, the characteristic absorption peak of KT at 317 nm and a minor peak at 358 nm were observed. Upon gradual addition of Q[8], the absorbance at 317 nm decreased in intensity and underwent a red shift to 332 nm. Concurrently, the peak at 358 nm diminished, while a new absorption band emerged at 389 nm. An isosbestic point at 375 nm was observed, indicating complex formation between KT and Q[8]. The UV absorbance stabilized when the molar ratio of Q[8] to KT reached 1:1 (Fig. S5 in Supporting information), suggesting the formation of a stable inclusion complex with 1:1 stoichiometry. Subsequently, the variation in fluorescence intensity of KT under varying Q[8] concentrations was examined using the molar ratio method. Fluorescence spectra were acquired at an excitation wavelength of 334 nm. As shown in Fig. 1b and Fig. S6 (Supporting information), the fluorescence intensity at 590 nm gradually increased upon Q[8] addition to a 10 μmol/L KT solution. The intensity plateaued once the KT@Q[8] ratio reached 1:1, providing further evidence for 1:1 complexation. This conclusion was corroborated by Job's plot analysis, which showed a maximum fluorescence signal at a molar fraction of 0.5 (Fig. 1c), consistent with the UV–vis spectral data. Additionally, the fluorescence quantum yield of the assembly increased from 0.41% to 3.63% (Fig. S7 in Supporting information), further confirming host-guest interactions between KT and Q[8].
Figure 1
Figure 1.
(a) Absorption titration spectra of guest KT (10 μmol/L) with Q[8] (0–20 μmol/L). (b) Fluorescence titration spectra of guest KT (10 μmol/L) with Q[8] (0–20 μmol/L). (c) Job's plot of fluorescence intensity versus Q[8] concentration (λex/λem = 334 nm/590 nm). (d) pH-dependent fluorescence of KT and the KT@Q[8] supramolecular assembly (λex/λem = 334 nm/590 nm). Inset: Fluorescence images of KT and KT in the presence of Q[8] host.
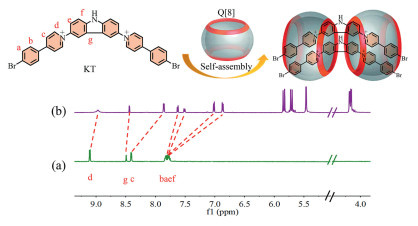
The details of the interaction mechanism between KT and Q[8] were further explored using 1H NMR experiments. As shown in Fig. 2, with the increase of the concentration of Q[8] in the KT solution, the protons Ha, Hb, Hc, and Hd on 4-(4-bromophenyl)pyridine shifted significantly to the high-field region due to the shielding effect of the hydrophobic cavity of Q[8], and the protons He, Hf, and Hg on the benzene ring of 3,6-diamino-carbazole also slightly shifted to the up-field region. The results of the 1H NMR spectra indicate that the 4-(4-bromophenyl)pyridine part of KT and the benzene ring part of 3,6-diamino-carbazole both entered the cavity of Q[8]. Based on the results mentioned above, it is hypothesized that KT and Q[8] self-assemble to form a supramolecular assembly KT@Q[8] (inset in Fig. 2).
Figure 2
Figure 2.
Possible interactions in KT@Q[8] and 1H NMR spectrum of KT (a) and KT@Q[8] (b). Inset: A schematic diagram of the interaction between KT and Q[8].
To accurately characterize the structural pattern of KT@Q[8], we used dynamic light scattering (DLS) experiments to investigate the particle size distribution of assemblies formed through host-guest interactions in aqueous solution (Fig. S8 in Supporting information). The results revealed that the pure guest molecule KT exhibited an average particle size of 5.78 nm, while the average size of KT@Q[8] significantly increased to 31.53 nm. This substantial size variation clearly demonstrates the remarkable structural reorganization occurring during the formation process of KT@Q[8]. Furthermore, scanning electron microscopy (SEM) was employed to further analyze the morphological changes in assemblies induced by the host-guest interactions between Q[8] and KT. SEM results demonstrated that KT exhibits different morphologies before and after adding Q[8] (Fig. S9 in Supporting information). These observations further confirmed the existence of host-guest interactions between KT and Q[8].
To ensure scientific rigor in experimental design, the optimal pH of the probe was studied. As shown in Fig. 1d, the fluorescence intensity of KT remains stable within the pH range of 1–12. However, for the KT@Q[8] host-guest complex probe, the fluorescence intensity remains relatively stable at 1 < pH < 10 but undergoes sharp quenching when pH > 10. Therefore, we selected a Tris–HCl buffer solution to control the system pH at 6.0 for subsequent studies.
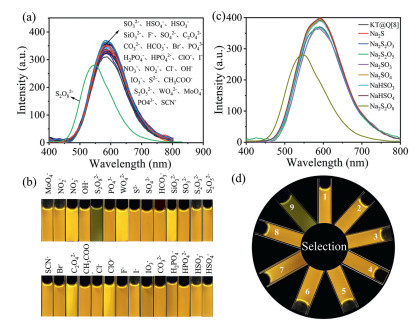
Using the outstanding optical properties of KT@Q[8], the specific recognition of S2O82- by KT@Q[8] in aqueous solution was studied through fluorescence experiments. As shown in Fig. 3a, in the KT@Q[8] (Tris–HCl, pH 6.0) aqueous solution, 26 anions with a concentration of 100 μmol/L, including SO32-, HSO4-, HSO3-, SiO3-, SO42-, C2O42-, CO32-, HCO3-, PO43-, H2PO4-, HPO42-, ClO-, NO3-, NO2-, Cl-, OH-, CH3COO-, S2-, F-, Br-, I-, IO3-, VO4-, WO42-, S2O82-, MoO4-, were added under the same experimental conditions, and the fluorescence spectrum changes were monitored. Markedly, after adding S2O82- to KT@Q[8], the fluorescence intensity at 590 nm underwent a blue shift, the fluorescence color shifted from orange to green, with no significant changes observed for the other anions (Fig. 3b). Additionally, KT@Q[8] demonstrated strong resistance to interference from other anions (Fig. S11 in Supporting information).
Figure 3
Figure 3.
(a) Fluorescence spectra of KT@Q[8] (10 μmol/L, pH 6.0) upon addition of 10 equiv. of various anions. (b) Fluorescence images of various anions under 365 nm UV light irradiation, λex/λem = 334 nm/590 nm. (c) Fluorescence spectra of KT@Q[8] (10 μmol/L, pH 6.0) upon addition of 10 equiv. of sulfur-containing metal sodium salts. (d) Fluorescence images of KT@Q[8] host-guest complexes with 10 equiv. of sulfur-containing metal sodium salts under UV lamp irradiation; λex/λem = 334 nm/590 nm. 1: KT@Q[8]; 2: Na2S; 3: Na2S2O3; 4: NaHSO3; 5: NaHSO4; 6: Na2SO4; 7: Na2SO3; 8: Na2S2O5; 9: Na2S2O8.
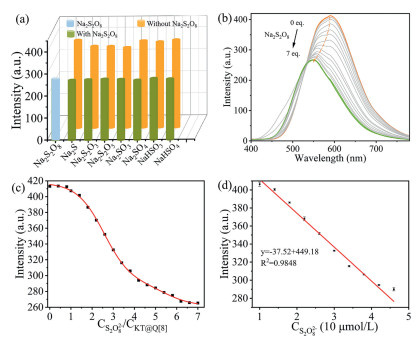
Given the demonstrated recognition capability of the KT@Q[8] probe toward S2O82-, fluorescence spectroscopic analysis was conducted with a series of sulfur-containing sodium metal salts to investigate its potential for identifying other such compounds. As shown in Fig. 3c, systematic fluorescence measurements were conducted by introducing eight distinct sulfur-containing sodium salts (Na2S, Na2S2O3, Na2S2O5, Na2SO3, Na2SO4, NaHSO3, NaHSO4, and Na2S2O8) into aqueous KT@Q[8] solutions under identical experimental conditions. Strikingly, only the addition of Na2S2O8 induced a pronounced blue shift (Δλ = 23 nm) in the emission spectrum, accompanied by a distinct chromatic transition from orange to green at 590 nm (Fig. 3d). Importantly, even in the presence of competing sulfur-containing salts, the assembly maintained exceptional selectivity for S2O82-, as evidenced by its robust anti-interference performance (Fig. 4a). These observations collectively confirm that the KT@Q[8] supramolecular exhibits high specificity for S2O82- recognition in aqueous solution.
Figure 4
Figure 4.
(a) Anti-interference experiment of KT@Q[8] polymer (1:1, 10 μmol/L, pH 6.0, λem = 590 nm) for S2O82- recognition. (b, c) Fluorescence spectra and the fluorescence intensity versus S2O82-/KT@Q[8] curve (λ = 590 nm) with gradual addition of S2O82- into KT@Q[8] polymer (10 μmol/L, 1:1). (d) Detection limit fitting curve of fluorescence intensity versus S2O82- concentration.
To further characterize the sensing performance of KT@Q[8] toward S2O82-, a fluorescence titration experiment was performed. As shown in Figs. 4b and c, with the increase in S2O82- concentration, the original emission band at 590 nm exhibited progressive quenching, while a new fluorescence peak emerged at 525 nm with intensity enhancement. Notably, a fluorescence ratio absorption peak formed at 540 nm, and the decrease in fluorescence intensity started to level off when the concentration of S2O82- reached a certain value. Within a certain concentration range, the fluorescence intensity of the probe exhibited a good linear relationship with the S2O82- concentration. The detection limit, calculated using the 3σ/A method, was determined to be 0.38 μmol/L (Fig. 4d). Meanwhile, compared to most reported optical S2O82- sensors, KT@Q[8] demonstrates superior detection performance (Table S1 in Supporting information).
Given that KT exists as a cationic protonated species while S2O82- carries opposing charges, it is speculated that the addition of S2O82- might induce a blue shift in the fluorescence intensity of KT@Q[8] at 590 nm. To investigate the response mechanism of the KT@Q[8] fluorescent probe, we conducted zeta potential experiments to validate this hypothesis (Figs. S12-S14 in Supporting information). The experimental results revealed that the zeta potential of KT@Q[8] was 2.46 mV, which decreased to 1.59 mV after the addition of 2 equiv. of S2O82-. Furthermore, the scanning electron microscopy (SEM) images of KT@Q[8] with added S2O82- exhibited significantly different morphologies compared to KT@Q[8] without S2O82- (Fig. S10 in Supporting information). These findings further suggest that S2O82- may form a new supramolecular assembly with KT@Q[8]. The addition of S2O82- neutralizes the charge of KT@Q[8], leading to a redistribution of charges within the system due to electrostatic interactions, thereby triggering the fluorescence blue shift phenomenon.
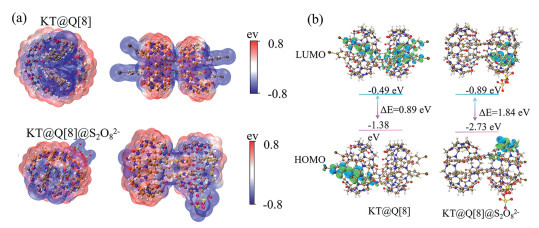
To further explore the response mechanism of KT@Q[8] toward S2O82-, density functional theory (DFT) calculations were performed. Primarily, the host-guest configuration was established and further optimized (Fig. 5). As shown in Fig. 5a, the exo-wall of Q[8] exhibits a positive charge. This characteristic indicates that after introducing S2O82- into the assembly system, this anion is more likely to interact with Q[8], which confirms the feasibility of the interaction between Q[8] and S2O82-. It is worth noting that after the addition of S2O82-, it is still present with a negative potential itself, suggesting that this anion has a huge influence on the charge redistribution. Meanwhile, the guest molecule KT features a push-pull electron structure, with the fluorophore containing both an electron donor and an electron acceptor. In the excited state, intramolecular electron transfer (ET) occurs between the donor and acceptor through their conjugated π-bonds. This process promotes charge separation and results in the formation of an intramolecular charge transfer (ICT) state [51,52].
Figure 5
Figure 5.
(a) Electrostatic potential distribution of KT@Q[8], KT@Q[8]@S2O82- optimization model. (b) KT@Q[8] and KT@Q[8]@S2O82- frontier molecular orbitals and orbital energies.
When the KT@Q[8] assembly interacts with the strong oxidant persulfate anion (S2O82-), the electron-donating ability of the donor weakens, reducing intramolecular charge transfer. This decreases electron mobility throughout the system and increases the energy gap between the excited and ground states [53,54]. As a result, the absorption spectrum exhibits a blue shift, and the molar extinction coefficient of the KT@Q[8] assembly decreases. Similarly, the fluorescence emission wavelength shifts to the blue, accompanied by reduced fluorescence intensity. Furthermore, as shown in Fig. 5b, the energy gap between the highest occupied molecular orbital (HOMO) and the lowest unoccupied molecular orbital (LUMO) in the host-guest configuration is calculated to be 0.89 eV. After adding S2O82-, this gap increases to 1.84 eV. This indicates that S2O82- induces photogenerated electron transfer, causing the blue shift in fluorescence and weakening the fluorescence intensity of the assembly.
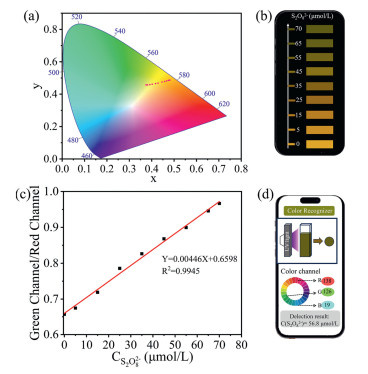
The fluorescence color of KT@Q[8] demonstrates remarkable concentration-dependent chromatic responsiveness to S2O82- under 365 nm UV irradiation. As shown in Figs. 6a and b, the initial orange fluorescence emitted by KT@Q[8] in aqueous solution undergoes shifting toward yellow emission with incremental addition of S2O82- concentration, achieving a distinct green emission at 70 μmol/L S2O82-. This progressive color modulation from orange through yellow to green demonstrates precise spectral tunability by adjusting the ratio of S2O82- to KT@Q[8]. However, while this chromatic transition provides visual detection capability, the limited color resolution of human vision complicates quantitative assessments of analyte concentration dynamics.
Figure 6
Figure 6.
(a) Chromaticity diagram of KT@Q[8] with S2O82- concentrations of 0, 6, 10, 14, 22, 26, 30, 34, 38, 42, 46, and 50 μmol/L. (b) Schematic diagram of S2O82- detection using a smartphone color recognizer (collected under 365 nm UV light). (c) Linear plot of fluorescence sensor solution color changes (green channel/red channel) versus S2O82- concentration. (d) Fluorescence color change for S2O82- concentrations ranging from 0 to 70 μmol/L (collected under 365 nm UV light).
To enable portable and precise detection of S2O82-, this study developed an integrated smartphone-based sensing platform comprising a colorimetric sample cell, a darkroom, and a miniature UV lamp holder. The platform interfaces directly with a smartphone (HUAWEI Mate 30, HUAWEI Inc.) for real-time analysis. During operation, the sample-loaded colorimetric cell is placed sequentially in the chamber and darkroom before connecting to the smartphone. A dedicated color recognition application (Color Recognizer, Kaifeng Lefan Network Technology Co., Ltd.) captures digital images and quantifies RGB values from multiple sampling points. The G/R ratio is used as the analytical parameter for S2O82- quantification. This multi-point averaging strategy enhances measurement reliability, establishing a semi-quantitative linear detection method. As shown in Figs. 6c and d, the smartphone-derived G/R values exhibit excellent linear correlation with S2O82- concentrations across a defined range, achieving a detection limit (LOD) of 3.58 μmol/L (3σ/A). The experimental results indicate that, with the assistance of the smartphone color recognition software, the KT@Q[8] assembly can provide intuitive, simple, semi-quantitative analysis and detection of S2O82- in solution, demonstrating significant practical application value.
To further improve detection capabilities, we employed a machine learning framework for predictive modeling. Smartphone-captured images of each sample were processed to extract a multivariate dataset comprising R, G, B, R + G + B, and G/R values. A total of 45 samples were randomly partitioned into a training set (60%) and an independent test set (40%). Using the training set's concentration data and corresponding response variables, a Gaussian Process Regression (GPR) model was developed (Table S2 in Supporting information). The main parameter settings are as follows: the Matern 5/2 kernel function was chosen, the basis function is constant, the kernel function also uses Matern 5/2, isotropic kernels are used for data normalization, and the kernel scale, signal standard deviation, and Sigma are automatically selected. The optimized GPR model achieved exceptional performance, with a coefficient of determination (R2) of 0.99, indicating near-perfect fitting. Training set validation yielded a root mean square error (RMSE) of 2.08 μmol/L and a mean absolute percentage error (MAPE) of 9.7%. Notably, the model maintained robust predictive accuracy on the independent test set (RMSE = 2.22 μmol/L, MAPE = 4.4%), demonstrating generalization capability without overfitting. AS shown in Fig. S15 (Supporting information), the predicted versus actual concentration plots for test samples exhibit close alignment with the ideal y = x regression line, confirming the model's reliability. This integration of smartphone-based colorimetry with machine learning not only refines detection precision but also establishes a scalable framework for rapid, low-cost environmental analysis.
It has been reported that S2O82- may be present in environmental water systems and various foods [55], including honey, white wine, and others. To further assess the probe's performance in real samples, it was used to detect S2O82- in tap water, lake water, honey, and white wine. Different concentrations of S2O82- were introduced into pre-treated samples. Detection data were collected using a sensor paired with a smartphone application. The specific detection process is illustrated in Fig. S16 (Supporting information). When S2O82- (at concentrations of 10, 30, and 60 μmol/L) was individually added to the samples (Table S3 in Supporting information), the smartphone application was used to record the RGB values. Based on the fluorescence sensing solution, the recovery rates for the four actual samples were 96.5%−103.8%, 94%−106.1%, 92.9%−98.6%, and 101%−106.3%, respectively. These results demonstrate that the fluorescence sensing system, integrated with the smartphone platform, can effectively perform both visual and quantitative detection of S2O82- in real samples.
In conclusion, a multicolor-responsive fluorescent probe, KT@Q[8], was developed by combining Q[8] and KT. Both the 4-(4-bromophenyl)pyridyl group of the KT molecule and the benzene ring structure of 3,6-diaminocarbazole entered the hydrophobic cavity of Q[8], forming a 1:1 supramolecular assembly. Remarkably, the probe KT@Q[8] exhibited exceptional fluorescence properties and showed selective recognition of S2O82- in aqueous solutions, with a detection limit of 0.38 μmol/L. Upon addition of S2O82-, the fluorescence color of KT@Q[8] transitioned from orange to green. In addition to its excellent visual detection, KT@Q[8] facilitated quantitative detection of S2O82- residues with a low detection limit of 3.58 μmol/L when paired with a smartphone color recognition application. It could be applied to real-world samples, including tap water, lake water, honey, and white wine. Concurrently, machine learning algorithms validated the accuracy of data prediction. Thus, this sensor platform offers a novel approach for the simple and rapid detection of S2O82-, while providing valuable insights for the development of supramolecular fluorescent probes to tackle environmental pollution and food safety issues.
Declaration of competing interest
The authors declare that they have no known competing financial interests or personal relationships that could have appeared to influence the work reported in this paper.
CRediT authorship contribution statement
Shang-Wei Yuan: Writing – original draft, Data curation. Li Zeng: Writing – original draft, Investigation, Data curation. Li Wu: Methodology, Data curation. Ji-Li Yuan: Validation, Methodology. Chao Kang: Methodology. Xi Zeng: Writing – review & editing, Methodology. Pei-Hua Ma: Writing – review & editing, Methodology. Xin Xiao: Writing – review & editing, Resources, Project administration, Conceptualization.
Acknowledgments
This work was supported by National Natural Science Foundation of China (No. 22361011), Guizhou Provincial Basic Research Program (Natural Science) (No. QKHJC-zk[2025]MS693), and Guizhou Key Laboratory of Macrocyclic and Supramolecular Chemistry (No. ZSYS [2025] 008).
Supplementary materials
Supplementary material associated with this article can be found, in the online version, at doi:10.1016/j.cclet.2025.111962.
[1]
J. Zhang, H.B. Wang, Q.L. Zheng, J.H. Zhi, L.H. Su, Thermochim. Acta. 742 (2024) 179898. doi: 10.1016/j.tca.2024.179898
[2]
C. Amor, J. Rodríguez-Chueca, J.L. Fernandes, et al., Process Saf. Environ. Prot. 122 (2019) 94–101. doi: 10.1016/j.psep.2018.11.016
Q.H. Bai, Y. Xia, Y.K. Kang, et al., Chem. Eng. J. 477 (2023) 146922.
[50]
J.H. Hu, W. Zhang, C.X. Ren, et al., Anal. Chim. Acta 1254 (2023) 341095. doi: 10.1016/j.aca.2023.341095
[51]
A.P. de Silva, H.Q.N. Gunaratne, T. Gunnlaugsson, et al., Chem. Rev. 97 (1997) 1515–1566.
[52]
S.K. Panja, N. Dwivedi, S. Saha. RSC Adv. 6 (2016) 105786–105794.
[53]
G.J. Scerri, M. Caruana, N. Agius, et al., Molecules. 27 (2022) 5939. doi: 10.3390/molecules27185939
[54]
A. Kodiyawala, S. Dutta, Spectrochim. Acta A 339 (2025) 126204.
[55]
W.J. Jing, Y. Wang, Q.H. Shi, et al., Biosens. Bioelectron. 262 (2024) 116529.
Figure 1
(a) Absorption titration spectra of guest KT (10 μmol/L) with Q[8] (0–20 μmol/L). (b) Fluorescence titration spectra of guest KT (10 μmol/L) with Q[8] (0–20 μmol/L). (c) Job's plot of fluorescence intensity versus Q[8] concentration (λex/λem = 334 nm/590 nm). (d) pH-dependent fluorescence of KT and the KT@Q[8] supramolecular assembly (λex/λem = 334 nm/590 nm). Inset: Fluorescence images of KT and KT in the presence of Q[8] host.
Figure 2
Possible interactions in KT@Q[8] and 1H NMR spectrum of KT (a) and KT@Q[8] (b). Inset: A schematic diagram of the interaction between KT and Q[8].
Figure 5
(a) Electrostatic potential distribution of KT@Q[8], KT@Q[8]@S2O82- optimization model. (b) KT@Q[8] and KT@Q[8]@S2O82- frontier molecular orbitals and orbital energies.
Figure 6
(a) Chromaticity diagram of KT@Q[8] with S2O82- concentrations of 0, 6, 10, 14, 22, 26, 30, 34, 38, 42, 46, and 50 μmol/L. (b) Schematic diagram of S2O82- detection using a smartphone color recognizer (collected under 365 nm UV light). (c) Linear plot of fluorescence sensor solution color changes (green channel/red channel) versus S2O82- concentration. (d) Fluorescence color change for S2O82- concentrations ranging from 0 to 70 μmol/L (collected under 365 nm UV light).

 DownLoad:

 下载:
下载:


 下载:
下载:
