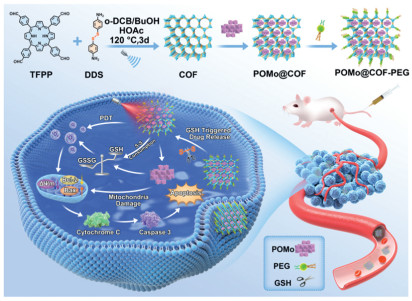
Scheme 1.
Diagrammatic representation of the synthesis of POMo@COF-PEG along with in vivo activating apoptosis signaling pathway and photodynamic therapy.

A dual-functional polyoxomolybdate@COF nanoplatform for synergistic chemo-photodynamic tumor therapy
Mo Zhang , Qingqing Dou , Ge Gao , Fan Xu , Siao Yang , Hongjin Lv , Jing Wang


Malignant tumors have emerged as one of the most prevalent and life-threatening diseases globally [1]. Among the array of therapeutic strategies (e.g., surgical resection, chemotherapy, radiotherapy, immunotherapy, and monoclonal antibody therapy), chemotherapy remains the cornerstone of clinical intervention [2]. Nevertheless, small-molecule chemotherapeutic drugs are often characterized by poor water solubility, limited targeting capabilities, significant side effects, and short circulatory half-lives, leading to reduced bioavailability and suboptimal therapeutic outcomes. The fundamental mechanism of chemotherapy involves inducing cell death through the activation of either endogenous or exogenous apoptotic pathways [3]. Various studies indicate that the disruption of apoptotic signaling pathways may be a pivotal factor contributing to tumor cells’ resistance to traditional chemotherapy and a significant cause of recurrence [4]. Alterations in the expression of apoptosis-related proteins, such as the Caspase family, or mutations in genes like K-Ras, are commonly observed in malignant tumors, conferring resistance to various therapeutic modalities and compromising the sensitivity of tumors to chemotherapeutic agents [5,6]. Consequently, the selection of appropriate nanomedicines and the development of innovative drug delivery systems to restore apoptotic signaling pathways within tumor cells and enhance the sensitivity of therapeutic drugs are of utmost importance in cancer treatment.
Polyoxometalates (POMs) are a class of atomically-precise anionic metal-oxo clusters that have a wide range of applications in catalysis, assembly, and biomedicine [7-9]. Recently, considerable research attention has been focused on exploring their biomedical applications as antibacterial, anticancer, and antiviral agents due to their versatile structures, adjustable compositions, easy availability, and rich physicochemical properties [10-13]. Literature studies showed that polyoxomolybdate (POMo), [NH3Pri]6[Mo7O24]·3H2O (PM-8), exhibited promising antitumor activity against colon adenocarcinoma (Co-4), mammary carcinoma (MX-1), and small cell lung carcinoma (OAT) by inducing apoptosis [14]. Also, [Me3NH]6[H2MoV12O28(OH)12(MoVIO3)4]·2H2O (PM-17) demonstrated clinical potential as a therapeutic for pancreatic (AsPC-1) and gastric (MKN45) cancers by inducing apoptotic features confirmed by Hoechst staining and Annexin V flow cytometry [15,16]. These studies highlighted the assertion of POMo’s role in activating the apoptotic pathway and potentially influencing the tumor microenvironment. However, significant challenges should be addressed to achieve the potential clinical use of POMs-based anticancer and antiviral medicines. For instance, the small size of POMs weakens their enhanced permeability and retention (EPR) effect in tumor tissue, hindering their targeting efficacy and the ability to achieve optimal therapeutic effects with a single treatment modality [17-20]. In addition, special attention should be paid to address the potential toxic side effects and structural instability of POMs while directly using them as nanomedicines under physiological conditions [21,22]. Moreover, despite over decades of research demonstrating their anticancer activity, their insightful antitumor mechanisms remained poorly explored [23,24]. Therefore, the development of innovative drug delivery systems for POMs-based nanomedicines with enhanced targeting and efficient multi-modal therapeutic capabilities is crucial for tumor therapy.
Encapsulation of POM-based nanomedicines within suitable carrier systems has emerged as a promising strategy to address challenges related to biocompatibility, targeting, and the implementation of multi-modal therapies [25-30]. Among various carriers, porous covalent organic frameworks (COFs) have been attracting significant interest for drug delivery applications due to their good biocompatibility, high drug loading capacity, and ease of structural modification [31-34]. Literature works demonstrated that porphyrin-based COFs have attracted particular attention owing to their dual functionalities in drug delivery and photodynamic therapy (PDT) [35]. The crystalline reticular structure of porphyrin-based COFs imparts superior stability and higher reactive oxygen species (ROS) generation in aqueous solutions compared to their constituent porphyrin monomers. Upon near-infrared (NIR) irradiation, these porphyrin-based COFs can generate abundant ROS (e.g., singlet oxygen, 1O2) to trigger cancer cell apoptosis [33,36,37]. In this context, we envisage that the incorporation of POMo antitumor medicines into porous photo-responsive COF carriers could induce remarkable synergistic therapeutic effects on triggering cancer cell apoptosis.
Herein, a novel POMo@COF-PEG composite has been successfully constructed by loading the bioactive molecule (C6H13N4)10[H2Mo16O52]·34H2O (Mo16) as a “cargo” into a porphyrinyl COF carrier (Scheme 1). Both cellular and animal levels (in vitro and in vivo) antitumor studies revealed that the resulting POMo@COF-PEG composite exhibited favorable biocompatibility and synergistic chemo-photodynamic therapy effect, including the POMo-induced apoptosis signaling pathway and COF-mediated photodynamic therapy pathway.
The POMo@COF-PEG composite was synthesized via a solvothermal method, where porphyrin-based COF frameworks with disulfide bonds were constructed through a Schiff base reaction between tetrafluorophenylporphyrin (TFPP) and diaminodisulfide (DDS) (Fig. S1A in Supporting information). The obtained COF and POMo materials have been systematically characterized using multiple spectroscopic techniques. TEM images revealed a uniform sheet-like polygonal morphology for the COF (Fig. S1B in Supporting information), while XRD data confirmed its high crystallinity (Fig. S1C in Supporting information). 13C SS NMR spectroscopy (Fig. S2 in Supporting information) and FT-IR analysis (Fig. S1D in Supporting information) further confirmed the successful formation of COF, which showed characteristic vibrational signals of imine bonds and reduced intensities of monomer-specific peaks. Moreover, no significant changes were observed in the FT-IR spectrum or XRD pattern of COF after 14 days of storage (Figs. S3A and B in Supporting information), and the weight retention was 96.67% (Table S1 in Supporting information). In addition, thermogravimetric analysis (TGA) revealed that COF remains stable at temperatures above 250 ℃ (Fig. S4 in Supporting information). The single-crystal XRD results also confirm the successful preparation of POMo (Tables S2 and S3 in Supporting information). Additional characterization, including comprehensive structural refinement, thermogravimetric (TG) analysis (Fig. S5 in Supporting information), and elemental analysis, confirmed the chemical formula of compound as Mo16. The polyhedral and ball-and-stick of the building blocks of polyoxoanion is shown in Fig. S6 (Supporting information). The Mo16 cluster with characteristic vibrational FT-IR bands was synthesized using a modified literature method (Fig. S1D) [38-40]. Its nanoscale structure (1 nm) was also confirmed by laser particle size analysis (Fig. S7 in Supporting information). UV–vis spectra demonstrated the good solution stability of Mo16 over 7 days (Fig. S8 in Supporting information) [41].
Subsequently, the successful fabrication of POMo@COF-PEG was further characterized through advanced characterization. HR-TEM images revealed uniformly dispersed POM clusters within the composite (red circles, Fig. S9 in Supporting information), which is also validated by the supported by elemental mapping showing a homogeneous distribution of POM components in the COF matrix (Fig. S1E in Supporting information). Zeta potential analysis demonstrated a notable negative shift after Mo16 loading, which was further amplified by PEG conjugation (Fig. S1F in Supporting information). DLS measurements indicated hydrated particle sizes of 277.29 nm (COF) and 352.85 nm (POMo@COF-PEG), with low polydispersity indices confirming colloidal stability (Fig. S1G in Supporting information). The composite maintained structural integrity in water over 7 days (Figs. S10A and B in Supporting information). BET analysis revealed a reduced surface area (59.10 m3/g) and narrowed pore size (1.423 nm) post-Mo16 encapsulation, confirming effective cluster confinement within COF pores (Figs. S1H, I and S11 in Supporting information).
The porphyrin-based COF demonstrated dual functionality, and it could not only serve as a drug carrier but also as a photosensitizer capable of generating singlet oxygen (1O2) under 660 nm laser irradiation. With the application of DPBF as a probe for 1O2 production, the absorbance of DPBF remained stable in the absence of COF (Fig. S12A in Supporting information), but showed a time-dependent decline in the presence of COF under irradiation (Fig. 1C and Fig. S12B in Supporting information). Moreover, neither the loading of POMo nor its cleavage in response to GSH had any impact on the ability of COF to generate 1O2 (Fig. 1C, Figs. S12D and E in Supporting information). Electron spin resonance (ESR) analysis was further utilized to confirm the 1O2 generation by using TEMP as a spin-trapping agent, and it was found that a distinct 1:1:1 triplet ESR signal of the TEMP-1O2 adduct was detected upon laser irradiation (Fig. 1B). In contrast, such a signal was not observed in dark conditions. Importantly, as evidenced by its comparable ESR triplet signal (Fig. 1B), the composite POMo@COF-PEG retained robust 1O2-generation activity even after the incorporation of POMo and PEG, which could reveal the preserved photodynamic functionality of the COF framework in the hybrid POMo@COF-PEG material.
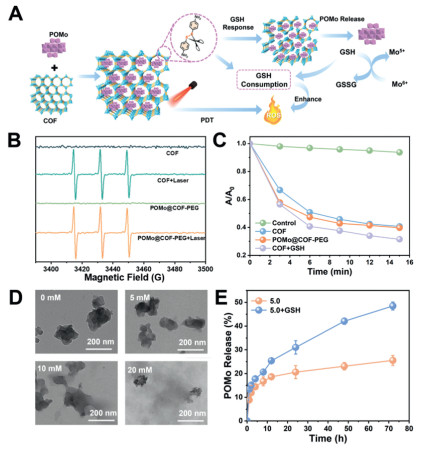
The GSH-depleting mechanism of POMo@COF-PEG was investigated with the application of 5,5′-dithiobis(2-nitrobenzoic acid) (DTNB) as a probe, where GSH consumption was quantified by the decline in UV absorption of 5-thio-2-nitrobenzoic acid (TNB) at 412 nm (Figs. S12E and F in Supporting information). Acidic conditions (pH 5.0) significantly enhanced GSH depletion, which could be confirmed by reduced absorption intensity. TEM imaging revealed progressive structural degradation of COF with increasing GSH concentrations (5–20 mmol/L, Fig. 1D), confirming redox-triggered disulfide bond cleavage. Concurrently, the Mo centers in POMo underwent redox cycling (+5 ↔ +6 valence), amplifying chemodynamic therapy (CDT) by depleting GSH and elevating oxidative stress. ICP-MS data demonstrated GSH-dependent POMo release: Cumulative release reached 48.48% under 10 mmol/L GSH (pH 5.0) versus 20.76% in GSH-free conditions after 72 h (Fig. 1E). Overall, this dual mechanism, disulfide-mediated GSH depletion and Mo redox activity, synergistically enhanced antitumor efficacy based on the promotion of oxidative damage and drug release (Fig. 1A).
Notably, the deep understanding of the insightful anti-tumor mechanism is crucial to facilitate the development of an efficacious tumor-targeted nanoplatform based on POMo, and the cytotoxic effects of POMo on 4T1 cells were initially assessed by MTT assays. Compared with the individual raw materials (Fig. 2A), POMs exhibited significantly higher cytotoxicity. In order to deeply explore the POMo’s cytotoxic action, a proteomic approach was employed to investigate the differentially expressed proteins in 4T1 cells (following Mo16 treatment). Additionally, significant alterations in protein expression between the control and Mo16 groups could be observed in the heatmap (Fig. S13 in Supporting information). According to the results, Mo16 groups exhibited a total of 864 differentially expressed proteins (FC > 1.2, P < 0.05) versus the control, and a total of 437 upregulated and 409 downregulated proteins were included. Moreover, Gene Ontology (GO) analysis was performed to further elucidate the biological functions of these differentially expressed proteins (Fig. 2B), encompassing biological processes (BP), cellular components (CC), and molecular functions (MF) (Fig. 2C). Notably, the proteins associated with mitochondria (critical regulators of apoptosis signaling) were significantly affected. Based on these findings, Kyoto Encyclopedia of Genes and Genomes (KEGG) pathway enrichment analysis was conducted. According to the results, it was indicated that the cell cycle, p53 signaling pathway, and cytosolic DNA-sensing pathway exhibited strong connections with the therapeutic mechanism of Mo16 (Fig. 2D). Besides, these pathways have been previously reported to induce the cell apoptosis based on the modulation of mitochondrial function [42-44].
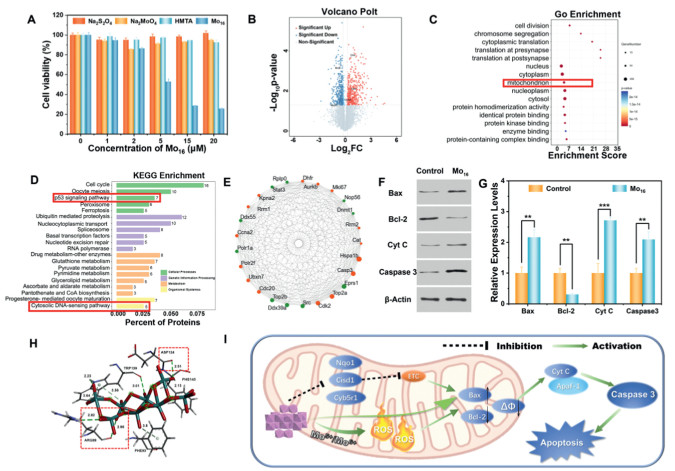
According to the protein interaction network analysis (Fig. 2E), a tightly connected network of key genes could be revealed. Protein enrichment analysis showed that Mo16 treatment upregulated the expression levels of Ctsd, Cdk2, and Dlst in cells, alongside the downregulation of the expression levels of Nqo1, Cisd1, and Cyb5r1. The above phenomenon could block the mitochondrial electron transport chain (ETC) [44-46] and affect the intracellular ATP synthesis and redox levels, thus damaging the mitochondrial membrane potential, alongside the promotion of the release of death signals. After receiving the death signal, Bax protein was transferred to the mitochondrial membrane, followed by the formation of homodimers or multimers and the generation of the permeability transition pores (PT pores), which facilitated the further release of factors (such as Cyt-c). Subsequently, the release of Cyt-c activated the Caspase-3, initiating the Caspase cascade, which was a signaling pathway that resulted in cell apoptosis.
Molecular docking suggests that Mo16 may exert its antitumor activity by influencing Bax, with this hypothesis supported by circular dichroism (CD) spectroscopy (Fig. S15 in Supporting information). Docking analysis showed a binding energy of −8.41 kcal/mol between Mo16 and Bax (Fig. 2H and Fig. S14 in Supporting information). Mo16 formed hydrogen bonds with ARG89 (2.82, 2.96 Å) and ASP142 (2.51 Å) within the BH3 domain, interactions that could alter Bax conformation and thereby modulate its pro-apoptotic function [47]. Hydrophobic contacts with PHE143 further stabilized the Mo16-Bax complex [21], facilitating more effective regulation of Bax activity. Consistently, CD spectra revealed that Mo16 incubation significantly enhanced the Bax signal, particularly at ~222 nm, indicating a shift in secondary structure from a disordered or loose state to a more ordered conformation [48]. This change likely reflects an initial activation of Bax, providing the structural basis for downstream apoptotic events. By contrast, the anti-apoptotic protein Bcl-2 forms heterodimers with Bax, blocking its translocation and dimerization, inducing PT-por closure, and inhibiting cytochrome c release and caspase-3 activation, thereby suppressing apoptosis [49-51].
Based on the proteomic and molecular docking analysis, the following mechanism (by which the POMo activated the apoptotic pathway) could be proposed (Fig. 2I). The unique redox properties of POMo could promote the generation of more ROS. In addition, the reversible multi-electron and proton-storing ability of POMo could block the proton transfer in the respiratory chain, resulting in a decrease in mitochondrial membrane potential and the release of apoptosis related factors such as cytochrome C [52-54]. Besides, the released Cyt C factors could bind with the apoptotic protease activator factor-1 (Apaf-1) to form a polymeric apoptotic body, which could activate the caspase cascade reaction and trigger the cell apoptosis [55].
Western blot (WB) analysis was employed to detect the expression of key proteins associated with the Bcl-2/Bax/Caspase-3 signaling pathway in Mo16-treated 4T1 cells (Figs. 2F and G) in order to verify the proposed therapeutic mechanism of Mo16. According to the results, the Bcl-2/Bax ratio exhibited a decreasing trend after the Mo16 treatment, indicating the increased mitochondrial permeability. Additionally, Mo16 exhibited significant effects on the promotion of the release of cytochrome c, alongside the upregulation of Caspase-3 expression, which ultimately induced the apoptosis. These findings were in agreement with the proteomic analysis. Overall, it was strongly supported by the present results that Mo16 exerted its potent anti-tumor activity based on the activation of the apoptotic pathway.
Based on the characterization of the POMo@COF-PEG nanoplatform, its therapeutic efficacy was further assessed. Notably, flow cytometry analysis was first employed to quantitatively determine the cellular uptake (Fig. 3A). Additionally, CLSM analysis was performed using rhodamine B-labeled COF-PEG to visualize the uptake behavior: Red fluorescence was observed within 4T1 cells after co-incubation with COF-PEG for 1, 2, and 4 h versus the control group (Fig. 3D), and with the increase of the incubation time, a gradual increase in fluorescence intensity within 4T1 cells was observed. This could be attributed to the cellular uptake of COF-PEG nanoparticles, confirming their potential as effective drug delivery carriers. For safe application in the medical field, the biocompatibility of COF nanocarriers was further assessed based on the evaluation of the cytotoxicity of COF towards normal cells (L929 cells) by the MTT assay. As illustrated in Fig. 3B, L929 cells exhibited a cell viability exceeding 90% following 24 h co-incubation at various COF concentrations, indicating the good biocompatibility of COF in biological applications.
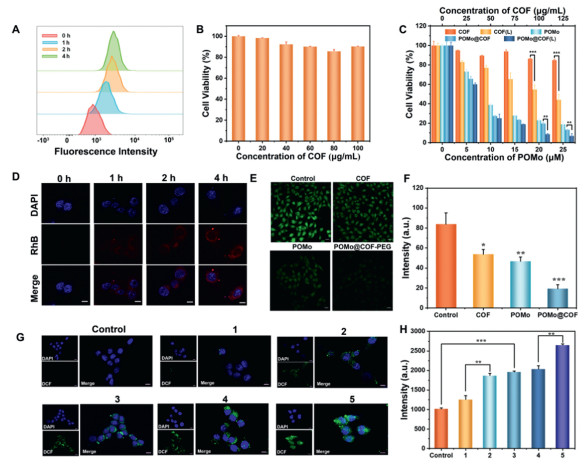
The cytotoxicity of COF, COF (L), POMo, POMo@COF-PEG, and POMo@COF-PEG (L) on 4T1 cells was assessed by the MTT assay (Fig. 3C) to investigate the potential synergistic effects of chemotherapy and PDT mediated by the POMo@COF-PEG system. Notably, the individual COF exhibited minimal cytotoxicity with increasing concentrations. Additionally, COF exhibited a significant dose-dependent cytotoxic effect under the laser irradiation, and it reached a maximum cell inhibition rate of 55.93% at 100 µg/mL. Such cytotoxicity should be attributed to the generation of singlet oxygen (1O2) based on the PDT effects. Additionally, POMo demonstrated a strong cytotoxic effect on itself, with a cell inhibition rate of 81.11% at 25 µmol/L. Compared to POMo@COF-PEG, the cell inhibition rate of POMo@COF-PEG (L) increased to 93.13% at the highest concentration. This could suggest a potential synergistic effect between the PDT mediated by POMo and COF (L), which resulted in the most serious cytotoxicity.
The disulfide bonds within the COF structure underwent a redox reaction with GSH, which resulted in their breakage and the consumption of intracellular GSH. GSH depletion could enhance the ROS-mediated therapeutic effects by compromising ROS clearance mechanisms. With the application of CMFDA as a probe, CLSM analysis was performed (Figs. 3E and F) to assess the intracellular GSH content. Compared with the control group, a decrease in green fluorescence intensity of CMFDA was observed in cells co-incubated with COF and POMo, and the lowest intensity was detected in POMo@COF-PEG treated cells. It could be suggested that both COF and POMo could deplete the elevated GSH levels in tumor cells following the endocytosis by 4T1 cells. Notably, the combined POMo@COF-PEG platform exhibited the most potent GSH-depleting ability. This could effectively reduce the GSH concentration within tumor cells, and it could potentially enhance the PDT effects mediated by COF.
As shown in Figs. 3G and H, the COF group displayed weak green fluorescence versus the control. However, the COF group exhibited a significant increase in fluorescence intensity with 660 nm laser irradiation, suggesting the generation of ROS by COF to induce cellular oxidative stress under PDT conditions. Additionally, a higher level of green fluorescence was observed in the POMo group versus the control, indicating that POMo could induce ROS generation within cells. Notably, the strongest fluorescence intensity could be found in the POMo@COF-PEG (L) group versus the COF (L) and individual POMo. This enhanced response could be attributed to the synergistic effect of two mechanisms: (1) The redox reaction between Mo5+/Mo6+ in POMo and the disulfide bonds in COF, which resulted in GSH depletion; (2) The subsequent amplification of oxidative stress within the tumor microenvironment [29,56].
Proteomic data analysis revealed a remarkable upregulation of Bcl-2 family proteins, caspase-3, and other key apoptosis-associated proteins by Mo16, which could validate its critical functions in the activation of the apoptotic pathway. Additionally, the exceptional anti-tumor efficacy of the POMo@COF-PEG composite system was further corroborated by MTT assays. Besides, apoptosis assays were performed to elucidate the mechanism of cell death induced by the POMo@COF-PEG nanoplatform. As shown in Fig. 4A, both COF (L) and POMo could induce cell apoptosis, and the highest apoptotic rate (86.83%) was observed in cells treated with the POMo@COF-PEG (L) composite. Moreover, consistent results were obtained from the fluorescence imaging of apoptosis (Fig. 4B). Specifically, cells treated with COF (L) and POMo displayed markers of early apoptosis, which was characterized by distinct green fluorescence on the cell membrane for Annexin V-FITC, with minimal red fluorescence signal from PI. Notably, the late apoptosis of a greater proportion of cells was induced by treatment with POMo@COF-PEG (L), which might be attributed to the synergistic effect of POMo-mediated PDT and the action of porphyrinyl COF.
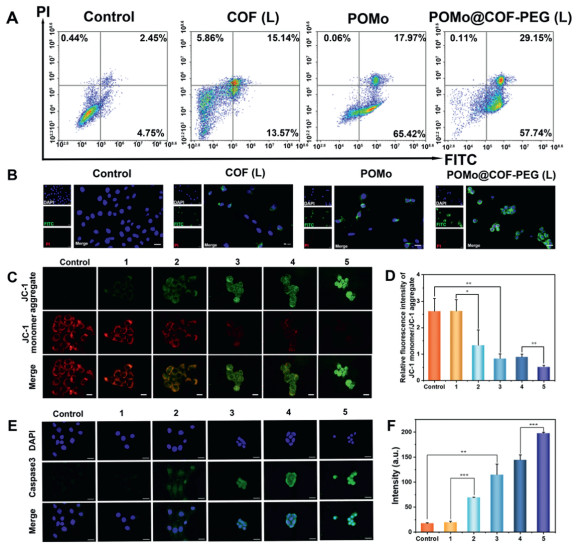
Subsequently, a strong connection between mitochondrial membrane potential (MMP) and cell apoptosis was further established by various research. Given the different Bcl-2 and Bax expression from proteomic and WB results, a JC-1 staining experiment was performed to investigate the MMP (Fig. 4C). JC-1 aggregates appeared to be predominant and exhibited red fluorescence in healthy cells with high MMP. In contrast, MMP exhibited a decreasing trend in damaged cells (with compromised mitochondrial function), thus resulting in a dominance of green fluorescent JC-1 monomers within the mitochondrial membrane. As shown in Fig. 4C, the intensity of green fluorescence in the cytoplasm of treated cells exhibited a progressively increasing trend, while red fluorescence intensity showed a gradually decreasing trend. Based on the analysis of the red and green fluorescence intensities in Fig. 4D, the POMo@COF-PEG (L) group exhibited the lowest ratio of red to green fluorescence. This shift in fluorescence intensity could suggest that the drug delivery system exhibited the most significant damage to mitochondrial membrane potential. As a crucial executioner protein in cell apoptosis, caspase-3 exhibited crucial functions during the apoptotic process. Additionally, the high expression of caspase-3 could effectively promote the occurrence of cell death. Therefore, a caspase-3 staining experiment was conducted to investigate its expression levels, and the upregulated caspase-3 expression was found in the COF (L) and POMo groups, indicating that PDT induced by both COF and POMo could trigger the cell apoptosis. As shown in Figs. 4E and F, the POMo@COF-PEG composite could significantly upregulate the Caspase 3 expression with 660 nm laser irradiation. This might be attributed to a synergistic effect between the laser-induced PDT and the mitochondrial damage caused by POMo, both of which could promote the cell apoptosis. It can be concluded that the biological activity of porphyrin-based COF induced the cell apoptosis, which could serve as both a photosensitizer and a “cargo” carrier. Additionally, the combination of POMo’s ability to activate the apoptotic signaling pathway in tumor cells and the photodynamic therapy mediated by porphyrin COF created a multimodal synergistic approach for the potential anti-tumor treatment.
Based on the promising in vitro anti-tumor efficacy of the POMo@COF-PEG nanoplatform, its in vivo therapeutic potential was further investigated by 4T1 tumor-bearing mice model via tail vein injection. Firstly, the biodistribution of the nanoplatform after tail vein injection was assessed by in vivo imaging techniques for small animals (Fig. 5A), in order to reveal the efficient accumulation of the nanoplatform within the tumor site, in which the peak accumulation was observed at 8 h post-injection. Besides, this timeframe corresponded to the optimal window for therapeutic effect upon irradiation by 660 nm laser. Additionally, these observations were verified by the dissection and subsequent fluorescence imaging of tumor tissues and vital organs (Fig. 5B). Moreover, the nanoplatform exhibited significant accumulation within the tumor, and minimal accumulation was observed in other organs except the liver. This liver accumulation might be attributed to the primary route of nanomaterial clearance occurring through the hepatobiliary system. All animal handling procedures and protocols were conducted in accordance with the guidelines of the Hebei Experimental Animal Care and Use Committee and approved by the Animal Experiment Ethics Committee of Hebei Medical University (Animal Ethics No IACUC—Hebmu-2023,032).
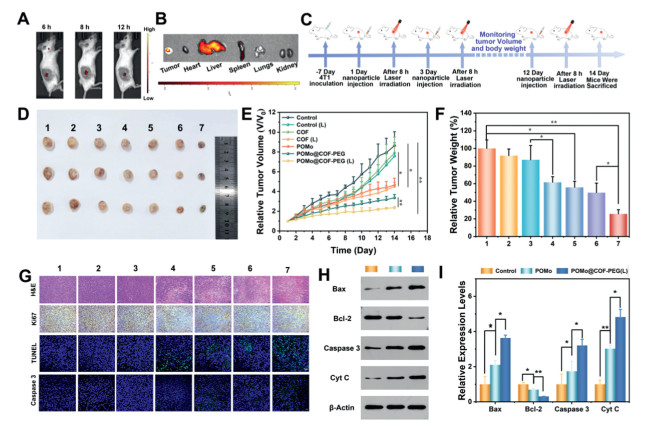
Additionally, the 4T1 tumor-bearing BALB/c mice model was established to evaluate the in vivo therapeutic efficacy of the POMo@COF-PEG nanoplatform, and the treatment protocol was shown in Fig. 5C. Once tumor volumes reached 80–100 cm3, mice were randomly assigned to seven groups (n = 3 mice per group): Control, Control (L), COF, COF (L), POMo, POMo@COF-PEG, and POMo@COF-PEG (L). Besides, the therapeutic effect of POMo@COF-PEG in vivo was visually demonstrated by the excised tumors on day 14 post-treatment. Notably, the smallest tumor volume was observed in the POMo@COF-PEG (L) treatment group (Fig. 5D). The minimal therapeutic effect was found in the Control and Control (L) groups, alongside the continuously increasing trend of tumor volumes throughout the 14-day treatment period (Fig. 5E). In contrast, the POMo and COF (L) treatment groups demonstrated slower tumor growth, alongside the significantly reduced final tumor volumes. Notably, the POMo@COF-PEG (L) group achieved a remarkable tumor inhibition rate of 82.59%, alongside a similar trend in tumor weight (Fig. 5F). Overall, these results could collectively demonstrate the potential in vivo anti-tumor therapeutic efficacy of the constructed nanosystem.
Histological analysis of tumor sections (Fig. 5G) was conducted to further evaluate the therapeutic effects. H&E staining revealed the significant tissue damage, alongside the presence of apoptotic bodies within the tumor tissues of the COF (L), POMo, and POMo@COF-PEG (L) groups. The above findings could support the notion that the therapeutic efficacy of POMo@COF-PEG (L) was attributed to the synergistic effect of PDT and POMo-induced apoptosis, and consistent results were observed in the Ki67 staining. Moreover, TUNEL and caspase-3 immunofluorescence staining were performed on tumor sections to quantify the in vivo pro-apoptotic capability of the nanosystem. It could be indicated that POMo@COF-PEG (L) treatment could maximize the upregulation of caspase-3 expression, which in turn inhibited the tumor growth through the induction of cell apoptosis. Subsequently, the expression of Bcl-2/Bax/caspase3 pathway related proteins in tumors that were treated with POMo and POMo@COF-PEG(L) was further investigated by Western Blot, which aimed to validate the in vivo anti-tumor mechanism of the nanocomposite material. As shown in Figs. 5H and I, POMo@COF-PEG (L) could synergy the PDT and chemotherapy effect of POMo, which significantly enhanced the mitochondrial membrane permeability (decreased Bcl-2/Bax ratio) and promoted the expression of cytochrome C and apoptosis executing protein caspase 3. Ultimately, such a synergistic effect finally triggered tumor cell apoptosis, which exhibited a remarkable anti-tumor effect.
Biocompatibility was the predominant consideration for the clinical application of nanoplatforms. Given its direct exposure to the bloodstream during the tail vein injection, the hemolytic potential of the POMo@COF-PEG nanoplatform was assessed initially (Fig. 6A). According to the results, a minimal increase in hemolysis rate with increasing material concentration was demonstrated. The hemolysis rate remained below 0.72% even at the highest concentration (100 µg/mL), indicating the relative safety of the nanoplatform within the circulation. Moreover, the body weights of mice across treatment groups did not exhibit significant changes throughout the experiment (Fig. 6B).
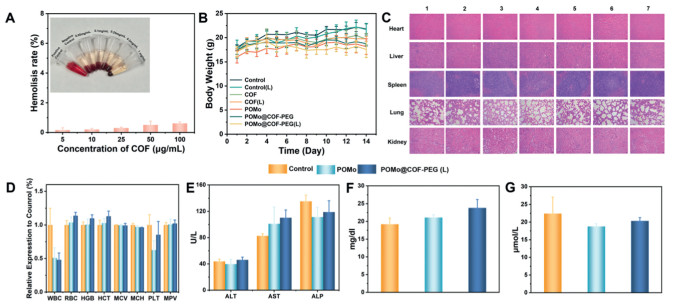
Notably, no obvious physiological abnormalities were found in the histological analysis of major organs via H&E staining, including the heart, liver, spleen, lungs, and kidneys from treated mice (Fig. 6C). To further substantiate the biosafety of the nanoplatform, blood routine and biochemical parameters were evaluated in healthy mice treated with POMo and POMo@COF-PEG (L) after 14 days of injection (Figs. 6D–G). It was found that all measured blood indices remained within the normal physiological range, collectively indicating the excellent biocompatibility of the constructed nanosystem at therapeutic doses.
In summary, a POMo@COF composite was successfully constructed by directly loading the POMo drug (Mo16) into a porphyrin-based COF carrier. Additionally, a POMo@COF-PEG nanoplatform was obtained by subsequent modification of the POMo@COF composite with PEG2000, and it exhibited excellent anti-tumor efficacy and long circulation properties. Besides, in vitro cytotoxicity assays demonstrated high efficiency (93.58%) against breast cancer cells at a concentration of 100 µg/mL under near-infrared irradiation. The IC50 value of Mo16 against 4T1 cells was 5 µmol/L after post-incubation for 24 h. In vivo studies revealed that POMo@COF-PEG could significantly suppress the tumor growth in a breast cancer model with minimally adverse effects based on a synergistic chemo-photodynamic therapy process. Additionally, the proteomic analysis and Western blot experiments were employed in the deep exploration of the anti-tumor mechanism of POMo (Mo16). Overall, this study could offer valuable insights into the development of POMs-based anti-tumor drugs, which aims to contribute to the theoretical foundation and practical applications of dual-functional composite nanodrugs.
Mo Zhang: Writing – original draft, Visualization, Investigation, Formal analysis, Data curation, Conceptualization. Qingqing Dou: Writing – original draft, Visualization, Investigation, Formal analysis, Data curation, Conceptualization. Ge Gao: Validation, Investigation. Fan Xu: Validation, Investigation, Formal analysis. Siao Yang: Validation, Investigation. Hongjin Lv: Writing – review & editing, Supervision, Project administration, Funding acquisition, Conceptualization. Jing Wang: Supervision, Project administration, Funding acquisition, Conceptualization.
The authors declare that they have no known competing financial interests or personal relationships that could have appeared to influence the work reported in this paper.
The authors gratefully acknowledge the financial support from the National Natural Science Foundation of China (Nos. 82473752, 22301060, and 22471017), Central Guidance on Local Science and Technology Development Fund of Hebei Province (No. 246Z2601G), Youth Top Talent Project of Hebei Province Higher Education (No. BJK2024190), Postdoctoral Fund and of Hebei Medical University, Chunyu Project Outstanding Youth Fund of Hebei Medical University (No. CYYQ2023004) and the China Postdoctoral Science Foundation (No. 2023M730914). We thank Hebei Medical University Core Facilities and Centers, Hebei Medical University Chinese Integrative Medicine for electron spin resonance (ESR) testing, and we also thank Prof. Dezhi Kong for providing help regarding technical support for proteomics analysis.
Supplementary material associated with this article can be found, in the online version, at doi:
J. Ferlay, M. Colombet, I. Soerjomataram, et al., Int. J. Cancer 149 (2021) 778–789. doi: 10.1002/ijc.33588
Q. Tang, S. Yang, G. He, et al., Cancer Lett. 548 (2022) 215823. doi: 10.1016/j.canlet.2022.215823
S. Goldar, M.S. Khaniani, S.M. Derakhshan, et al., Asian Pac. J. Cancer Prev. 16 (2015) 2129–2144. doi: 10.7314/APJCP.2015.16.6.2129
K. Hänggi, B. Ruffell, Trends Cancer 9 (2023) 381–396. doi: 10.1016/j.trecan.2023.02.001
N. Waddell, M. Pajic, A.M. Patch, et al., Nature 518 (2015) 495–501. doi: 10.1038/nature14169
P. Bailey, D.K. Chang, K. Nones, et al., Nature 531 (2016) 47–52. doi: 10.1038/nature16965
Y. Yong, L. Zhou, S. Zhang, et al., NPG Asia Mater. 8 (2016) e273. doi: 10.1038/am.2016.63
P. Wang, Z. Wang, P. Wang, et al., Polyoxometalates 3 (2024) 9140047. doi: 10.26599/pom.2023.9140047
T. Wang, Y. Ju, Y. Cheng, et al., Chin. Chem. Lett. 36 (2025) 109871. doi: 10.1016/j.cclet.2024.109871
N. Song, M. Lu, J. Liu, et al., Angew. Chem. Int. Ed. 63 (2024) e202319700. doi: 10.1002/anie.202319700
A. Proust, R. Thouvenot, P. Gouzerh, Chem. Commun. 16 (2008) 1837–1852. doi: 10.1039/b715502f
A.M. Isakovic, M.B. Čolović, T. Ma, et al., J. Biol. Inorg. Chem. 26 (2021) 957–971. doi: 10.1007/s00775-021-01905-4
D. Wang, F. Yuan, X. Deng, et al., Angew. Chem. Int. Ed. 63 (2024) e202410649. doi: 10.1002/anie.202410649
S. Mitsui, A. Ogata, H. Yanagie, et al., Biomed. Pharmacother. 60 (2006) 353–358. doi: 10.1016/j.biopha.2006.02.009
A. Ogata, H. Yanagie, E. Ishikawa, et al., Br. J. Cancer 98 (2008) 399–409. doi: 10.1038/sj.bjc.6604133
A. Ogata, S. Mitsui, H. Yanagie, et al., Biomed. Pharmacother. 59 (2005) 240–244. doi: 10.1016/j.biopha.2004.11.008
S. Zhang, H. Chen, G. Zhang, et al., J. Mater. Chem. B 6 (2018) 241–248. doi: 10.1039/C7TB02743E
Z. Yang, W. Fan, W. Tang, et al., Angew. Chem. Int. Ed. 57 (2018) 14101–14105. doi: 10.1002/anie.201808074
Y. Yan, Q. Yang, J. Wang, et al., Chem. B 5 (2017) 382–387.
G. Guedes, S. Wang, F. Fontana, et al., Adv. Mater. 33 (2021) 2007761. doi: 10.1002/adma.202007761
S.M. Sivasankaran, R. Kowsalya, K. Baskaran, et al., Trop J. Nat. Prod. Res. 9 (2025) 1346–1357.
A. Joshi, R. Gupta, K. Vaghasiya, et al., ACS Appl. Biol. Mater. 3 (2020) 4025–4035. doi: 10.1021/acsabm.0c00093
F. Yang, Y. Chen, Y. Xiao, et al., Pharmacol. Res. 188 (2023) 106645. doi: 10.1016/j.phrs.2023.106645
D. Jia, L. Gong, Y. Li, et al., Angew. Chem. Int. Ed. 133 (2021) 21619–21626. doi: 10.1002/ange.202107265
A. Dolbecq, E. Dumas, C.R. Mayer, et al., Chem. Rev. 110 (2010) 6009–6048. doi: 10.1021/cr1000578
W. Tang, W. Fan, Z. Wang, et al., ACS Nano 12 (2018) 12269–12283. doi: 10.1021/acsnano.8b06058
Y. Liu, Y.Y. Han, S. Lu, et al., Biomater. Sci. 10 (2022) 1257–1266. doi: 10.1039/d1bm01835c
L. Zhu, R. Tao, W. Peng, et al., Results Chem. 5 (2023) 100857. doi: 10.1016/j.rechem.2023.100857
G. Liu, J. Zhu, H. Guo, et al., Angew. Chem. Int. Ed. 58 (2019) 18641–18646. doi: 10.1002/anie.201910815
H.M. Zeng, B.X. Jin, W.H. Wu, et al., Chem. Mater. 7 (2022) 2989–2997. doi: 10.1021/acs.chemmater.1c03837
T. Huo, X. Zhang, M. Qian, et al., Adv. Sci. 9 (2022) 2200608. doi: 10.1002/advs.202200608
Z. Lu, S. Bai, Y. Jiang, et al., Adv. Funct. Mater. 32 (2022) 2207749. doi: 10.1002/adfm.202207749
C. Zhao, F.U. Rehman, H. Jiang, et al., Sci. China Chem. 59 (2016) 637–642. doi: 10.1007/s11426-016-5568-1
Q. Fang, J. Wang, S. Gu, et al., J. Am. Chem. Soc. 137 (2015) 8352–8355. doi: 10.1021/jacs.5b04147
J. Tian, B. Huang, M.H. Nawaz, et al., Coord. Chem. Rev. 420 (2020) 213410. doi: 10.1016/j.ccr.2020.213410
H. Peng, F. Yao, J. Zhao, W. Zhang, et al., Exploration 3 (2023) 20220115. doi: 10.1002/EXP.20220115
L. He, L. Wang, Z. He, et al., Chin. Chem. Lett. 36 (2025) 110717. doi: 10.1016/j.cclet.2024.110717
D.L. Long, P. Kogerler, L.J. Farrugia, et al., Angew. Chem. Int. Ed 42 (2003) 4180–4183. doi: 10.1002/anie.200351615
D.L. Long, P. Kögerler, L.J. Farrugia, et al., Dalton Trans. 8 (2005) 1372–1380.
W.Y. Li, J.J. Wan, J.L. Kan, et al., Chem. Sci. 14 (2023) 1453–1460. doi: 10.1039/d2sc05732h
İ. Küçük, S. Vural, S. Köytepe, et al., Polym. Plast. Tech. Mater. 58 (2019) 1445–1460. doi: 10.1080/25740881.2018.1563123
N. Daviu, Y. Portilla, M.G. de Cedrón, et al., Biomaterials 304 (2024) 122409. doi: 10.1016/j.biomaterials.2023.122409
H. Wei, L. Qu, S. Dai, et al., Nat. Commun. 12 (2021) 2280. doi: 10.1038/s41467-021-22655-6
J. Chen, J. Wei, P. Xia, et al., Cardiovasc. Res.120 (2024) 1024–1036. doi: 10.1093/cvr/cvae084
S.S. Liu, T.X. Jiang, F. Bu, et al., Nat. Commun. 15 (2024) 891. doi: 10.1364/ol.502874
X. Ma, L.H. Zhang, L.R. Wang, et al., ACS Nano 6 (2012) 10486–10496. doi: 10.1021/nn302457v
J. Yao, F. Zhu, Y. Feng, et al., Molecules 30 (2025) 1827. doi: 10.3390/molecules30081827
M. Wallgren, M. Lidman, A. Pedersen, et al., PLoS One 8 (2013) e61452. doi: 10.1371/journal.pone.0061452
Y. Li, H. Hou, Z. Liu, et al., Carbohydr. Polym. 320 (2023) 121255. doi: 10.1016/j.carbpol.2023.121255
Y. Yang, J. He, S. Jin, et al., J. Clin. Oncol. 36 (2018) e15665-e15665. doi: 10.1200/JCO.2018.36.15_suppl.e15665
W. He, X. Li, M. Morsch, et al., ACS Nano 16 (2022) 6293–6308. doi: 10.1021/acsnano.2c00320
R.W. Johnstone, A.A. Ruefli, S.W. Lowe, Cell 108 (2002) 153–164. doi: 10.1016/S0092-8674(02)00625-6
F. Carvalho, M. Aureliano, Int. J. Mol. Sci. 24 (2023) 5043. doi: 10.3390/ijms24055043
A. Bijelic, M. Aureliano, A. Rompel, Angew. Chem. Int. Ed. 58 (2019) 2980–2999. doi: 10.1002/anie.201803868
B. Baliga, S. Kumar, Cell Death Differ.10 (2003) 16–18. doi: 10.1038/sj.cdd.4401166
B. Li, Z. Wu, X. Xu, et al., Inorg. Chem. Front. 11 (2024) 4439–4448. doi: 10.1039/d4qi01079e

Scheme 1 Diagrammatic representation of the synthesis of POMo@COF-PEG along with in vivo activating apoptosis signaling pathway and photodynamic therapy.

Figure 1 (A) Schematic diagram of in vitro action pathway of POMo@COF-PEG. (B) ESR measurement of 1O2 generation by COF and POMo@COF-PEG under different conditions. (C) Decay of DPBF absorbance values within 15 min under different conditions. (D) TEM images of COF co-incubated with different concentrations of GSH for 2 days (scale bar: 200 nm). (E) Cumulative release rate of POMo under different conditions.

Figure 2 (A) Cytotoxicity of Mo16 and the synthetic raw material. (B) Volcano plot of differentially expressed proteins between Mo16 and the control group, where red represents upregulation and blue represents downregulation (FC > 1.2, P < 0.05). (C) GO enrichment analysis. (D) KEGG pathway enrichment analysis. (E) Protein-protein interaction network. (F) Western blot analysis of tubulin expression in 4T1 cells after treatment with Mo16 and (G) grayscale analysis (n = 3). (H) Molecular docking between Mo16 and BAX protein. (I) Proposed anti-tumor mechanism diagram of Mo16. *P < 0.05, **P < 0.01.

Figure 3 (A) Flow cytometry images of cellular uptake of COF. (B) Cell viability of L929 cells after co-incubation with COF for 24 h. (C) Cell viability of 4T1 cells after co-incubation with materials from different groups for 24 h. (D) CLSM images of cellular uptake of COF. Scale bar: 10 µm. (E) CLSM images and (F) fluorescence intensity statistics of intracellular GSH in 4T1 cells after co-incubation with materials from different groups. Scale bar: 20 µm. (G) CLSM images and (H) fluorescence intensity statistics of intracellular ROS in 4T1 cells after co-incubation with materials from different groups: (1) COF, (2) COF (L), (3) POMo, (4) POMo@COF-PEG, (5) POMo@COF-PEG (L). Scale bar: 10 µm. *P < 0.05, **P < 0.01, ***P < 0.001.

Figure 4 After co-incubation of 4T1 cells with materials from different groups: (A) Flow cytometry apoptosis analysis, (B) CLSM imaging of apoptosis. Scale bar: 20 µm. (C) CLSM imaging of mitochondrial membrane potential. Scale bar: 20 µm and (D) fluorescence intensity statistics. (E) CLSM images of Caspase 3 (scale bar: 20 µm) and (F) fluorescence intensity statistics. Where: (1) COF, (2) COF (L), (3) POMo, (4) POMo@COF-PEG, (5) POMo@COF-PEG (L). *P < 0.05, **P < 0.01 and ***P < 0.001. Scale bar: 20 µm.

Figure 5 (A) Fluorescence imaging images of mice after tail vein injection of POMo@COF-PEG. (B) Fluorescence images of major organs and tumors of tumor-bearing mice 12 h after tail vein injection of the POMo@COF-PEG. (C) In vivo treatment protocol of POMo@COF-PEG under 660 nm laser irradiation (0.5 W/cm2, 8 min). (D) Relative tumor growth trend chart of mice in different groups. (E) Photographs of tumors dissected from each group after 14 days of treatment. (F) Tumor tissue weights of mice in different groups. (G) H&E, TUNEL, Ki67, and caspase 3 staining images of tumor tissues from tumor-bearing mice after treatment in different groups. (H) Western blot analysis of tubulin expression in tumor after treatment with POMo and POMo@COF-PEG(L) and (I) grayscale analysis (n = 3). Where: (1) Control, (2) Control (L), (3) COF, (4) COF (L), (5) POMo, (6) POMo@COF-PEG, (7) POMo@COF-PEG (L). Scale bar =20 µm. *P < 0.05 and **P < 0.01.

Figure 6 (A) Hemolysis rate and live photos of hemolysis experiment of COF. (B) Weight changes of mice in different groups within 14 days of drug administration. (C) H&E staining images of major organs of mice in different groups after treatment. (D) Hematological parameters measurement. (E) Liver function. Renal function (F) BUN and (G) CREA. Where: (1) Control, (2) Control (L), (3) COF, (4) COF (L), (5) POMo, (6) POMo@COF-PEG, (7) POMo@COF-PEG (L). Scale bar: 20 µm.

 扫一扫看文章


扫一扫关注我们
 DownLoad:
 下载:
 下载: