Received Date:
25 August 2025 Accepted Date:
12 October 2025 Revised Date:
05 October 2025 Available Online:
15 October 2026
Abstract:
Argyrodite sulfide solid electrolytes are highly favored by the researchers in the field of all-solid-state lithium metal battery due to their high ionic conductivity, relatively stable electrochemical window, and excellent processability. However, argyrodite sulfide solid electrolytes still face some technical difficulties that urgently need to be overcome, such as poor air stability and interface compatibility. This work reports a novel Li6+2xP1–xGaxS5–1.5xO1.5xCl (i.e., LPSC-xGa2O3) electrolyte via modifying Li6PS5Cl electrolyte with Ga2O3. The experimental results show that the prepared solid electrolyte has the highest ionic conductivity when the doping content of Ga2O3 reaches to x = 0.05. In addition, LPSC-0.05Ga2O3 has been proven to have good ability to suppress Li dendrites and improve cathode and anode interface compatibilities. The assembled all-solid-state lithium metal battery using LPSC-0.05Ga2O3 can maintain long-term stability for >200 cycles at 0.5 C. This work has laid the vital foundation for designing a high-performance solid-state electrolyte and promoting development of power battery industry.
Lithium-ion batteries have occupied a dominant position in secondary batteries for a long time. However, the traditional liquid lithium-ion batteries are restricted because of its safety problem and limited energy density. The use of solid electrolytes (SEs) will not have the risks of flammability and explosion. Meanwhile, the theoretical energy density of batteries is also improved by replacing graphite anode with lithium anode. Therefore, all-solid-state lithium metal batteries (ASSLMBs) are regarded as one of the ideal next-generation energy storage equipment [1].
SEs are key component of ASSLMBs. Argyrodite electrolyte, as a typical sulfide solid electrolyte (SSE), has received widespread attention owing to its high ionic conductivity, fine mechanical property and stable electrochemical window. However, its poor air stability and interface compatibility should not be underestimated. SSEs are extremely easy to react with H2O in air to form toxic gas H2S. Besides, on cathode side, it undergoes side reactions with lithium transition metal oxides (e.g., LiCoO2 and LiMn2O4). On anode side, it also undergoes side reactions with lithium to generate by-products (e.g., lithium sulfide and lithium phosphide) and cause the growth of lithium dendrites, leading to internal short circuits in battery. Therefore, it is important to develop an SSE with high ionic conductivity, good air stability and excellent interface compatibility [2].
Element doping of SSEs is the simplest and most efficient strategy to solve above problems [3]. So far, many researchers have doped SSEs with nitrides and halides. The N3–, X– doping [4] may promote the formation of crystal defects and regulate the space charge layer, accelerating Li+ transport. However, N3– itself is easily hydrolyzed, and X– (halide ion) cannot improve the air stability of SSEs. Therefore, to achieve high ionic conductivity and good chemical stability (including air stability and interface stability), better dopants should be explored.
Gallium oxide (Ga2O3), as an excellent semiconductor material, has broad applications in electronic devices, chip manufacturing and energy storage due to its conductivity and luminescence properties [5]. Firstly, Ga2O3 enables suppressed electron transport due to its a wide bandgap of approximately 4.5–5.0 eV, expected to provide a good ion transport pathway in SEs. In addition, since Ga2O3 has good thermal and chemical stability, it will not undergo side reactions during material preparation and battery cycling, which is expected to improve the overall stability of the material and battery. At present, relevant studies have shown that because of the similarity in chemical properties between O and S, the O2– easily replaces the sites of S2– [6]. Meanwhile, the moisture resistance of O2– is better than that of S2–, after the introduction of O2–, the air stability of SSEs can be improved. As a positive valence ion, both Ga3+ and P5+ have the property of soft acid. Ga3+ has a larger ionic radius than P5+, and the charge of Ga3+ is smaller than that of P5+. According to soft hard acid-base theory, Ga3+ is a softer acid compared to P5+, while S2– is a softer base. If Ga3+ replaces P5+, the binding strength of Ga–S is theoretically greater than that of P–S bond, which enhances the air stability after doping. At the same time, the introduction of Ga3+ with larger radius will cause lattice expansion, promoting Li+ transport [7].
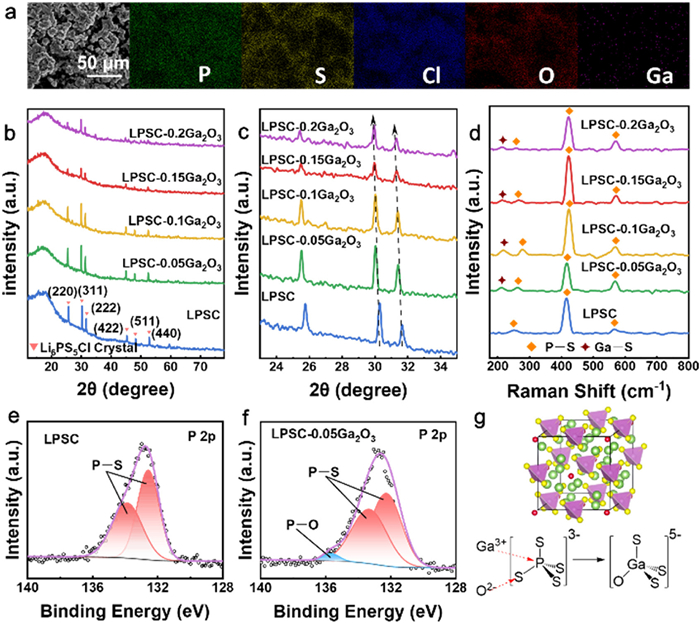
Herein, we prepared Li6+2xP1–xGaxS5–1.5xO1.5xCl (for the convenience, the sample with x = 0 is abbreviated as LPSC, and the samples with other doping contents are abbreviated as LPSC-xGa2O3) electrolytes by ball milling and solid-state sintering methods. To characterize the surface morphologies and components of the as-prepared SSEs, scanning electron microscope (SEM) and energy dispersive spectrometer (EDS) analysis were carried out. The SEM images in Fig. 1a and Fig. S1 (Supporting information) demonstrate that the Ga2O3-doped LPSC has a uniform particle size (average diameter is ~6.5 µm) without obvious agglomerations. In contrast, LPSC displays larger particle size (average diameter is ~20 µm) and obvious agglomeration phenomenon (Fig. S1), which may cause a bad interfacial contact between SSEs and electrodes during battery assembly. Furthermore, EDS mappings and line scans of the doped-LPSC show that, except for P, S, Cl elements from LPSC, O and Ga elements are also detected (Fig. S2 and Table S1 in Supporting information), which proves the successful introduction of Ga and O into LPSC.
Figure 1
Figure 1.
(a) SEM image and corresponding EDS mappings of LPSC-0.05Ga2O3. (b) XRD patterns of LPSC-xGa2O3 (x = 0, 0.05, 0.1, 0.15, 0.2). (c) Local magnification of (b). (d) Raman spectra of LPSC-xGa2O3 (x = 0, 0.05, 0.1, 0.15, 0.2). (e, f) P 2p XPS spectra of LPSC and LPSC-0.05Ga2O3. (g) Crystal-structural diagram of LPSC-xGa2O3, Li+ in green, Cl– in red, S2– in yellow, and PS−43 tetrahedron in purple.
To further investigate the microscopic doping mechanism, X-ray diffraction (XRD), Raman, and X-ray photoelectron spectroscopy (XPS) measurements were conducted. Figs. 1b and c show the XRD patterns of LPSC-xGa2O3 (x = 0, 0.05, 0.1, 0.15, 0.2). From the figures, six diffraction peaks at 25.5°, 30°, 31.5°, 45°, 48° and 52.5° are observed, which corresponds to (220), (311), (222), (422), (511) and (440) crystal plane of LPSC, respectively. It implies that the obtained SEs have great crystal structure, as confirmed by the clear P−S bonds of the PS−43 tetrahedron (420 and 570 cm–1) in Raman spectra of LPSC-xGa2O3 (x = 0, 0.05, 0.1, 0.15, 0.2) in Fig. 1d. Notably, as the doping content of Ga2O3 increasing to x = 0.1, both XRD and Raman peaks of the SSEs gradually shift, indicating lattice distortion of the unit cell, which could be caused by the substitution of the smaller ionic radius of P5+ (R (P5+): 17 pm) by the larger ionic radius of Ga3+ (R (Ga3+): 47 pm), as confirmed by the increased unit cell parameters of Ga2O3-doped LPSC in Rietveld refinement (Fig. S3, Tables S2 and S3 in Supporting information). Moreover, a weak Raman peak due to Ga–S bond at 200–250 cm‒1 more directly verifies that Ga3+ successfully replaces P5+ in PS−43 tetrahedron, forming GaS−45 tetrahedra. Yet, as increasing the doped Ga2O3 to x = 0.2, there is no conspicuous peak shift in XRD and Raman pattens, while the peak intensities decrease seriously, which can be attributed to more defects introduced into the original crystal structures of the SSEs when Ga2O3 is excessive [8]. Furthermore, from the XPS analysis of LPSC and the Ga2O3-doped LPSC (Figs. 1e and f), besides the P−S bonds of the PS−43 tetrahedron, a new P–O bond at 135.6 eV is probed in P 2p XPS spectrum of LPSC-0.05Ga2O3, implying O2– of Ga2O3 replaces S2– in LPSC successfully. All above results demonstrate that Ga3+ partially replaces P5+ and O2– partially replaces S2–, thus constructing a novel LPSC-0.05Ga2O3. Its crystal structure is shown in Fig. 1g.
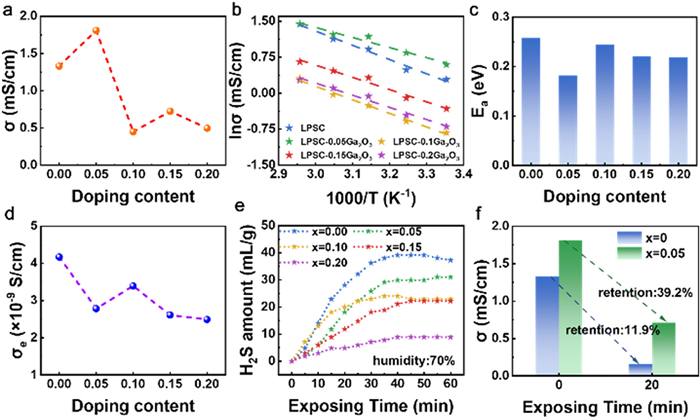
Ionic conductivity (σ), as an essential index of SSEs, directly affects the performance of ASSLMBs. To ascertain the ionic conductivity of the prepared samples, electrochemical impedance spectroscopy (EIS) tests were conducted. The typical Nyquist plots for LPSC-xGa2O3 (x = 0, 0.05, 0.1, 0.15, 0.2) and the corresponding ionic conductivities are shown in Fig. S4 (Supporting information) and Fig. 2a. It is found that LPSC-0.05Ga2O3 exhibits the highest ionic conductivity to be 1.81 mS/cm at room temperature, which is ≈1.4 times that of the original LPSC (1.33 mS/cm). The ionic conductivity improvement of the electrolyte can be attributed to the unit cell expansion caused by the doping of Ga3+, which broadens the migration channel of Li+. However, the ionic conductivity of the electrolyte reveals a decreasing trend when Ga2O3 doping content continues increasing (x > 0.05). It is possibly due to the high electronegativity of O compared to S, which has a strong binding force with Li+.
Figure 2
Figure 2.
(a) Ionic conductivity, (b) Arrhenius curves, (c) activation energy, and (d) electronic conductivity of LPSC-xGa2O3 (x = 0, 0.05, 0.1, 0.15, 0.2). (e) H2S amount produced by LPSC-xGa2O3 (x = 0, 0.05, 0.1, 0.15, 0.2) per unit mass. (f) Ionic conductivity retention of LPSC and LPSC-0.05Ga2O3 after exposure to air.
Compared to ionic conductivity, the activation energy (Ea) of electrolytes can essentially reflect the Li+ transmission kinetics properties of materials [9]. Therefore, we further tested the impedance of LPSC-xGa2O3 (x = 0, 0.05, 0.1, 0.15, 0.2) at temperatures of 25, 35, 45, 55, and 65 ℃, respectively. The impedance is converted into ionic conductivity, and then the Ea is calculated from the slope of the curve between lnσ and 1000/T (Fig. 2b). As shown in Fig. 2c, the Ea of LPSC-xGa2O3 (x = 0, 0.05, 0.1, 0.15, 0.2) exhibits opposite change trend to the ionic conductivity. Among them, the LPSC-0.05Ga2O3 reveals the smallest Ea, only 0.18 eV, indicating that the energy barrier overcome by Li+ migration through LPSC-0.05Ga2O3 is the lowest [10]. Besides, electronic conductivity (σe), as the activity descriptor of electron migration, represents generally opposite trend with the ionic conductivity of LPSC-xGa2O3 (x = 0, 0.05, 0.1, 0.15, 0.2) (Fig. 2d).
As is known, the inherent humidity sensitivity of SSEs will deteriorate electrolyte structure and performance and release H2S, where the P‒S bond in SSEs will break and form P‒O bonds when SSEs encounter water molecules. After doping with Ga2O3, the S2– is replaced by O2–, and the binding force between Ga3+ and S2– is stronger than that between P5+ and S2– [11], which can alleviate the generation of H2S to a certain extent [12]. As a result, the volume of H2S released per unit mass of LPSC-xGa2O3 (x = 0.05, 0.1, 0.15, 0.2) within 1 h at 25 ℃ and 70% humidity is less than what LPSC released (Fig. 2e). Fig. 2f and Fig. S5 (Supporting information) show the ionic conductivity retention that LPSC-0.05Ga2O3 is as high as 39.2%, which is > 3 times of LPSC (11.9%), indicating the air stability of the electrolyte has indeed been improved after doping Ga2O3.
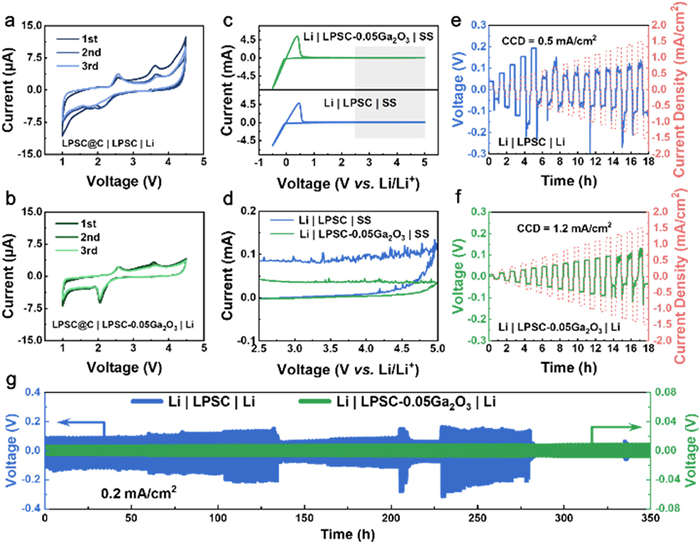
To verify the interface stability between SSEs and electrodes, CV curves of SSEs@C|SSEs|Li cells were measured within 1–4.5 V at 0.1 mV/s. Here, carbon (C) was introduced into the electrolyte with low electronic conductivity to enhance the redox reaction kinetics. Obviously, from Figs. 3a and b, both LPSC and LPSC-0.05Ga2O3 have similar redox peaks. During the process of the cell sweeping from open circuit voltage (OCV) to 1 V, the first peak appearing near 2 V can be considered as the process of SSE decomposition. In addition, the oxidation of the both electrolytes start at ~2.5 V. The results indicate that the "true" electrochemical stability window of both SSEs is 2–2.5 V [13]. Meanwhile, the CV curves can further reflect the decomposition of SSEs at electrode interface. It can be observed that the degree of LPSC redox decomposition is more severe than that of LPSC-0.05Ga2O3. Besides, the cell assembled with LPSC-0.05Ga2O3 has a better overlap degree in the subsequent cycling than the cell with LPSC, which proves that LPSC-0.05Ga2O3 inhabits the decomposition of SSEs and has better interface stability [14].
Figure 3
Figure 3.
CV curves of (a) SSEs@C|LPSC|Li and (b) SSEs@C|LPSC-0.05Ga2O3|Li. (c) CV curves of Li|LPSC|SS and Li|LPSC-0.05Ga2O3|SS. (d) Local magnification of (c). Gradient increase current cycling of (e) Li|LPSC|Li and (f) Li|LPSC-0.05Ga2O3|Li. (g) Galvanostatic cycling of the Li|LPSC|Li and Li|LPSC-0.05Ga2O3|Li at 0.2 mA/cm2.
To evaluate the effect of Ga2O3 on the interface compatibility of Li anode, the CV curves of Li|SSE|SS (stainless steel) half-cells were tested. As shown in Fig. 3c, the electrolytes exhibit a pair of redox peaks near 0 V, corresponding to the insertion of Li+ (Li+ + e− → Li) and the extraction of Li+ (Li ‒ e− → Li+). Furthermore, by observing the local magnified at 2.5–5 V (Fig. 3d), LPSC shows a more active current response, while LPSC-0.05Ga2O3 remains relatively stable, indicating that LPSC may have a side reaction with Li, which can be alleviated by Ga2O3 doping.
The compatibility of Li metal interface is not only reflected by the side reactions at the electrolyte/Li interface, but also by the growth of Li dendrites. As is well known, electrolytes with high electron conductivity are more likely to induce Li dendrites growth. Therefore, direct-current polarization tests were conducted on LPSC-xGa2O3 (x = 0, 0.05, 0.1, 0.15, 0.2), and their electron conductivities were calculated based on it. As shown in Fig. 2d and Fig. S6 (Supporting information), the electronic conductivities of the LPSC after doping Ga2O3 decrease significantly, which can imply that the doped-LPSC have capability to restrain the formation of Li dendrites more efficiently. Furthermore, since critical current density (CCD) can reflect the maximum current density that an electrolyte can withstand without soft short circuits caused by Li dendrites, we assembled Li|SSEs|Li symmetric cells and measured their CCD values to quantify the Li dendrite inhibition capability by Ga2O3-doping. Figs. 3e and f show the polarization voltage curves of Li|SSEs|Li cells cycled at different current densities. The current density corresponding to the voltage drop is considered as the CCD for the formation of Li dendrites in the SSEs. The CCD of the symmetrical cell assembled using LPSC-0.05Ga2O3 is 1.2 mA/cm2, much higher than 0.5 mA/cm2 of LPSC, disclosing Ga2O3-doping can enhance the ability of SSEs against Li dendrite growth under high current [15].
In addition, constant current charge and discharge tests were also conducted on Li|SSEs|Li symmetric cells to further investigate the compatibility of the anode interface with LPSC and LPSC-0.05Ga2O3 [16], setting the current densities at 0.2, 0.5 and 1 mA/cm2, respectively (Fig. 3g and Fig. S7 in Supporting information). Taking 0.2 mA/cm2 as example, the overpotential of Li|LPSC|Li continuously increased within 134 h of cycling, and the voltage dropped sharply in the subsequent cycles, demonstrating short circuit of the cell occurs stemming from Li dendrite growth. In stark contrast, the Li|LPSC-0.05Ga2O3|Li symmetric cell reveals a low overpotential and no sudden voltage drop caused by Li dendrite growth after 350 h of stable cycle, which further confirms that the growth of Li dendrites is better inhibited by LPSC-0.05Ga2O3, and the interface of Li anode is optimized [15].
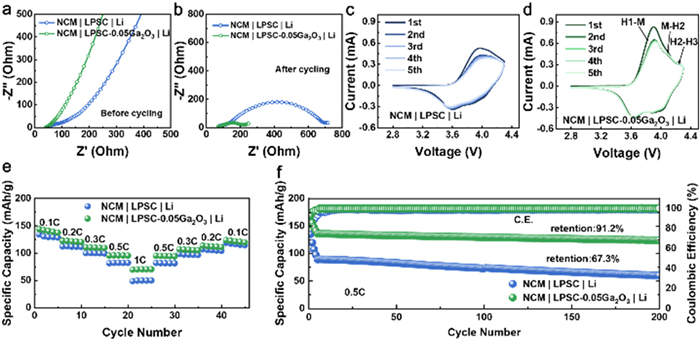
To illustrate the practicality and functionality of LPSC-0.05Ga2O3, the ASSLMBs were assembled by mold cold pressing method, where NCM was used as the cathode and Li was used as the anode. Figs. 4a and b show the Nyquist plots of the batteries before and after cycling [17]. After analyzing by the equivalent circuits (Fig. S8 in Supporting information), it is found that the Rgb and Rint of the NCM|LPSC|Li battery increases significantly after cycling (Table S4 in Supporting information). For comparison, the impedances of NCM|LPSC-0.05Ga2O3|Li do not increase significantly after cycles, suggesting the solid-solid interfaces maintain stability and compatibility during cycling. Such a good interface stability can also be confirmed by the CV results. In Figs. 4c and d, the NCM|LPSC-0.05Ga2O3|Li exhibits three oxidation peaks located at 3.82, 4.05, and 4.22 V, respectively, corresponding to the transition of the cathode material from H1 phase to M phase, M phase to H2 phase, and H2 phase to H3 phase [18], implying the reaction of the cathode active material is more completed in NCM|LPSC-0.05Ga2O3|Li. Moreover, its CV profiles have high coincidence in the first 5 cycles, reflecting the excellent electrochemical reversibility of the battery, which also reflects a good cathode interface compatibility of NCM|LPSC-0.05Ga2O3|Li. In comparison, the coincidence of the NCM|LPSC|Li CV curves are not so good, where the oxidation peak corresponding to the third phase transition cannot be clearly observed. Such phenomenon may be caused by the side reactions at the SSEs/cathode interface.
Figure 4
Figure 4.
Nyquist plots of ASSLMBs (a) before and (b) after cycling. CV curves of (c) NCM|LPSC|Li and (d) NCM|LPSC-0.05Ga2O3|Li. (e) Rate performance of NCM|LPSC|Li and NCM|LPSC-0.05Ga2O3|Li. (f) Cycling stability of NCM|LPSC|Li and NCM|LPSC-0.05Ga2O3|Li.
Fig. 4e shows the rate performance of ASSLMBs [19]. The NCM|LPSC-0.05Ga2O3|Li battery has discharge specific capacity of 138, 122, 110, 95, and 70 mAh/g at 0.1, 0.2, 0.3, 0.5, and 1 C, respectively. When it recovers to 0.1 C, the specific capacity can be restored to 123 mAh/g. By contrast, the NCM|LPSC|Li battery shows relatively low capacity and reversibility. The above results indicate that the ASSLMBs based on LPSC-0.05Ga2O3 has good rate reversibility. With the aim of studying the cycling stability of ASSLMBs, long cycling tests were conducted at 0.5 C on two batteries. As shown in Fig. 4f, after gradient activation from 0.1 C to 0.5 C, the initial specific capacity of NCM|LPSC-0.05Ga2O3|Li battery is 135.68 mAh/g. After cycling for 200 cycles, the specific capacity still remains at 123.85 mAh/g, and the capacity retention rate reaches 91.2%. On the contrary, the initial specific capacity of NCM|LPSC|Li battery is only 89.06 mAh/g, and the capacity retention rate after 200 cycles is only 67.3%. The above results indicate that Ga2O3 doped SSEs can significantly improve the performance of ASSLMBs [20]. Benchmarking against other argyrodite systems reveals that our battery not only matches but often surpasses the electrochemical performance of many reported counterparts (Table S5 in Supporting information).
On the whole, LPSC-xGa2O3 SSEs were synthesized successfully by high-energy ball milling combined with solid-state sintering. Through physical characterizations, it is found that O2– replaces S2– and Ga3+ replaces P5+. Further researches reveal that LPSC-0.05Ga2O3 has higher ionic conductivity (1.81 mS/cm) and fine air stability. More encouragingly, LPSC-0.05Ga2O3 shows the inhibition capability against Li dendrites growth (CCD = 1.2 mA/cm2) and suppressed side reactions in both anode and cathode interfaces. Therefore, the ASSLMBs based on the LPSC-0.05Ga2O3 exhibits high specific capacity with 135.68 mAh/g at 0.5 C and good cycle stability with a 91.2% retention. This work introduces a novel sulfide-based electrolyte materials, showing emerging prospect for future applications in advanced all-solid-state energy storage devices.
The authors declare that they have no known competing financial interests or personal relationships that could have appeared to influence the work reported in this paper.
Acknowledgments
This research was funded in part by National Natural Science Foundation of China (No. U21A2081), Overseas Elite Introduction Program of Wenzhou City (Innovation Long-Term Project), Major Talent Engineering Team Project of Wenzhou City (Ouyue Project), Major Scientific and Technological Innovation Project of Wenzhou City (No. ZG2023055).
Supplementary materials
Supplementary material associated with this article can be found, in the online version, at doi:10.1016/j.cclet.2025.111952.
[1]
Z. Gao, H. Sun, L. Fu, et al., Adv. Mater. 30 (2018) 1705702. doi: 10.1002/adma.201705702
Z. Jiang, S. Li, J. Yang, et al., Mater. Today 90 (2025) 34–42. doi: 10.63313/llcs.9107
Figure 1
(a) SEM image and corresponding EDS mappings of LPSC-0.05Ga2O3. (b) XRD patterns of LPSC-xGa2O3 (x = 0, 0.05, 0.1, 0.15, 0.2). (c) Local magnification of (b). (d) Raman spectra of LPSC-xGa2O3 (x = 0, 0.05, 0.1, 0.15, 0.2). (e, f) P 2p XPS spectra of LPSC and LPSC-0.05Ga2O3. (g) Crystal-structural diagram of LPSC-xGa2O3, Li+ in green, Cl– in red, S2– in yellow, and PS−43 tetrahedron in purple.
Figure 2
(a) Ionic conductivity, (b) Arrhenius curves, (c) activation energy, and (d) electronic conductivity of LPSC-xGa2O3 (x = 0, 0.05, 0.1, 0.15, 0.2). (e) H2S amount produced by LPSC-xGa2O3 (x = 0, 0.05, 0.1, 0.15, 0.2) per unit mass. (f) Ionic conductivity retention of LPSC and LPSC-0.05Ga2O3 after exposure to air.
Figure 3
CV curves of (a) SSEs@C|LPSC|Li and (b) SSEs@C|LPSC-0.05Ga2O3|Li. (c) CV curves of Li|LPSC|SS and Li|LPSC-0.05Ga2O3|SS. (d) Local magnification of (c). Gradient increase current cycling of (e) Li|LPSC|Li and (f) Li|LPSC-0.05Ga2O3|Li. (g) Galvanostatic cycling of the Li|LPSC|Li and Li|LPSC-0.05Ga2O3|Li at 0.2 mA/cm2.
Figure 4
Nyquist plots of ASSLMBs (a) before and (b) after cycling. CV curves of (c) NCM|LPSC|Li and (d) NCM|LPSC-0.05Ga2O3|Li. (e) Rate performance of NCM|LPSC|Li and NCM|LPSC-0.05Ga2O3|Li. (f) Cycling stability of NCM|LPSC|Li and NCM|LPSC-0.05Ga2O3|Li.


 DownLoad:

 下载:
下载:


 下载:
下载:

