School of Water Conservancy and Environment, University of Jinan, Ji'nan 250022, China
b.
Shandong Resources and Environment Construction Group Co. Ltd., Ji'nan 250100, China
c.
Shandong Key Laboratory of Water Pollution Control and Resource Reuse, School of Environmental Science and Engineering, Shandong University, Qingdao 266237, China
Received Date:
13 June 2025 Accepted Date:
03 October 2025 Revised Date:
18 August 2025 Available Online:
15 May 2026
Abstract:
Rational design of nonmetallic heteroatom-doped biochar catalysts for peroxymonosulfate (PMS) activation faces dual challenges in regulating electronic structures and clarifying non-radical pathways. This study addressed this through a nitrogen-oxygen co-doped biochar (NOBCBM) synthesized via mechanochemical ball milling and chemical doping. Co-doping of C=O, pyridinic N, and graphitic N synergistically enhanced electron transfer and PMS activation efficiency compared to single N-doped biochar systems. The optimized NOBCBM removed 94% oxytetracycline (OTC) (20 mg/L) in 30 min, with a kinetic constant (kobs = 0.1523 min−1) over twice that of NSBCBM (0.0664 min−1). Radical quenching and electron paramagnetic resonance identified singlet oxygen (1O2) and electron transfer as dominant non-radical pathways. Density functional theory (DFT) calculations revealed oxygen doping elevates local electrostatic potential and redistributes electron density at N-active sites, amplifying catalytic activity. The system demonstrated robust catalytic performance across pH 3–11, high salinity, and complex water matrices, maintaining > 80% OTC removal over 72 h. Plant growth assays and life cycle assessment (LCA) confirmed minimal ecological impacts, with purified water supporting normal seedling development. This work elucidates the critical role of N/O co-doping in steering PMS activation toward non-radical mechanisms while establishing a sustainable paradigm for metal-free biochar catalysis in water remediation.
The pervasive discharge of antibiotics like oxytetracycline (OTC) into aquatic systems poses escalating ecological and public health risks due to incomplete metabolic assimilation and environmental persistence [1–3]. Conventional wastewater treatments exhibit limited removal efficiencies and risks of secondary pollution, necessitating advanced oxidation processes (AOPs) for contaminant mineralization [4]. PMS-based AOPs, distinguished by robust oxidation capacity and broad pH adaptability, outperform ozone- or H2O2-driven systems [5,6] However, traditional PMS activation methods relying on UV irradiation, thermal energy, or transition metals face challenges including energy inefficiency and metal leaching, underscoring the imperative for sustainable metal-free catalysts [7,8].
Carbonaceous materials, particularly biochar derived from agro-industrial waste, offer promise due to their tunable porosity, surface functionality, and environmental compatibility [9]. Nitrogen (N) doping enhances PMS activation by modulating electron density and creating defect-mediated active sites, improving adsorption and catalytic efficiency. In contrast, single-atom doping with oxygen (O), sulfur (S), or boron (B) yields limited improvements, primarily altering surface polarity without establishing stable catalytic centers [10]. To enhance the performance of N-doped biochar catalysts, metal-N co-doped catalysts (e.g., Fe/N, Co/N, Mn/N) have been developed [11,12]. However, this approach introduces risks of metal leaching and increases production and disposal costs, despite improving catalytic activity. Critically, oxygen's high electronegativity and lone-pair electrons theoretically synergize with nitrogen's electron-donating properties, optimizing sp2 carbon lattice polarity and generating dual-active centers [13]. Such N, O co-doping could mitigate the limitations of single dopants by enhancing interfacial electron transfer kinetics and stabilizing metastable radical intermediates, which is a hypothesis that requires rigorous validation through both experimental and computational methods.
Importantly, while heteroatom-doped carbons typically activate PMS via radical pathways (SO4•−, •OH, O2•−), non-radical mechanisms (1O2 generation, electron transfer) demonstrate superior selectivity and resistance to environmental interference, making them ideal for complex matrices [14]. Tailoring catalysts to favor non-radical pathways demands precise control over dopant configurations (e.g., type, coordination) and defect engineering. However, the interplay between multi-heteroatom doping, surface defects, and PMS activation mechanisms remains poorly resolved, particularly regarding 1O2 generation pathways [15]. Addressing these gaps is critical for designing catalysts that balance high reactivity with environmental adaptability, guiding practical applications in real-world water remediation [16]. Furthermore, current research predominantly evaluates catalytic performance through short-term (< 1 h) static batch experiments, emphasizing initial kinetics but neglecting hydrodynamic effects on mass transfer and long-term stability [17]. These idealized conditions poorly replicate natural aquatic environments, where turbulent flows govern pollutant-catalyst interactions.
To address these research gaps, we developed a nonmetallic N, O-doped biochar catalyst (NOBCBM) using wheat straw as a precursor to facilitate green synthesis and in-situ heteroatom doping. This study aims to: (1) Demonstrate that N, O co-doping overcomes the limitations of single N-doped biomass catalysts to achieve efficient OTC degradation; (2) elucidate non-radical degradation mechanisms, reactive sites, and pollutant degradation pathways, demonstrating system resilience to environmental perturbations; (3) simulate the real water flow conditions and consider the influence of time factors on the degradation process; (4) study the impact of purified water on plant growth and evaluate the ecological safety and environmental friendliness of the catalyst. By exploring the synergistic effects of N, O co-doping and employing holistic evaluation methods, this work not only enhances understanding of heteroatom-engineered biochar catalysis but also offers a scalable, sustainable strategy for mitigating antibiotic pollution in aquatic ecosystems, thereby advancing the field toward practical, environmentally responsible solutions.
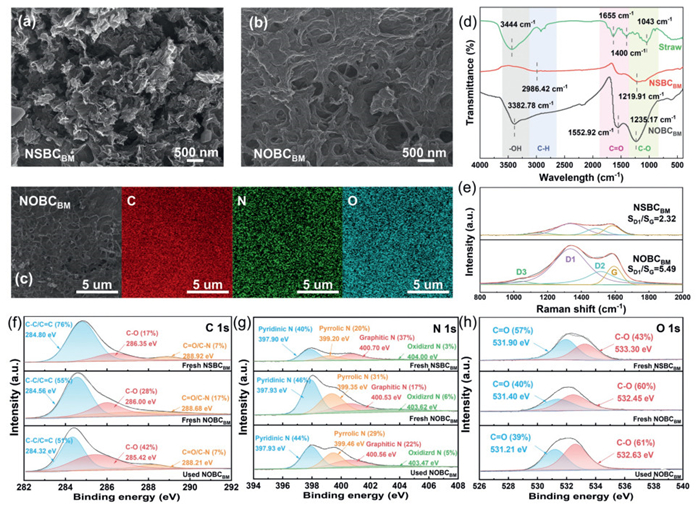
Following ball milling, NSBCBM displayed fragmented flake-like graphite structures (Fig. 1a), indicative of mechanical shear forces disrupting the original biomass architecture. The synergistic combination of ball milling and N/O co-doping in NOBCBM resulted in a highly porous, irregular microstructure (Fig. 1b). This structural evolution arises from two key processes: (1) thermal decomposition of dicyandiamide (DCD) during pyrolysis generated gaseous byproducts that fracture the carbon matrix, and (2) oxygen atom incorporation induced lattice strain, creating interconnected pores and surface defects [18]. Elemental mapping confirmed homogeneous distribution of carbon, nitrogen (22.8%), and oxygen (25.3%) throughout NOBCBM (Fig. 1c, Fig. S1a in Supporting information), ensuring uniform active site accessibility. Fig. S1b (Supporting information) displayed N2 adsorption-desorption isotherms for NSBCBM and NOBCBM, revealing type Ⅳ curves with H3 hysteresis loops characteristic of mesoporous materials. Structural parameters in Table S1 (Supporting information) showed that NOBCBM possessed enhanced textural properties relative to NSBCBM, including the larger BET surface area (105.55 vs. 99.26 m2/g) and the higher mesopore volume (0.59 vs. 0.48 cm3/g). These improvements correlated with superior dispersity, accelerated mass transfer, and elevated OTC adsorption capacity.
Figure 1
Figure 1.
SEM images of (a) NSBCBM, (b) NOBCBM. (c) EDS mapping images of NOBCBM. (d) FTIR patterns of Straw, NSBCBM and NOBCBM. (e) Raman patterns for NSBCBM and NOBCBM. (f) C 1s, (g) N 1s and (h) O 1s XPS spectrum of NSBCBM, NOBCBM.
Surface functionalization was systematically characterized through X-ray photoelectron spectroscopy (XPS) and FTIR spectroscopy. FTIR spectra (Fig. 1d) revealed the enhanced oxygen-containing functionalities in NOBCBM compared to NSBCBM, particularly intensified C–O (1220 cm−1) and C═O (1560 cm−1) stretching vibrations [19]. These observations aligned with XPS quantification: C 1s deconvolution showed that C–O and C═O contributions increased from 17% and 7% in NSBCBM to 28% and 17% in NOBCBM, respectively (Fig. 1f). Concurrently, N 1s spectra demonstrated a doubling of oxidized nitrogen species (6% vs. 3% in N 1s XPS, Fig. 1g), confirming oxygen doping's role in modifying chemical environments. These oxygen-rich functional groups enhanced PMS adsorption and electron transfer kinetics [20].
Raman spectroscopy data from Fig. 1e showed two characteristic bands: The D band at 1360 cm−1 and the G band at 1571 cm−1. The intensity ratio of the D and G bands (SD1/SG) is a well-established indicator for evaluating defect concentration in biochar materials [21]. Notably, the SD1/SG value of NOBCBM (5.49) was higher than that of NSBCBM (2.32), indicating that O doping increased the defect density in the composite. The unique structure of NOBCBM significantly enhances its targeting of PMS and OTC through a series of synergistic mechanisms. In terms of electronic modulation of N, O doping, the pyridine nitrogen atom in the NOBCBM structure significantly enhances the adsorption capacity of PMS, allowing PMS molecules to be adsorbed onto the catalyst surface more efficiently (The proof is presented in DFT calculations) [21]. Meanwhile, the presence of graphitic nitrogen atoms enhanced the electron conduction efficiency, ensuring smooth and unobstructed electron transfer during the catalytic reaction. In addition, the carbonyl oxygen atom in the structure further promoted the directional activation of PMS through surface dipole polarization, which enables the PMS molecules to be more efficiently converted into active oxide species on the catalyst surface (Figs. 1d, f, h).
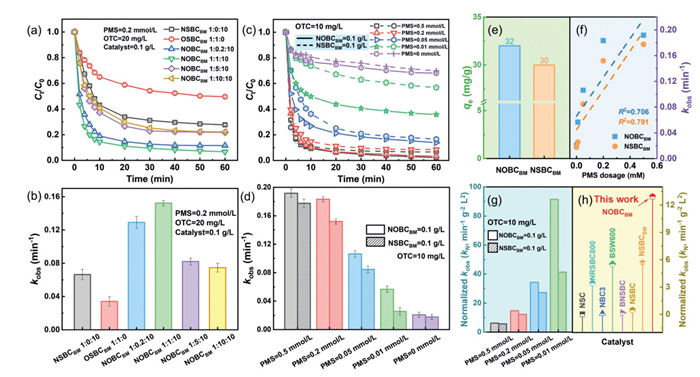
The catalytic performance of catalysts with varying N/O doping ratios was evaluated for OTC degradation (20 mg/L) (Fig. 2a). Single oxygen-doped catalysts (OSBCBM) exhibited markedly inferior activity compared to N-doped counterparts (NSBCBM), confirming nitrogen doping sites as primary active centers. Notably, dual N/O doping achieved a 2.3-fold enhancement in kobs (0.1523 min−1) over single N-doped catalysts (0.0664 min−1), demonstrating the critical role of synergistic non-metal interactions in amplifying catalytic efficiency (Fig. 2b). While low oxygen content optimized activity by fine-tuning electronic structures and defect density, excessive oxygen loading suppressed performance, likely due to pore blockage at active sites. The catalyst synthesized at a 1:1:10 mass ratio (straw: MCHP: DCD) demonstrated peak efficiency (94% degradation; kobs = 0.1523 min−1), outperforming other formulations (Fig. 2b). This breakthrough highlights the transformative potential of dual heteroatom engineering in overcoming the limitations of single-dopant systems, providing a scalable strategy for advanced water purification technologies.
Figure 2
Figure 2.
Degradation of OTC (a) in different O doping ratios and (b) kobs values; Degradation of OTC (c) in different PMS dosage and (d) kobs values. (e) Adsorption of OTC by NOBCBM. (f) Correlations between different PMS dosage and kobs. (g) Normalized kobs comparison of OTC degradation by NOBCBM/PMS at different PMS concentrations. (h) Normalized kobs comparison of OTC degradation by NOBCBM/PMS and other nonmetallic catalyst/PMS systems.
The NOBCBM/PMS system's OTC removal efficiency was systematically evaluated under varying PMS doses (0–0.5 mmol/L) (Fig. 2c). OTC removal efficiency exhibited a dose-dependent increase, rising from 32% at 0 mmol/L PMS (adsorption-only phase) to 94% at 0.2 mmol/L PMS, with kobs reaching 0.1833 min−1 (Fig. 2d). Notably, NOBCBM achieved higher removal efficiency than NSBCBM at all tested PMS concentrations, even surpassing NSBCBM's performance at 0.5 mmol/L PMS when using only 0.2 mmol/L PMS. This stark contrast underscores dual N/O doping's ability to amplify catalytic performance while minimizing oxidant consumption, justifying the economic selection of 0.2 mmol/L PMS for subsequent studies. Adsorption equilibrium occurred rapidly within 40 min (Figs. 2c and e). NOBCBM demonstrated a 32 mg/g adsorption capacity, exceeding NSBCBM's 30 mg/g, directly attributable to oxygen doping-induced surface area expansion and adsorption site proliferation. In catalytic systems, kobs values showed a linear correlation with PMS concentration (Fig. 2f), driven by enhanced electron transfer and reactive oxygen species (ROS) generation at elevated oxidant levels. Standardized analysis (normalized to unit PMS/catalyst dosage) revealed NOBCBM's kN values (up to 91.45 min−1 g−2 L2) were 2.2-fold higher than NSBCBM's (up to 41.29 min−1 g−2 L2) (Fig. 2g), highlighting dual doping's synergistic role in optimizing active site accessibility and PMS utilization efficiency. Compared with the kN values of the other non-metallic doped catalysts reported in the literature, the superior performance of NOBCBM was further verified, achieving a standardized degradation rate increase of 2 to 12 times under the same conditions (Fig. 2h, Tables S2 and S3 in Supporting information). These findings collectively demonstrate the transformative potential of N/O co-doping in advancing metal-free catalytic systems for sustainable water remediation.
The catalytic performance of NOBCBM was dose-dependent (Figs. S2a and b in Supporting information). At 0.05 g/L, OTC degradation reached equilibrium within 30 min (92.3% removal). Increasing the dosage to 0.1 g/L enhanced removal efficiency to 98.7% (kobs = 0.1917 min−1), demonstrating dual N/O doping's ability to amplify active site availability and PMS utilization. Compared to NSBCBM, NOBCBM's superior performance stems from synergistic effects: oxygen doping introduces additional defect sites, while nitrogen optimizes electron transfer, collectively increasing ROS generation per unit catalyst. The OTC concentration significantly influenced system performance (Figs. S2c and d in Supporting information). In NSBCBM/PMS systems, increasing OTC from 10 mg/L to 30 mg/L reduced removal efficiency from 91% to 62% (kobs = 0.1520–0.0479 min−1). In contrast, NOBCBM/PMS maintained higher stability under identical conditions (86%–97%), attributable to enhanced active site density and PMS activation efficiency from N/O co-doping. This dual doping strategy minimizes catalyst deactivation at elevated pollutant concentrations by preventing active site saturation.
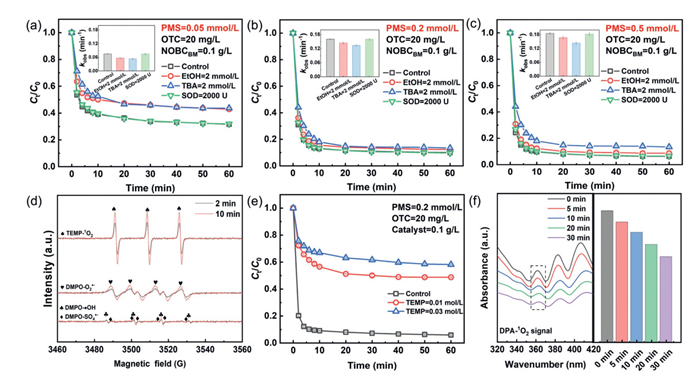
To elucidate the degradation pathway of OTC in the NOBCBM/PMS system, researchers employed free radical quenchers to characterize the contribution of ROS to OTC oxidation [22]. From Figs. 3a-c, at PMS = 0.05 mmol/L, the inhibitory effect of adding EtOH and TBA on SO4•‒ and •OH was ~9%. This inhibitory effect weakened as the PMS concentration increased. As free radical trapping agents, EtOH and TBA have limited radical capturing ability. When the radical generation rate exceeds the trapping agent's capacity, some radicals escape and participate in the target reaction, weakening the inhibition. The minimal inhibition observed from quencher addition indicated that SO4•‒ and •OH did not serve as dominant oxidants in this system. To evaluate the role of O2•−, SOD was introduced as a specific scavenger [23]. Experimental results revealed negligible effects of O2•− on OTC degradation, confirming its minor role as a reactive intermediate during the reaction.
Figure 3
Figure 3.
OTC quenching experiment and kobs at PMS concentrations of (a) 0.05, (b) 0.2 and (c) 0.5. (d) EPR spectrums of NOBCBM/PMS systems. (e) Different concentrations of TEMP quench 1O2. (f) Ultraviolet spectrum of DPA-1O2.
The electron paramagnetic resonance (EPR) technique with DMPO spin trapping reagent showed weak signals of SO4•‒, •OH, and O2•− in the NOBCBM/PMS system (Fig. 3d) [24]. This indicated the catalytic system generates free radicals by oxidizing DMPO to DMPOX. However, free radicals have short lifetimes (usually microseconds or nanoseconds). They may rapidly decompose after generation. In EPR assays, radicals can be detected with a capture agent, but in the actual reaction, they may be quickly consumed and unable to effectively participate in the target reaction. The 1O2 is commonly generated in PMS-based AOPs. TEMP was selected as the 1O2 spin trapping reagent [25]. Fig. 3d clearly shows a large amount of 1O2 generated in the NOBCBM/PMS system. TEMP also verified the role of 1O2. In the NOBCBM/PMS system, OTC removal decreased from 94.1% to 41.8% (Fig. 3e). This means 0.03 mol/L TEMP inhibited OTC degradation by up to 52.3%, confirming 1O2 as an effective reactive species for OTC removal [26]. The oxidation of 9,10-diphenylanthracene (DPA) by 1O2 produces a unique peak near 378 nm, which can detect 1O2 [27]. In the NOBCBM/PMS system, the absorption peak intensity near 378 nm decreased over 10 min, furtherly indicating continuous 1O2 consumption (Fig. 3f). Furthermore, the accelerated OTC degradation observed upon replacing H2O with D2O (Fig. S3 in Supporting information), resulted in complete removal and an increase in kobs from 0.206 min−1 to 0.277 min−1. This rate enhancement confirms the significant contribution of 1O2.
A premix experiment was designed to investigate the electron transfer mechanism driving OTC degradation in the NOBCBM/PMS system. NOBCBM and PMS were premixed for 5, 10, and 15 min before OTC addition [28]. As shown in Fig. S4a (Supporting information), OTC degradation efficiency decreased by only ~10% after 15 min of pre-mixing. This minimal reduction confirms that non-radical pathways dominate the reaction. The open circuit potential (OCP) measures electrode potential without current flow, reflecting material stability and reaction tendency under specific conditions. A higher OCP allows catalysts to reach the required reaction potential more easily, reducing overpotential and enhancing efficiency [29]. Fig. S4b (Supporting information) showed NOBCBM had an initial OCP of 0.2389 V, significantly higher than NSBCBM (0.1338 V), confirming superior catalytic performance. Introducing PMS and OTC alters the catalyst's surface electronic state, affecting active sites and OCP values. This provided insights into electron transfer processes during pollutant oxidation [30]. It can be seen that the OCP value decreases when OTC is added, indicating that electrons play a role in the degradation of OTC. In electrochemical impedance spectroscopy (EIS), the diameter of the semicircular arc reflects electron transfer resistance, with smaller radii indicating higher conductivity [31]. As depicted in Fig. S4c (Supporting information), the radius followed the order NSBCBM > NOBCBM, demonstrating superior electrical conductivity in NOBCBM. Tafel polarization curves (Fig. S4d in Supporting information) showed a corrosion potential order of NOBCBM > NSBCBM, suggesting from a thermodynamic perspective that NOBCBM electrodes exhibit greater resistance to corrosion compared to NSBCBM [32].
XPS analysis identified catalytic active sites in NOBCBM through chemical state evolution of carbon, nitrogen, and oxygen. Deconvolution of the C 1s spectrum revealed three characteristic peaks (Fig. 1f): C–C/C═C (284.6 eV), C–O (286.0 eV), and C═O/C–N (288.7 eV). A marked decrease in C–/C═C (from 55% to 51%) and C═O/C–N (from 17% to 7%) contents suggested graphitic structure disruption, implicating these sites in non-radical mechanisms such as electron transport and singlet oxygen generation. The N 1s spectrum (Fig. 2g) resolved four coordination states: Pyridinic N (397.9 eV), pyrrolic N (399.4 eV), graphitic N (400.5 eV), and oxidized N (403.6 eV). Pyridinic and graphitic N, due to nitrogen's higher electronegativity, modified nearby carbon charge distributions. Post-reaction, pyridinic and pyrrolic N contents decreased from 46% to 44% and 31% to 29%, likely from PMS/contaminant conversion via adjacent activated carbon. Concurrent O 1s analysis (Fig. 1h) demonstrated surface oxidation through intensified oxygen functionality signals, consistent with reactive species formation during catalysis. Complementary FTIR analysis (Fig. S5 in Supporting information) tracked functional group evolution across reaction cycles. Pre-catalysis spectra exhibited prominent C═O stretching (1553 cm−1) and C–O vibrations (1235 cm−1). After reaction, the intensity of oxygen-containing functional group stretching vibrations in NOBCBM decreased, particularly for C═O groups, which aligned with the XPS analysis results (Figs. 1f and h) and suggested these groups serve as active sites in the reaction.
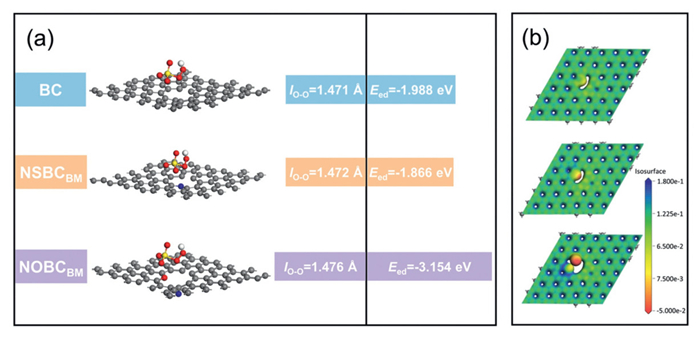
Additionally, in the NOBCBM system, PMS activation began with chemisorption. N/O co-doping induced electronic modulation, forming localized electron-deficient regions. Pyridine nitrogen's lone pairs coordinated with PMS's terminal O atom, weakening the O–O bond (bond length increased from 1.471 Å to 1.472 Å via DFT calculations) (Fig. 4a). The high electronegativity of carbonyl oxygen (C═O) polarizes adjacent carbon atoms, creating localized electron-deficient regions that asymmetrically redistribute charge. This dipole polarization weakens the PMS O–O bond, elongating it from 1.472 Å to 1.476 Å and reducing bond strength. Consequently, the polarized carbon framework facilitates heterolytic O–O cleavage through electron transfer, preferentially generating 1O2-dominated non-radical species rather than radical pathways, as conclusively validated through EPR and quenching experiments. Defect structures from ball milling (e.g., five-membered rings, edge carbons) acted as electron transfer channels, enhancing electron flow from NOBCBM to PMS. EIS showed NOBCBM had a lower transfer resistance compared with that of NSBCBM, confirming superior electron transfer. DFT calculations were performed to explore the activation of PMS by N/O co-doped biochar and material defects. As shown in Fig. 4a, PMS adsorption on NOBCBM exhibited an energy (Ead) of -3.154 eV, which was more negative than that on BC and NSBCBM. This stronger adsorption facilitates the formation of NOBCBM/PMS* complexes, promotes PMS activation, and induces the generation of 1O2, which were the key steps in the non-radical degradation pathway. Additionally, this non-metal doping was also confirmed to result in a longer O–O bond in the catalyst, which is favorable for the production of reactive species from PMS. The Fig. 4b displayed the molecular electrostatic potential (ESP) of the materials, where positive and negative potential regions are represented by blue and red, respectively. Nitrogen atoms, with higher electronegativity, created localized potential wells by lowering the electrostatic potential around them, which enhanced the adsorption of PMS and contaminant. Oxygen atoms, with even stronger electronegativity, further reduced the potential around nitrogen atoms, improving adsorption capacity for PMS and contaminants and boosting catalytic activity. Consequently, NOBCBM exhibited higher electron density than NSBCBM. This finding suggests that OTC may be more effectively adsorbed onto the NOBCBM material.
Figure 4
Figure 4.
(a) Binding of PMS onto different catalyst configurations with different adsorption energies (Eed) and lo-o binding lengths. (b) Electron density distribution of different structures.
The Fukui function f− is associated with a molecule's ability to lose electrons. In chemical reactions, a higher f− value indicates the molecule is more prone to electron loss, favoring electrophilic reactions. f+ relates to the molecule's capacity to accept electrons. A higher f+ value signifies greater readiness for nucleophilic reactions. f0 reflects changes in the molecule's electron cloud, indicating the influence of free radicals on reactivity without significant electron gain or loss. Analysis of f−, f+, and f0 revealed that O2, N8, and N32 were favorable for electrophilic reactions; C11, C17, and C20 were prone to nucleophilic reactions; and N8 was susceptible to radical reactions (Figs. S6 and S7, Table S4 in Supporting information). These atomic sites were thus likely the most reactive during the degradation process.
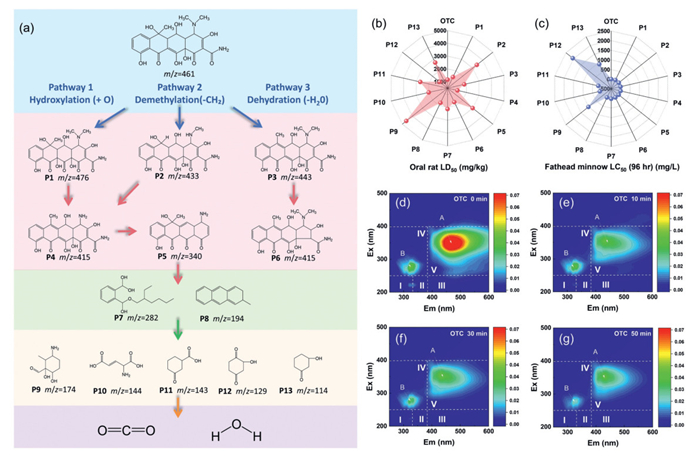
By integrating identified intermediates, Fukui function results, and HPLC-MS data, the potential degradation pathways of OTC in the NOBCBM/PMS system were discussed. Three distinct OTC removal pathways were proposed in Fig. 5a. Pathways 1 and 2 involved hydroxylation and demethylation, leading to the formation of P1 (m/z 476) and P2 (m/z 433), respectively, which was consistent with result of Fukui function. Subsequently, P1 and P2 were transformed into P4 and then P5. In the third pathway, the OTC molecule lost H2O to form P3 (m/z 443), which then underwent decarbonylation to produce P6 (m/z 415). These intermediates further transformed into P7 and P8. Finally, intermediates P9, P10, P11, P12, and P13 were formed and further oxidized to smaller molecules such as CO2 and H2O. The toxicological profiles of OTC and its degradation intermediates, including oral LD50 (rats) and LC50 (blackhead fish), were computationally modeled using T.E.S.T. software (Table S5 in Supporting information). Initial toxicity assessments revealed significant acute risks. OTC exhibited an oral LD50 of 1165.80 mg/kg in rats (Fig. 5b) and an LC50 of 1.12 mg/kg in blackhead fish (Fig. 5c). Post-degradation intermediates demonstrated reduced toxicity, with LD50 and LC50 values exceeding those of parent OTC for most species. Notably, stable intermediates P2, P5, P9-P12 showed markedly diminished toxicity. While developmental toxicity increased for select intermediates (P3, P6, P8), the majority displayed nontoxic characteristics. These findings suggest extended reaction cycles could enhance detoxification, as terminal intermediates exhibit lower toxic potential than initial products.
Figure 5
Figure 5.
(a) LC-MS analysis of OTC degradation products and the possible pathways for OTC degradation in NOBCBM/PMS system. (b, c) Toxicity analysis of OTC and its degradation intermediates. (d–g) Changes of three-dimensional fluorescence during OTC degradation.
Three-dimensional fluorescence techniques were utilized to characterize the degradation of OTC molecules. Fluorescence spectra were classified into five regions: aromatic protein (Ⅰ and Ⅱ), xanthate (Ⅲ), soluble microbial by-product (Ⅳ), and humic acid (Ⅴ) fluorescence. As shown in Figs. 5d–g and Table S6 (Supporting information), the pre-reaction OTC solution displayed dominant fluorescence intensity in the V region, corresponding to humic acid-like substances with molecular structures containing aromatic rings, polycyclic compounds, and functional groups (amide, phenolic hydroxyl, carboxyl) at molecular edges. However, after 50 min of reaction, most fluorescent substances vanished, indicating decomposition of OTC molecules during catalysis. This process involved complete mineralization of benzene rings and carbonyl groups into H2O and CO2.
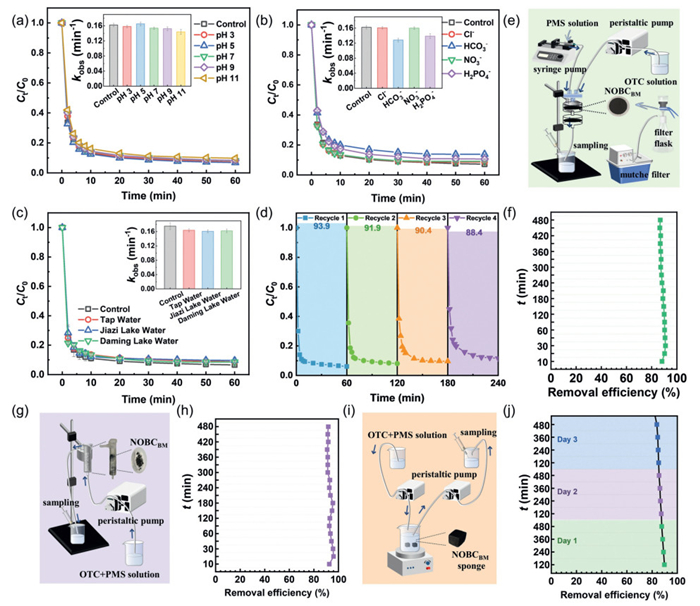
The NOBCBM/PMS system maintained robust OTC degradation efficiency (96%–98%) across pH 3–11 (Fig. 6a). Enhanced activity under acidic conditions (pH 5 vs. 11) correlated with PMS's preferential generation of SO4•− (oxidation potential: 2.5–3.1 V) over •OH in low-pH environments. Alkaline conditions promoted surface-bound •OH formation but reduced overall reactivity. The system's pH resilience stems from its non-radical-dominated mechanism, which minimizes pH sensitivity compared to radical-dependent pathways. In aquatic ecosystems, inorganic anions often react with free radicals, potentially compromising the efficiency of pollutant degradation. To assess their influence, experimental trials were conducted to investigate how coexisting anions affect OTC degradation within the NOBCBM/PMS system. As shown in Fig. 6b, only HCO3− caused minimal inhibition within 30 min, possibly due to its hydrolysis altering solution pH. Other coexisting anions had no significant inhibitory effect, indicating they did not substantially affect efficiency. These results validated the non-radical degradation pathway, aligning with earlier findings and underscoring the system's resilience to anion interference.
Figure 6
Figure 6.
(a) Degradation of OTC at different pH by NOBCBM/PMS system. (b) Degradation of OTC in different anions by NOBCBM/PMS system. (c) Degradation of OTC in different water bodies by NOBCBM/PMS system. (d) Stability tests of NOBCBM under four replicate experiments and removal efficiency. (e) Membrane reactor setup and (f) the degradation efficiency of OTC at different times. (g) Column reactor setup and (h) the degradation efficiency of OTC at different times. (i) Floater reactor setup and (j) the degradation efficiency of OTC at different times.
The system's performance was further evaluated using real water samples (tap water, Jiazi Lake water on campus, and Daming Lake water in the city) to assess interfering substances. As shown in Fig. 6c, OTC degradation efficiency remained high in all samples, confirming the non-radical pathway was dominant and less affected by natural water constituents, ensuring stable removal efficiency. As shown in Fig. 6d, NOBCBM stability was tested over four recycling cycles. The NOBCBM/PMS system maintained 88.4% OTC removal efficiency after four cycles, indicating significant in situ recoverability despite slight performance decline. Catalysts were loaded onto different reactors to systematically investigate the degradation of pollutants by the NOBCBM/PMS system under dynamic flow conditions, simulating real water flow and assessing the impact of reaction time. Detailed schematics of the experimental setups were shown in Figs. 6e, g and i. As shown in Fig. 6f, the NOBCBM/PTFE membrane achieved approximately 90.9% OTC removal, maintaining 86.8% efficiency after 8 h of continuous operation, indicating high stability. The slight efficiency decline may result from uneven thickness and pore size distribution during catalyst loading, causing heterogeneous degradation across different membrane regions. NOBCBM was embedded in absorbent cotton for column experiments. Fig. 6h showed that OTC degradation initially increased to 96.1% as the catalyst-solution contact area expanded. The system retained 91.7% removal efficiency after 8 hours, demonstrating NOBCBM stability and the column's practical potential. Two NOBCBM sponges were placed in a beaker, with PMS-OTC solution pumped in and treated solution pumped out via peristaltic pumps; samples were taken every 120 min. As shown in Fig. 6j, OTC degradation stabilized above 80% over three days, though slightly lower than other reactors, likely due to catalyst detachment from floater movement.
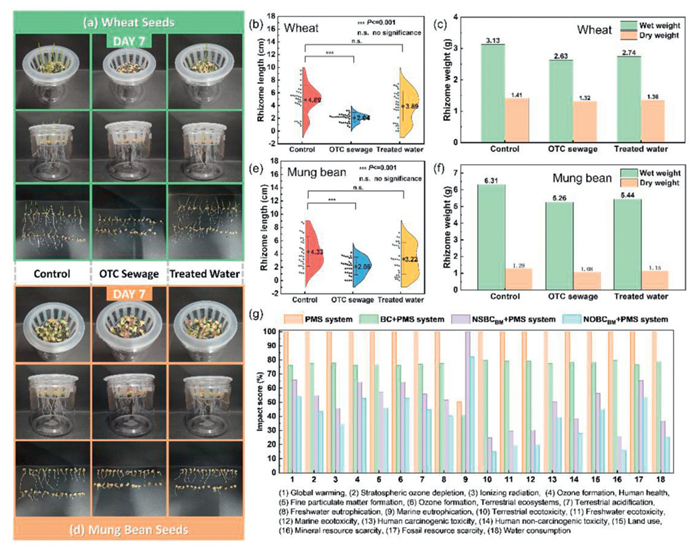
Wheat and mung bean growth experiments evaluated purified water's effects and catalyst eco-safety. Long-term tests assessed NOBCBM/PMS system stability for engineering applications. OTC-contaminated water caused high germination but unhealthy seedlings of wheat (short/yellow/bent stems, death/abnormalities; Fig. 7a, Fig. S8 in Supporting information). Purified water enhanced growth. Rhizome lengths differed significantly between control and contaminated groups, but not control vs. purified (Fig. 7b). Contaminated-group wet weight (2.63 g) was significantly lower; dry weight differences were minor, suggesting impaired water uptake (Fig. 7c). Contaminated water induced stunted growth, weak stems, and deformities of mung bean growth (Fig. 7d, Fig. S9 in Supporting information). Purified water improved plant height/leaf expansion. Rhizome development differed significantly between control and contaminated groups, but not control vs. purified (Fig. 7e). Contaminated-group wet weight (5.26 g) was lower than control (6.31 g); its lowest dry weight indicated biomass disruption, while purified water matched control levels (Fig. 7f). Microbial toxicity assessment revealed higher toxicity and reduced E. coli density in solutions treated with OTC-contaminated water. In contrast, E. coli growth in the NOBCBM/PMS-treated solution matched the control group (Fig. S10 in Supporting information), indicating minimal toxicity from its degradation products. Biochar catalyst/PMS systems had lower environmental impact than PMS alone due to better efficiency, reduced energy, and renewable biomass (Fig. 7g). N/O doping further reduced impacts by enhancing active sites/PMS activation, but increased marine eutrophication risk from nitrogen compounds (e.g., C2H4N4) during pyrolysis.
Figure 7
Figure 7.
The growth status of (a) wheat seeds and (d) mung bean seeds on the 7th day (Column 1: distilled water; Column 2: OTC wastewater; Column 3: purified water); The t-test in the significance analysis of the rhizome lengths of (b) wheat and (e) mung bean grown under different water bodies. The asterisk indicates a significant difference compared with the background group at the 95% confidence level. The rhizome weight of (c) wheat and (f) mung bean plants grown in different water bodies after 7 days. (g) Impact scores of various descriptors in LCA for different systems.
In summary, N/O co-doped biochar (NOBCBM) was synthesized via mechanical ball milling and pyrolysis. SEM, FTIR, and Raman analyses showed NOBCBM had a porous structure with high defect density. Degradation tests revealed NOBCBM removed 94% of OTC (20 mg/L) in 30 min, with a kinetic constant (kobs = 0.1523 min−1) over twice that of NSBCBM (0.0664 min−1). Its high PMS adsorption energy (−3.154 eV) promoted preferential O-site binding, accelerating electron transfer to PMS and generating 1O2. EPR, quenching, and electrochemical experiments confirmed 1O2 and e− as the main reactive species for OTC degradation. DFT calculations showed O-doping increased electrostatic potential, redistributed electron density at doping sites, and enhanced N-doped catalytic activity. LCA indicated favorable environmental performance. Dynamic flow tests on NOBCBM/PTFE membranes and packed columns showed > 90% OTC removal after 8 h of continuous operation. Seven-day plant growth experiments with wheat and mung bean demonstrated significantly higher morphological parameters (plant height, rhizome) in purified water vs. OTC-contaminated water. Statistical analysis showed no differences between purified water and control groups, confirming effective toxicity removal. These results highlight NOBCBM's long-term application potential, ecological safety, and environmental friendliness.
Declaration of competing interest
The authors declare that they have no known competing financial interests or personal relationships that could have appeared to influence the work reported in this paper.
This work was funded by the Department of Science and Technology of Shandong Province (No. 2024TSGC0020), National College Students' Innovation and Entrepreneurship Training Program (202510427012), the National Natural Science Foundation of China (No. 52000087), and Shandong Provincial Natural Science Foundation, China (No. ZR2020QE229).
Supplementary materials
Supplementary material associated with this article can be found, in the online version, at doi:10.1016/j.cclet.2025.111935.
[1]
M. Jangra, D.Y. Travin, E.V. Aleksandrova, et al., Nature 640 (2025) 1022–1030. doi: 10.1038/s41586-025-08723-7
R. Wu, R. Gao, Z. Li, et al., J. Mater. Sci. Technol. 238 (2025) 266–275.
Figure 1
SEM images of (a) NSBCBM, (b) NOBCBM. (c) EDS mapping images of NOBCBM. (d) FTIR patterns of Straw, NSBCBM and NOBCBM. (e) Raman patterns for NSBCBM and NOBCBM. (f) C 1s, (g) N 1s and (h) O 1s XPS spectrum of NSBCBM, NOBCBM.
Figure 2
Degradation of OTC (a) in different O doping ratios and (b) kobs values; Degradation of OTC (c) in different PMS dosage and (d) kobs values. (e) Adsorption of OTC by NOBCBM. (f) Correlations between different PMS dosage and kobs. (g) Normalized kobs comparison of OTC degradation by NOBCBM/PMS at different PMS concentrations. (h) Normalized kobs comparison of OTC degradation by NOBCBM/PMS and other nonmetallic catalyst/PMS systems.
Figure 3
OTC quenching experiment and kobs at PMS concentrations of (a) 0.05, (b) 0.2 and (c) 0.5. (d) EPR spectrums of NOBCBM/PMS systems. (e) Different concentrations of TEMP quench 1O2. (f) Ultraviolet spectrum of DPA-1O2.
Figure 4
(a) Binding of PMS onto different catalyst configurations with different adsorption energies (Eed) and lo-o binding lengths. (b) Electron density distribution of different structures.
Figure 5
(a) LC-MS analysis of OTC degradation products and the possible pathways for OTC degradation in NOBCBM/PMS system. (b, c) Toxicity analysis of OTC and its degradation intermediates. (d–g) Changes of three-dimensional fluorescence during OTC degradation.
Figure 6
(a) Degradation of OTC at different pH by NOBCBM/PMS system. (b) Degradation of OTC in different anions by NOBCBM/PMS system. (c) Degradation of OTC in different water bodies by NOBCBM/PMS system. (d) Stability tests of NOBCBM under four replicate experiments and removal efficiency. (e) Membrane reactor setup and (f) the degradation efficiency of OTC at different times. (g) Column reactor setup and (h) the degradation efficiency of OTC at different times. (i) Floater reactor setup and (j) the degradation efficiency of OTC at different times.
Figure 7
The growth status of (a) wheat seeds and (d) mung bean seeds on the 7th day (Column 1: distilled water; Column 2: OTC wastewater; Column 3: purified water); The t-test in the significance analysis of the rhizome lengths of (b) wheat and (e) mung bean grown under different water bodies. The asterisk indicates a significant difference compared with the background group at the 95% confidence level. The rhizome weight of (c) wheat and (f) mung bean plants grown in different water bodies after 7 days. (g) Impact scores of various descriptors in LCA for different systems.

 DownLoad:

 下载:
下载:


 下载:
下载:
