School of Chemical & Biomedical Engineering, Nanyang Technological University, Singapore 637459, Singapore
b.
Institute of Sustainability for Chemicals, Energy, and Environment (ISCE2), Agency for Science, Technology, and Research (A*STAR), Jurong Island 627833, Singapore
Received Date:
24 May 2025 Accepted Date:
29 September 2025 Revised Date:
19 August 2025 Available Online:
15 May 2026
Abstract:
Non-noble metal catalysts have garnered significant attention as sustainable alternatives to precious metal catalysts for the abatement of hydrocarbon emissions and mitigating environmental pollution. In this study, we employed an in-situ exsolution strategy coupled with oxidation stabilization to engineer the surface of cobalt-doped LaFeO3-δ catalysts, successfully extending their application in an oxygen-rich scenario. The formed unique socket-like structure facilitates the exposure of highly reactive CoOx particles with superior homogeneity in both size and distribution. The optimized catalyst, CoOx@LFCO-3, achieved 90% toluene conversion at a notably lower temperature of 237 ℃ with a space velocity of 20,000 mL g−1 h−1. Mechanistic studies revealed that the enhanced interaction between exsolved cobalt oxides and the perovskite support, along with abundant active sites, significantly improved the catalyst's performance in low-temperature toluene oxidation. This work presents a scalable approach for developing cost-effective, high-performance perovskite oxide catalysts for environmental applications.
The emission of volatile organic compounds (VOCs) poses a significant threat to both environmental sustainability and public health, especially in industrialized regions [1–3]. In recent years, more stringent strategies have been implemented globally to mitigate environmental pollution [4]. Among the various strategies for VOC mitigation, catalytic oxidation has emerged as an optimal solution due to its energy efficiency and environmental friendliness [5,6]. Although noble metal catalysts have demonstrated excellent performance in VOC elimination, their high cost and poor stability limit their lifespan and practical application [7,8]. Take platinum (Pt) as an example, its latest unit price has exceeded 1200 USD/t.oz, which is over 400,000 times higher than that of iron (63.5% Fe-content iron ore), and 1100 times higher than that of cobalt [9]. Consequently, the development of alternative catalysts demonstrating exceptional catalytic performance, long-term operational stability, and economic viability is critical to mitigate the constraints of noble metal-based catalysts. In recent years, perovskite oxide catalysts have gained increasing attention as a promising alternative due to their superior thermal stability, resistance to poisoning, and excellent oxygen mobility [10,11]. However, despite their advantages, these catalysts often exhibit low activity, primarily due to the high synthesis temperatures, which could lead to surface segregation, limited surface area, etc. Strategies like acid etching, doping, and morphology engineering have been developed to overcome these limitations [12–16]. Although these strategies can enhance the catalytic activity of the studied catalysts to some extent, each comes with certain limitations. For instance, excessive use of acids can lead to challenges in wastewater treatment; doping is constrained by solubility and ionic radius considerations; and catalysts with different morphology often face scalability issues in practical application. Most importantly, this persistent performance gap underscores the urgent need for more effective catalyst design strategies to achieve commercially viable activity levels.
Recently, element exsolution has emerged as an effective strategy to construct uniformly distributed nanoscale active sites on catalysts, gaining significant attention. For example, Neagu et al. demonstrated that the socketed nickel particles exsolved from La0.4Sr0.4NiyTi1−yO3−y catalysts enhanced the particle-support interaction, leading to more stable reforming catalytic activity and lower carbon deposition compared to traditionally deposited catalysts [17]. Ding et al. studied the Ni-Fe exsolved particles on perovskite oxide, revealing that the unique structure exhibited superior electrochemical performance [18]. Similarly, Kim and co-workers investigated nanoparticle exsolution in perovskite oxide SrGdNixMn1–xO4±δ for solid oxide fuel cells (SOFCs), demonstrating excellent redox properties and high stability [19]. Lindenthal et al. examined the exsolution phenomenon in Nd0.6Ca0.4Fe0.9Co0.1O3-δ for reverse water-gas shift reaction (RWGS), showing that the unique heterojunction structure boosted reactivity, accompanied by an increase in oxygen vacancies and interface boundaries [20]. These studies show that the unique heterojunction structure formed through exsolution can introduce additional active sites and defects, thereby promoting catalytic activity, optimizing the reaction process, and reducing deactivation. However, most existing research has focused on reductive or inert atmospheres where catalysts primarily exist as metals or alloys [21–23]. In contrast, there have been few reports on the development of stable active sites via in-situ exsolution for use in oxidizing atmospheres. Considering the inherent instability of the exsolved metal phase in an oxidative environment and the limited active sites, the key challenge lies in stabilizing the structure while maximizing the exposure of the active sites.
To address these challenges, nano-socketed cobalt oxide over perovskite oxide LaFeO3-δ catalysts were synthesized using an in-situ exsolution strategy followed by oxidation stabilization in this work. The approach enables the creation of abundant interfaces and defects, increasing the number of active sites and enhancing reactivity for low-temperature toluene oxidation. Transmission electron microscope (TEM) and scanning electron microscope (SEM) observation show the socket structure and tight connection between exsolved CoOx particles and the support. Reducibility test by H2-temperature programmed reduction (H2-TPR) and structural analysis at the atomic level by X-ray absorption spectroscopy (XAS) further verified the enhanced oxygen mobility and stronger electron transfer between exsolved CoOx particles and the perovskite oxide matrix. In-situ diffuse reflectance infrared Fourier transform spectroscopy (DRIFTS) observation shows that the exsolved sample could boost the elimination of key intermediates and accelerate the rate-determining step of the reaction. The superior catalytic performance demonstrates the successful extension of its applicability beyond inert or reductive atmospheres. This work opens new avenues for designing perovskite oxide-based catalysts with lower costs and accelerating their adoption in practical industrial applications, such as the petrochemical industry, pharmaceutical manufacturing, and more.
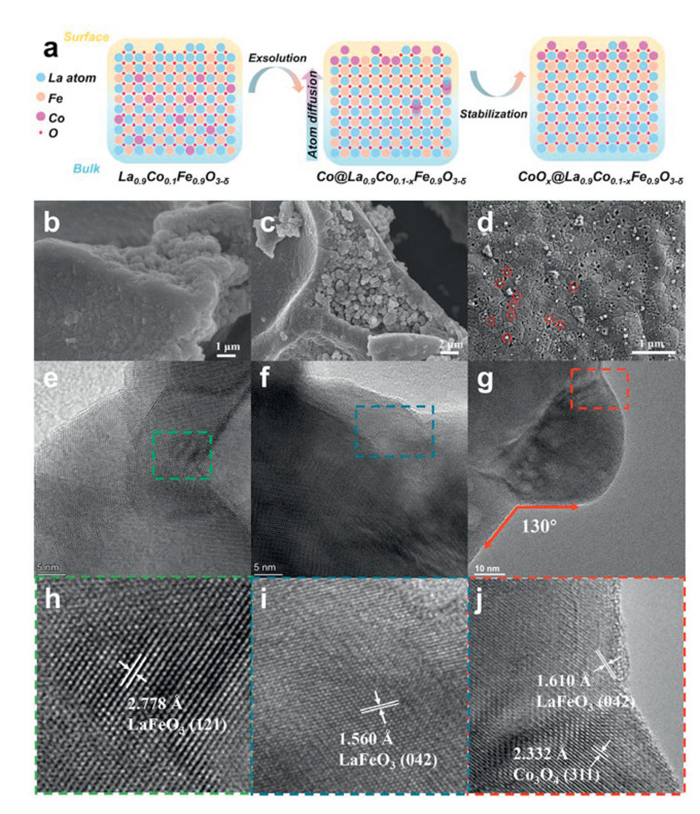
The exsolution process is illustrated in Fig. 1a, consisting of two steps. Firstly, the cobalt-doped LaFeO3-δ catalysts are treated under a reductive environment, and cobalt exsolves from the bulk to the surface. Then, the exsolved particles undergo a stabilization process in an oxidizing environment, resulting in the formation of the final catalyst. This approach leads to the homogenous formation of high-activity nanoscale CoOx particles anchored onto the perovskite oxide support. Considering A-site deficiency perovskite oxide is more active and prone to exsolving B-site cation, La-defective perovskites La0.9CoxFe1-xO3-δ (0.1 ≤ x ≤ 0.3) are chosen for the study [15,24]. The SEM images of pristine perovskite oxides, loaded samples, and exsolved samples are presented in Figs. 1b-d, and Figs. S1-S3 (Supporting information). Exsolution treatment led to the formation of uniformly sized CoOx particles, evenly distributed on the perovskite surface (Fig. 1d), with particle growth correlating with increased cobalt content (Figs. S4-S6 in Supporting information). Specifically, at a cobalt doping ratio of 10%, the particle size is approximately 38.3 nm. As the cobalt content increases, the particle size grows to about 51.0 nm with 20% cobalt. Further increase to a 30% doping ratio results in a slight growth in particle size, reaching approximately 54.2 nm. Fig. S3 presents the cobalt oxide-loaded LFO catalysts via the incipient wetness impregnation method, revealing a relatively irregular surface particle distribution. Statistical analysis indicates the average diameter of the loaded cobalt oxide is larger than that of the exsolved sample with comparable cobalt content. This increase in particle size may result from the low specific surface area of the LaFeO3-δ support (9.4 m2/g), which hinders effective dispersion and promotes particle aggregation and growth. This observation underscores the advantages of the in-situ exsolution process in achieving more uniform distribution and smaller particles.
Figure 1
Figure 1.
(a) Schematic of cobalt in-situ exsolution route proposed here over perovskite oxide LaFeO3-δ under reductive and oxidation environment. SEM image of pristine and treated samples: (b) LFO, (c) LFCO-1, (d) CoOx@LFCO-1. TEM images of sample (e, h) LFO, (f, i) LFCO-1, (g, j) CoOx@LFCO-1.
The high resolution transmission electron microscope (HR-TEM) images of as-prepared catalysts (LFO, LFCO-1, and CoOx@LFCO-1) are shown in Figs. 1e-j. The interplanar d spacing of LFO is measured at approximately 2.778 Å, which coincides well with the indexed (121) facet of LaFeO3. For the cobalt-doped LFCO-1 catalyst (Figs. 1f and i), a slight decrease in lattice distance was observed, with a crystal face of 1.560 Å (042). This reduction in lattice distance could be attributed to the crystal shrinkage caused by cobalt doping. After exsolution, the exsolved particles are observed to be anchored on the support (Fig. 1g). The magnified image in Fig. 1j reveals that the exsolved particles are composed of Co3O4. The d-spacing of the adjacent area in the support is about 1.610 Å, which is higher than that of the catalyst LFCO-1. The change in lattice dimensions supports the observation of lattice expansion following cobalt exsolution. Additionally, the exsolved particles exist in an anchored contact with a contact angle of around 130°, indicating a socket-like interaction rather than a tangent contact between two particles, which has limited interaction in between. This structure suggests a more robust bonding between the exsolved particles and the support. In terms of the exsolution process, the formation of such an anchored particle involves diffusion, reduction, nucleation, and growth. In a reductive environment, the cobalt would undergo these processes, "growing" from the substrate in a socket-like manner. Such a growth way would facilitate the establishment of a strong interaction [25,26]. Furthermore, the thermodynamics analysis (Fig. S9 in Supporting information) shows that La2O3 and Fe2O3 reduction have relatively larger Gibbs free energy than that of Co3O4, suggesting that cobalt oxide is easier to reduce and exsolve.
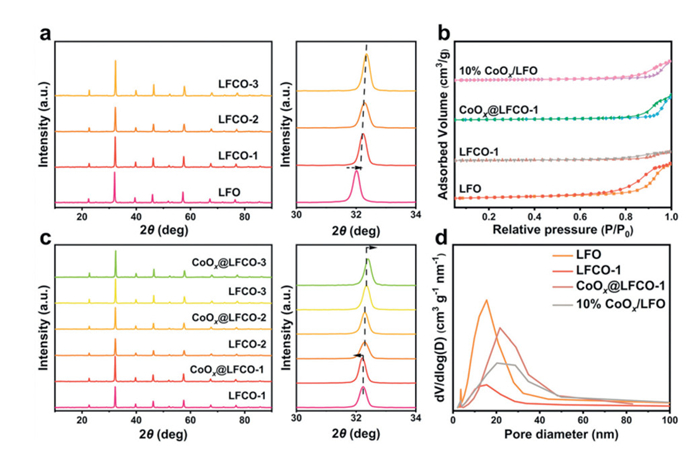
Fig. 2a shows the X-ray diffraction (XRD) patterns of LFO and all LFCO-x (1 ≤ x ≤ 3) catalysts, which exhibit similar characteristic peaks consistent with the reference pattern LaFeO3 (PDF #88-0641). It has been reported that in a typical ABO3 perovskite oxide structure, iron ions are predominantly in the high-spin (hs) state, and cobalt ions are in the low-spin (ls) state under ambient conditions. This difference in spin states results in a significant disparity in ionic radii, with Fe3+ (hs) having a radius of 78.5 pm and Co3+ (ls) having a radius of 68.5 pm [27]. Consequently, the observed shift of the primary XRD peak toward higher angles suggests lattice contraction following cobalt doping. The positive correlation between the doping amount and peak shift further confirms the effective substitution of iron by cobalt in the LaFeO3 lattice. Following in-situ exsolution treatment, all the samples retained the same diffraction peaks as their pristine counterparts, though noticeable peak shifts were observed in Fig. 2c. For CoOx@LFCO-1, the diffraction peaks shift slightly to lower angles, indicating effective cobalt exsolution [28]. Interestingly, as the cobalt doping ratio increases, the peak shift trend in exsolved samples reverses compared to CoOx@LFCO-1. Specifically, no peak shift is detected for LFCO-2 before and after exsolution. When the doping ratio reaches 0.3, the diffraction peak shifts to higher angle values, suggesting that the exsolution of massive cobalt could induce noticeable lattice distortion, coupled with significant lattice contraction [29]. Notably, no distinct peaks assigned to metallic cobalt or cobalt oxide were detected in the XRD profile of the in-situ exsolved samples, likely due to the low crystallinity, high dispersion, and limited content of the exsolved cobalt species, as corroborated by the SEM analysis [30].
Figure 2
Figure 2.
XRD profiles (a) of pristine LFCO-x catalysts and (c) corresponding exsolved samples (1 ≤ x ≤ 3 with amplification of the main peak). (b) N2 adsorption-desorption isothermal curves and (d) pore size distribution of as-prepared catalysts.
The adsorption-desorption curves accompanied by pore size distribution are shown in Figs. 2b and d. The observed hysteresis loop within the relative pressure range of 0.8-1.0 confirms the presence of mesopore structure within these studied perovskite oxides [31,32]. Upon doping with cobalt, a noticeable reduction in the hysteresis loop indicates the corresponding decrease in pore volume and surface area accordingly. After the exsolution treatment, the samples exhibit a more prominent hysteresis loop, which suggests an increase in specific surface area relative to the cobalt-doped sample. In contrast, the 10% CoOx/LFO sample possesses a smaller hysteresis loop at the high relative pressure range, indicating that some pores might be blocked after impregnation. This trend in specific surface area is also reflected in the pore size distribution, shown in Fig. 2d. The pristine catalyst LFO is composed primarily of mesopores with an average pore size below 13 nm. Upon cobalt oxide loading, a significant increase in average pore size is observed (18 nm), but with low pore volume. Notably, the exsolved sample (CoOx@LFCO-1) exhibits a slightly higher pore volume and specific surface area compared to both the cobalt-doped and cobalt-loaded LFO catalysts, and this may be due to the uniform dispersion of exsolved cobalt particles over the surface, which results in a larger exposed surface area and prevents the pore-blocking issues by conventional impregnation method.
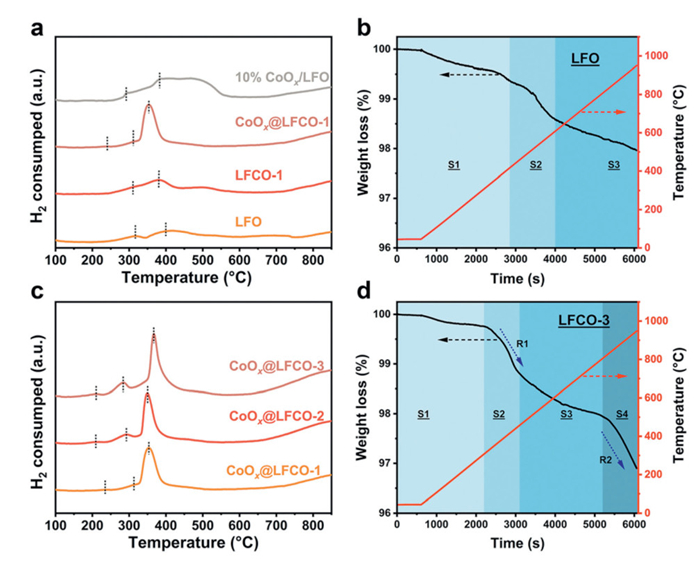
The reducibility of the studied catalysts was evaluated via H2-TPR, and the results are shown in Figs. 3a and c. Over the catalyst LFO, two main peaks at approximately 316 ℃ and 399 ℃ are attributed to the reduction of surface adsorption oxygen species and Fe4+ to Fe3+, respectively, and the reduction behavior occurring above 550 ℃ is related to the further reduction of Fe3+ [33–35]. After doping with cobalt, these peaks shift to lower positions at 309 ℃ and 379 ℃, demonstrating a facilitated reduction process and enhanced oxygen mobility. The in-situ exsolved samples exhibit a distinct reduction behavior compared to both the pristine and cobalt-doped LFO catalysts. Simultaneously, a new peak emerged at approximately 210 ℃, which may correspond to the reduction of the surface exsolved particles. Fig. 3c shows that as the cobalt doping amount increases from 0.1 to 0.3 (molar ratio of Co/(Fe+Co)), the reduction peaks shift to even lower temperatures. This shift may be attributed to the increase in interfaces resulting from more cobalt exsolution, corresponding to the intensity enhancement of the second peak. The third peak corresponds to the reduction of Co2+ to Co0 and partial Fe4+ to Fe3+. Furthermore, the higher peak intensity between 200 ℃ to 400 ℃ compared to the pristine LFO and 10% CoOx/LFO catalysts suggests more active species or better oxygen mobility of the in-situ exsolved particles [36]. The improvement could likely stem from the unique heterostructure and strong particle-support interaction, which enhance electron transfer and enable accelerated reduction at low temperatures. Although the 10% CoOx/LFO sample exhibits a higher initial reduction peak intensity than the pristine LFCO-1 sample, the increased peak area, without a notable peak shift, indicates weak interfacial interaction and limited oxygen transfer, as compared to the LFO and Co3O4 reference profile shown in Fig. S12 (Supporting information) [37]. Overall, the exsolved samples possess better reducibility, highlighting the advantages of the in-situ exsolution approach in enhancing redox properties through the creation of a unique heterojunction structure [38]. To further characterize the redox ability of the studied catalysts, O2-TPD test was performed, and the results are shown in Fig. S13 (Supporting information). The first peak, centered at ca. 90 ℃, may come from the desorption of the physically adsorbed oxygen species. The lack of characteristic peak between 200 ℃ and 400 ℃ indicates the low content of surface adsorbed oxygen species, which may be limited by the low surface area and intrinsic properties of LaFeO3 type sample, although exsolved one shows higher signal intensity than that of doped and loaded one. It is worth noting that, another evolution of oxygen, take places between 450 ℃ and 600 ℃, indicating the desorption of lattice oxygen. Compared to the profile of sample LFO, the detected oxygen species should mainly come from surface cobalt oxide species. The higher intensity and widened peak demonstrated the supreme oxygen mobility of exsolved catalysts and strong interaction between exsolved CoOx species and perovskite oxide matrix [39]. Hence, it is not hard to conclude that the exsolved sample possess higher redox ability than that of other samples.
Figure 3
Figure 3.
H2-TPR profiles of (a) pristine, exsolved, and loaded catalysts, including LFO, LFCO-1, CoOx@LFCO-1, 10% CoOx/LFO, and (c) CoOx@LFCO-1, CoOx@LFCO-2, and CoOx@LFCO-3. TGA analysis of (b) LFO and (d) LFCO-3 under reductive atmosphere 5% H2/N2.
To gain insight into the exsolution process, thermal gravimetric analyzer (TGA) experiments were performed to investigate the dynamic changes that occur during the exsolution process. As shown in Fig. 3b, the reduction process over LFO demonstrates a gradual oxygen release, with an overall weight loss of approximately 2.02 wt%. The reduction process could be divided into three stages, as labeled in the profile. Stage 1: Weight loss due to the desorption of physically adsorbed species on the surface, such as O2, CO2, and H2O. Stage 2: At around 400 ℃, surface lattice oxygen consumption. Stage 3: Continuous and slow weight loss related to the release of the sub-surface and partial lattice oxygen in the bulk. The actual weight loss is far below the theoretical value of 9.89 wt% (Fe3+ to Fe0), indicating the superior structural stability of ABO3 perovskite oxide and the difficulty of reducing iron under 900 ℃. Following the doping of cobalt, the reduction process could be divided into 4 stages, accompanied by the exsolution of cobalt with temperature (Stage 4). The overall weight loss reaches 3.11%, reflecting the improved redox properties and more active oxygen over the cobalt-doped catalysts (Fig. 3d). To further understand the weight change, the reduction process of LCO (LaCoO3) was also carried out and shown in Fig. S10 (Supporting information). The weight loss rates (R1 and R2) for the LCO sample are significantly higher than those of LFCO-3 catalysts, accompanied by a lower initial reduction temperature of Stage 4. In contrast to LCO, the delayed and slower reduction process of LFCO-3 suggests the strong electron transfer between B-site cations (cobalt and iron atoms).
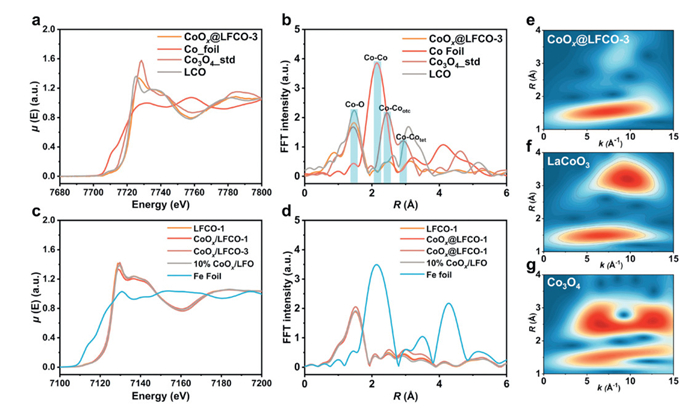
The X-ray absorption near-edge structure (XANES) spectra at the Co K-edge and Fe K-edge were collected and compared. As shown in Fig. 4a, the spectrum of the exsolved sample differs notably from those of Co3O4 and LaCoO3, highlighting a distinct configuration. The higher energy position of the absorption pre-edge for CoOx@LFCO-3 suggests a higher average oxidation state of cobalt than that of Co3O4 [40]. The pre-edge absorption at around 7709 eV, attributed to the quadrupolar 1s → 3d transitions, reflects the coordination geometry of cobalt, and corresponds transitions to the anti-bonding t2g* and eg* orbitals of cobalt [41]. The reduced intensity and shifted position of the pre-edge feature in CoOx@LFCO-3, compared to Co3O4 and LaCoO3, indicate that the exsolved cobalt atoms mainly occupy high-symmetry, octahedral coordination environments, possibly with more Co3+ in a high-spin state [42]. Then, the extended X-ray absorption fine structure (EXAFS) was transformed via R-space Fourier-transformed and shown in Fig. 4b. The first Co–O shell of the CoOx@LFCO-3 sample is located at a greater distance compared to that of Co3O4 (R = 1.44 Å), and it could be related to the structural distortion at the interface and the lattice mismatch [43]. The intensity of the Co-Co shell (2nd Co-Co: 2.47 Å, and 3rd Co-Co: 3.13 Å) is much lower in CoOx@LFCO-3 when compared to that of the Co3O4 and LaCoO3. This could be due to electron back-scattering from the LFCO matrix, highlighting the strong interaction between exsolved cobalt oxide and the perovskite support [44]. To help distinguish the backscattering atoms, the wavelet transforms were employed as a great supplement to the Fourier transforms conducted in R- and k-space (Figs. 4e-g). The peaks in the wavelet transform at 1.54 Å−1, correspond to the Co-O coordination, while a weaker peak at 3.26 Å with a lower k value (8.67 Å−1) compared to LCO (R = 3.18 Å and k = 9.65 Å−1) is partially contributed by Co-Fe bonds at the interface between exsolved particles and the perovskite oxide substrate. Furthermore, analysis of the Fe K-edge was also provided in Figs. 4c and d. No significant structural difference was observed after exsolution, except for minor differences in coordination environments. This phenomenon further supports the stability of perovskite oxide LaFeO3-δ.
Figure 4
Figure 4.
(a) Co K-edge XANES spectra, (b) Co K-edge EXAFS k3χ(k) spectra, (c) Fe K-edge XANES spectra, and (d) Fe K-edge EXAFS k3χ(k) spectra of catalyst CoOx@LFCO-3, Co foil, Co3O4, and LCO. Wavelet transforms for the k3-weighted EXAFS signals of Co K-edge in (e) CoOx@LFCO-3, (f) LaCoO3, and (g) Co3O4 for comparison.
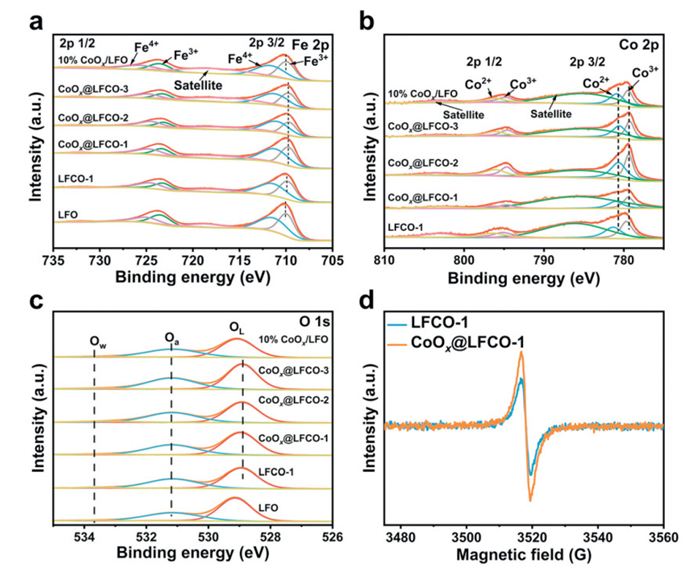
The valence state of the studied catalysts is characterized by X-ray photoelectron spectroscopy (XPS), providing insights into the chemical environment and surface interactions. Since the non-stoichiometric La0.9FeO3-δ catalysts are adopted, the average valence of Fe would increase accordingly to maintain charge neutrality. Fig. 5a presents the Fe 2p spectra, where peaks at approximately 709.9 and 723.4 eV correspond to Fe3+, and peaks at around 711.3 and 724.9 eV are attributed to Fe4+ [33,45,46]. The molar ratio of surface Fe4+/Fe3+ was summarized in Table 1. It was observed that cobalt doping led to an increased presence of Fe3+, whereas the Fe3+ content significantly decreased following cobalt exsolution. Considering the exsolution of cobalt was conducted under a reductive environment, more cobalt detaches from its original location, and it may facilitate the generation of more Fe4+ to maintain electrical neutrality. Thus, the introduction and exsolution of cobalt would change the electron transfer between the iron atom and the adjacent oxygen atoms accordingly. Fig. 5b shows the Co 2p spectra for both surface-reconstructed and pristine samples. The peaks at ~779.7 and ~795.1 correspond to Co3+; The peaks at ~781.3 eV and ~796.6 eV correspond to Co2+ in Co 2p. The remaining two peaks at ~784.9 eV and ~803.3 eV correspond to the satellite peaks of Co 3p3/2 and 3p1/2. Compared to all the pristine LFCO samples, the binding energy of both Co3+ and Co2+ of the exsolved samples shifts to lower peak positions. These shifts are indicative of a weakening of the Co-O bond after exsolution, thereby improving the reactivity of surface oxygen vacancies [47–49]. The O 1s spectra in Fig. 5c were also deconvoluted to identify and quantify the different surface oxygen species. Three characteristic peaks, located at ~529.1, ~531.1, and ~533.6 eV were observed, which represent surface lattice oxygen (Olatt: O2−), adsorbed oxygen species (Oads: O2−, O− and O22−), and adsorbed molecular water or hydroxyl group, respectively [50]. It has been reported that the existing adsorbed oxygen is associated with surface oxygen vacancies. After doping with cobalt, the studied catalysts possess more surface-adsorbed oxygen species as compared to catalyst LFO. Following further exsolution treatment, an even higher content of surface-adsorbed oxygen species was observed, suggesting that more defects were generated after cobalt exsolution. To confirm the presence of surface oxygen vacancies generated by the in-situ exsolution method, the electron paramagnetic resonance (EPR) test was employed to probe oxygen vacancies, as oxygen vacancies in metal oxides could lead to the generation of detectable unpaired electrons [51,52]. As shown in Fig. 5d, the EPR spectrum of the catalysts reveals a symmetrical peak located at g = 2.001, which is indicative of the presence of oxygen vacancies in the materials [53]. The exsolved sample, CoOx@LFCO-1, exhibits a significantly higher intensity at g = 2.001 compared to the pristine sample LFCO-1, indicating the formation of more oxygen vacancies following cobalt exsolution [54]. Combined with TEM and SEM analysis, it is likely that these defects arise from the migration of cobalt atoms from the bulk to the surface, disrupting the lattice structure and creating massive vacancies at the interface between the exsolved cobalt particles and the perovskite oxide matrix.
Figure 5
Figure 5.
(a) Fe 2p, (b) Co 2p, and (c) O 1s XPS profiles of studied catalysts. (d) The EPR spectra of the pristine catalyst LFCO-1 and cobalt exsolved catalyst CoOx@LFCO-1.
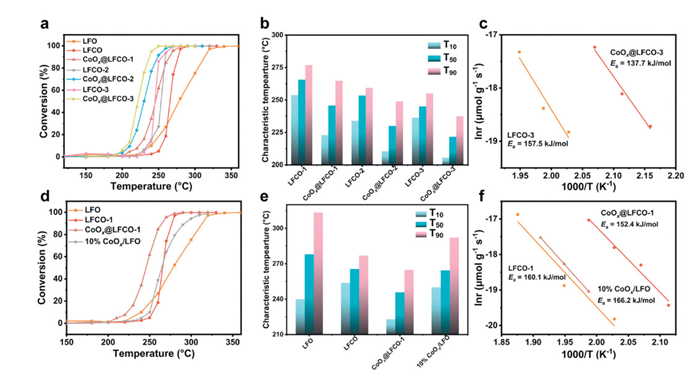
Fig. 6 displays the toluene oxidation activities over the studied catalysts. Overall, Co-doped LFO catalysts exhibit better reactivity than the pristine LFO catalysts. As shown in Fig. S14 (Supporting information), the performance improvement stabilizes as the doping ratio reaches 0.3. Compared with the pristine LFO catalysts, the characteristic temperature T50 and T90 values of the LFCO-3 catalyst decrease by 33.0, and 58.5 ℃, respectively. No by-products were detected throughout the toluene oxidation process, indicating complete conversion. Similarly, all the exsolved catalysts exhibit superior catalytic performance relative to the cobalt-doped LFO catalysts. The CoOx@LFCO-3 catalyst achieved a remarkable T90 value of 237.5 ℃, which is 17.4 and 75.9 ℃ lower than that of catalysts LFCO-3 and LFO, respectively. Notably, the performance could not achieve higher performance when the doping ratio is at 0.3, but the exsolution operation could further help enhance the reactivity across the board. The calculated apparent activation energy of sample CoOx@LFCO-3, which is 137.7 kJ/mol, is much lower than that of the pristine LFCO-3 (157.5 kJ/mol). Furthermore, the activity of the loaded one (10% CoOx/LFO) was evaluated, showing higher reactivity at the low temperature range than that of LFO and LFCO-1. This could be due to the exposure of highly active cobalt oxide over the surface. However, its performance remains inferior to that of the exsolved catalysts CoOx@LFCO-1. In addition, the catalytic performance of some reported catalysts was summarized in Table S3 (Supporting information). The CoOx@LFCO-3 catalyst demonstrates outstanding activity in toluene catalytic oxidation, especially when compared with other reported perovskite oxide catalysts. Combined with the above characterization analysis, the main reason for the higher activity could be attributed to the abundance of exposed, highly homogeneous reactive cobalt oxide and active oxygen species generated by in-situ exsolution.
Figure 6
Figure 6.
(a) The light-off curves and (c) characteristic temperature of studied catalysts (LFO, LFCO-1, CoOx@LFCO-1, LFCO-2, CoOx@LFCO-2, LFCO-3, CoOx@LFCO-3). (b) Activation energy of sample LFCO-3 and CoOx@LFCO-3. (d) The light-off curves, and (e) characteristic temperature of catalyst LFO, LFCO, CoOx@LFCO-1, and 10% CoOx/LFO. (f) Activation energy of sample LFCO and CoOx@LFCO-1, and 10% CoOx/LFO.
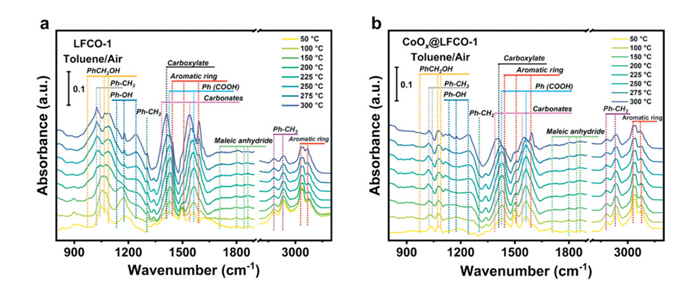
The in-situ DRIFTS spectra of toluene oxidation are shown in Figs. 7a and b. The bands at around 2937, 3070, 3083, and 3030 cm−1 correspond to the stretching and bending of C-H groups in aromatic rings [55], and the bands at 1599 and 1498 cm−1 belong to the stretching skeleton vibration of aromatic rings [56]. The above-observed bands indicate that toluene was adsorbed over the surface of the studied catalysts. Then the bands at 2878 and 2934 cm−1 were assigned to the symmetric and asymmetric stretching vibration of methylene, while the bands at 983, 1069, and 1087 cm−1 are ascribed to alkoxide species (C-O stretching vibration), symbolizing the formation of benzyl alcohol species [57]. It is worth noting that the bands of 1430, 1542, and 1564 cm−1, which indicate the presence of benzoate species, were detected, demonstrating the further oxidation of toluene. Concurrently, the emergence of bands between 1700 cm−1 and 1900 cm−1 signifies the generation of maleate acid, corresponding to the ring-opening of toluene molecules. The relatively lower signal response for this intermediate suggests that it is unstable and can be easily further oxidized. Then, the bands related to carbonates and carboxylate species at 1384 and 1413 cm−1 increase with temperature, demonstrating the accumulation of carbonate species on the catalyst surface [58]. The separation distance of ~129 cm−1 indicates that the carboxylate species are arranged in a bridging bidentate manner. These phenomena suggest that benzoate underwent further oxidation, resulting in the breaking of the benzene ring.
Figure 7
Figure 7.In-situ DRIFTS spectra of toluene oxidation over (a) LFCO-1, and (b) CoOx@LFCO-1.
Based on the aforementioned analysis, the catalytic oxidation of toluene may follow the suggested pathway: Firstly, toluene is adsorbed on the surface, and oxidized to benzyl alcohol, and benzoate by the surface-active oxygen species accordingly. Then, more benzene ring began to break and be oxidized to carboxylate species with temperature. At last, the intermediates were completed oxidized to CO2 and H2O molecules. By comparing the spectra of pristine LFCO-1 and CoOx@LFCO-1, the stronger signal of benzyl alcohol, benzoic acid, etc. over catalyst LFCO-1 indicates that the benzene ring-opening could be the rate-determining step of toluene catalytic oxidation. The lack of enough active sites or the low activity of catalyst LFCO-1 could not further oxidize it, causing its accumulation over the catalyst surface. Conversely, the weaker signal of these peaks over exsolved sample CoOx@LFCO-1 indicates that the highly active exsolved particles could facilitate the stable benzene ring cleavage and accelerate the conversion of these intermediates to carbonates or carbon dioxide further. Hence, the epitaxially anchored CoOx nanoparticles on LaFeO3 support demonstrate superior catalytic activity, likely serving as the predominant active promoter, especially for the benzene ring-opening.
In summary, by further oxidative stabilization of the surface exsolved particles, the CoOx@LFCO heterostructure catalysts exhibit superior catalytic performance for toluene oxidation. At high temperatures and reductive conditions, lattice cobalt diffuses and exsolves, forming uniformly distributed cobalt nanoparticles that create a socket-like heterostructure. This structure promotes strong interactions between the exsolved CoOx nanoparticles and the perovskite substrate, enhancing electron transfer and defect generation. Characterizations, including EPR, H2-TPR, XPS, XAS, and in-situ DRIFTS, confirmed the presence of more oxygen vacancies, improved reducibility, and more active sites in the socketed structure catalysts. Compared with pristine, cobalt-loaded, and -doped LaFeO3-δ catalysts, the exsolved sample achieves higher toluene conversion at lower temperatures under 20,000 mL g−1 h−1 and 1000 PPM toluene. Notably, while the catalytic performance of pure perovskite oxide plateaus at a cobalt molar ratio of 0.3, the exsolution strategy unlocks additional potential in these materials. Specifically, the CoOx@LFCO-3 achieved the 90% conversion of toluene at 237.5 ℃, nearly 80 ℃ lower than that required by pristine LaFeO3-δ catalysts. Given the effectiveness and simplicity of the exsolution approach, this strategy holds significant promise for practical applications in catalysis.
Declaration of competing interest
The authors declare that they have no known competing financial interests or personal relationships that could have appeared to influence the work reported in this paper.
S. Sun, G. Li, S. Zhu, et al., J. Mater. Chem. A 12 (2024) 17463–17470. doi: 10.1039/d4ta01645a
[37]
J. Yao, F. Dong, H. Feng, et al., ACS Appl. Nano Mater. 4 (2021) 9322–9332. doi: 10.1021/acsanm.1c01799
[38]
Y. Wang, D. Yang, S. Li, et al., Chem. Eng. J. 357 (2019) 258–268. doi: 10.1002/cctc.201801222
[39]
N.A. Merino, B.P. Barbero, P. Grange, et al., J. Catal. 231 (2005) 232–244. doi: 10.1016/j.jcat.2005.01.003
[40]
F.T. Haase, A. Bergmann, T.E. Jones, et al., Nat. Energy 7 (2022) 765–773. doi: 10.1038/s41560-022-01083-w
[41]
O. Haas, C. Ludwig, U. Bergmann, et al., J. Solid State Chem. 184 (2011) 3163–3171.
[42]
J. Zhu, Z. Zeng, W.X. Li, J. Phys. Chem. C 125 (2021) 26229–26239. doi: 10.1021/acs.jpcc.1c08461
[43]
X. Wang, Z. Pan, X. Chu, et al., Angew. Chem. Int. Ed. 58 (2019) 11720–11725. doi: 10.1002/anie.201905543
[44]
H. Zhang, G. Guo, Z. Wang, et al., Appl. Catal. B: Environ. 333 (2023) 122774.
[45]
Z. Shen, Y. Zhuang, W. Li, et al., J. Mater. Chem. A 8 (2020) 4407–4415. doi: 10.1039/c9ta13313e
[46]
Z. Lu, J. Shen, J. Zou, et al., Phys. Status Solidi Basic Res. 260 (2023) 2200511. doi: 10.1002/pssb.202200511
[47]
Y. Shen, J. Deng, S. Impeng, et al., Environ. Sci. Technol. 54 (2020) 10342–10350. doi: 10.1021/acs.est.0c02680
[48]
L. Zhou, C. Wang, Y. Li, et al., Chin. Chem. Lett. 34 (2023) 107605.
[49]
F. Wang, Y. Wang, J. Zou, et al., Appl. Surf. Sci. 698 (2025) 163091.
[50]
S. Das, S. Bhattar, L. Liu, et al., ACS Catal. 10 (2020) 12466–12486. doi: 10.1021/acscatal.0c01229
[51]
M. Wu, J. Sun, W. Xiang, et al., J. Environ. Chem. Eng. 10 (2022) 108734.
[52]
D. Sui, R. Luo, S. Xie, et al., Chem. Eng. J. 480 (2024) 148007.
[53]
M. Wu, H. Li, S. Ma, et al., Sci. Total Environ. 795 (2021) 148904.
[54]
J. Yang, W. Xiao, X. Chi, et al., Appl. Catal. B: Environ. 265 (2020) 118469.
[55]
S. Besselmann, E. Löffler, M. Muhler, J. Mol. Catal. A: Chem. 162 (2000) 401–411.
[56]
Y. Zhang, C. Wu, Z. Wang, et al., Appl. Surf. Sci. 580 (2022) 152278.
[57]
Y. Xu, Z. Qu, Y. Ren, et al., Appl. Surf. Sci. 560 (2021) 149983.
[58]
W. Tang, J. Weng, X. Lu, et al., Appl. Catal. B: Environ. 256 (2019) 117859.
Figure 1
(a) Schematic of cobalt in-situ exsolution route proposed here over perovskite oxide LaFeO3-δ under reductive and oxidation environment. SEM image of pristine and treated samples: (b) LFO, (c) LFCO-1, (d) CoOx@LFCO-1. TEM images of sample (e, h) LFO, (f, i) LFCO-1, (g, j) CoOx@LFCO-1.
Figure 2
XRD profiles (a) of pristine LFCO-x catalysts and (c) corresponding exsolved samples (1 ≤ x ≤ 3 with amplification of the main peak). (b) N2 adsorption-desorption isothermal curves and (d) pore size distribution of as-prepared catalysts.
Figure 3
H2-TPR profiles of (a) pristine, exsolved, and loaded catalysts, including LFO, LFCO-1, CoOx@LFCO-1, 10% CoOx/LFO, and (c) CoOx@LFCO-1, CoOx@LFCO-2, and CoOx@LFCO-3. TGA analysis of (b) LFO and (d) LFCO-3 under reductive atmosphere 5% H2/N2.
Figure 4
(a) Co K-edge XANES spectra, (b) Co K-edge EXAFS k3χ(k) spectra, (c) Fe K-edge XANES spectra, and (d) Fe K-edge EXAFS k3χ(k) spectra of catalyst CoOx@LFCO-3, Co foil, Co3O4, and LCO. Wavelet transforms for the k3-weighted EXAFS signals of Co K-edge in (e) CoOx@LFCO-3, (f) LaCoO3, and (g) Co3O4 for comparison.
Figure 5
(a) Fe 2p, (b) Co 2p, and (c) O 1s XPS profiles of studied catalysts. (d) The EPR spectra of the pristine catalyst LFCO-1 and cobalt exsolved catalyst CoOx@LFCO-1.
Figure 6
(a) The light-off curves and (c) characteristic temperature of studied catalysts (LFO, LFCO-1, CoOx@LFCO-1, LFCO-2, CoOx@LFCO-2, LFCO-3, CoOx@LFCO-3). (b) Activation energy of sample LFCO-3 and CoOx@LFCO-3. (d) The light-off curves, and (e) characteristic temperature of catalyst LFO, LFCO, CoOx@LFCO-1, and 10% CoOx/LFO. (f) Activation energy of sample LFCO and CoOx@LFCO-1, and 10% CoOx/LFO.

 DownLoad:

 下载:
下载:


 下载:
下载:
