Citation:
Mengyi Xi, Kaiqing Wu, Jingjing Chen, Yanfei Shen, Songqin Liu, Ran Chen, Yuanjian Zhang. Recent advances of analytical methods for intermediates of reactive oxygen species in electrocatalytic oxygen reduction reactions[J]. Chinese Chemical Letters,
2026, 37(5): 111915.
doi:
10.1016/j.cclet.2025.111915
Recent advances of analytical methods for intermediates of reactive oxygen species in electrocatalytic oxygen reduction reactions
English
Recent advances of analytical methods for intermediates of reactive oxygen species in electrocatalytic oxygen reduction reactions
Jiangsu Engineering Laboratory of Smart Carbon-Rich Materials and Devices, Jiangsu Province Hi-Tech Key Laboratory for Bio-Medical Research, School of Chemistry and Chemical Engineering, Southeast University, Nanjing 211189, China
b.
Medical School, Southeast University, Nanjing 210009, China
Received Date:
02 May 2025 Accepted Date:
28 September 2025 Revised Date:
12 August 2025 Available Online:
15 May 2026
Abstract:
Electrocatalytic oxygen reduction reaction (ORR) is a key sustainable energy process, but its efficiency and durability are severely affected by reactive oxygen species (ROS) such as hydroxyl radicals and superoxide anions. Understanding the kinetics of these transient intermediates is crucial for revealing the ORR mechanism and designing novel electrocatalysts. Many new in situ and operando characterization techniques have emerged in ROS detection. This article reviews recent progress in the detection and quantification methods for ROS during the electrocatalytic ORR, including fluorescence spectroscopy, UV–vis absorption spectroscopy, electron paramagnetic spectroscopy, scanning electrochemical microscopy, and electrochemiluminescence related technologies. The aim is to provide latest references for researchers in this field and promote further development of electrocatalytic ORR related research.
With the surging global energy demand and intensifying environmental challenges, the advancement of efficient clean energy conversion and storage technologies has emerged as a pivotal focus in 21st-century science and engineering [1–3]. Among clean energy solutions, fuel cells and metal-air batteries have garnered significant interest due to their high energy density and low emission profiles [4]. Central to these technologies, the oxygen reduction reaction (ORR) acts as a key performance bottleneck, primarily owing to its sluggish reaction kinetics and substantial overpotential [5–8]. For instance, in proton exchange membrane fuel cells (PEMFCs), ORR overpotential can reach 300–400 mV, constituting over 80% of total cell voltage loss [9–11]. Additionally, the cycle durability and power output of metal-air batteries (e.g., zinc-air systems) are directly governed by the catalytic activity and stability of ORR electrocatalysts. Consequently, research into electrocatalytic ORR entails both deepening fundamental electrochemical understanding and closely integrating novel electrocatalyst design with interfacial reaction mechanism analysis [12–14].
The widely accepted ORR reaction pathways are divided into the four-electron (4e-) pathway and the two-electron (2e-) pathway, and there are also some works reporting three-electron (3e-) reactions.
The reaction equation for the 4e- ORR pathway in acidic or alkaline media is:
Under acidic conditions:
O2+4H++4e−→2H2O(E0=1.23Vvs.RHE)
(1)
Under alkaline conditions:
O2+2H2O+4e−→4OH−(E0=0.40Vvs.RHE)
(2)
In the 4e- ORR pathway, O2 undergoes a complete reduction reaction to generate H2O, theoretically without producing free reactive oxygen species (ROS), such as hydroxyl radicals (•OH) and superoxide anions (O2•-), which can corrode the electrode surface catalyst, thus improve system stability. However, there are also adsorbed ROS in this process, namely adsorbed hydroxyl radicals (*OOH) generated by the binding of O2 to the active sites of the catalyst. The binding ability of O-O bonds is a key factor affecting the ORR reaction activity and pathway selection, which is closely related to the characteristics of the catalyst. To achieve high 4e- ORR efficiency, it is necessary to design catalysts with appropriate structures. Typically, electrocatalysts need to have strong O2 adsorption capacity and high electron transfer efficiency to ensure deep activation of O2 molecules and complete the four-step electron transfer. Furthermore, it is necessary to avoid excessive accumulation of adsorbed intermediates at the active site to prevent pathway deviation to 2e- or 3e- reactions [15–18].
On the other hand, the reaction equation for the 2e- ORR pathway in acidic or alkaline media is:
Under acidic conditions:
O2+2H++2e−→H2O2(E0=0.70Vvs.RHE)
(3)
Under alkaline conditions:
O2+H2O+2e−→HO2−+OH−(E0=−0.07Vvs.RHE)
(4)
These reaction routes involve multi-electron transfer processes and generate ROS including O2•-, •OH, and hydrogen peroxide (H2O2). The H2O2 produced via the 2e- ORR pathway not only reduces energy conversion efficiency due to lower theoretical potential compared to 4e- ORR pathway but also induces corrosion of electrode materials and electrolyte membranes (e.g., NafionⓇ membranes) [19]. However, H2O2 is an important green oxidant, and in the context of carbon neutrality, electrocatalytic synthesis of H2O2 through the 2e- ORR has gradually emerged as an alternative green route. Compared with the 4e- ORR, 2e- ORR requires moderate adsorption strength of O2 on the surface of electrocatalysts in the selection of ORR pathways. If too weak, the molecular activation is insufficient, and if too strong, the desorption of H2O2 is hindered and further reduction (such as water generation) may occur. In addition to the structure of the electrocatalyst itself, the pH value of the reaction system also affects the products. The acidic environment is conducive to the stable existence of H2O2, while the alkaline environment may inhibit the excessive hydrolysis or disproportionation of HO2- [20–22]. Notably, given the importance of H2O2 as a chemical feedstock, a lot of research efforts focus on designing electrocatalysts that selectively promote the 2e- ORR pathway for electrochemical H2O2 synthesis [23–28].
In addition to the most common 2e- and 4e- ORR, there is also the 3e- ORR, which is an incomplete oxygen reduction process and also plays an important role in some electrocatalytic systems [29–32].
In acidic (Eqs. 5 and 6) or alkaline (Eqs. 7 and 8) environments, 3e- ORR follows a unique reaction pathway: First, it generates H2O2 through a two-step single electron transfer process, and then further generates •OH through single electron transfer (Eq. 9). The ROS involved in this reaction mechanism include •OOH, H2O2, and •OH. It is worth noting that in both acidic and alkaline environments, 3e- ORR first generates H2O2, which is then oxygen reduced to highly oxidized •OH active species [30]. The generated •OH, with its high reactivity, can quickly attack and destroy the chemical structure of organic pollutants, making 3e- ORR an efficient method in the fields of water treatment and pollution control. Compared with the 4e- ORR used for fuel cells and the 2e- ORR used for H2O2 electro synthesis, the 3e- ORR provides a new approach for treating persistent pollutants that are difficult to degrade or biodegrade using traditional methods. In the above three pathways, the generation of ROS is involved, and the structure and solution properties of electrocatalysts will affect the choice of pathway. Researchers can gain a deeper understanding of ORR reactions through qualitative and quantitative research on ROS.
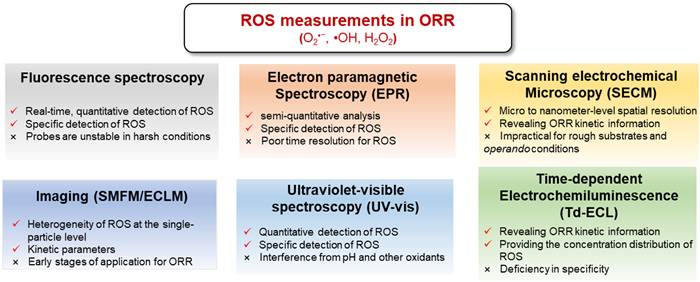
ROS intermediates play a crucial role at the electrocatalyst electrolyte interface, but their dynamic behavior is not well understood due to their transient properties and ultra-low interface concentrations [33]. The dynamic behavior of these intermediates directly affects the efficiency and selectivity of ORR, and may also cause degradation of electrode materials or deactivation of electrocatalysts. Therefore, accurate detection and in situ characterization of the types, concentrations, spatiotemporal distribution, and dynamic evolution process of ROS intermediates are key challenges for understanding ORR mechanisms and optimizing electrocatalyst design. Traditional electrochemical techniques, such as the rotating disk electrode (RDE) voltammetry and electrochemical impedance spectroscopy (EIS), provide macroscopic kinetic parameters, but cannot solve the spatial distribution, and kinetic information of ROS. The emergence of cutting-edge in situ and operando characterization tools has completely changed ROS detection on the ORR interface, enabling researchers to explore more reaction mechanisms. Surface enhanced Raman scattering spectroscopy [34–36] and surface enhanced infrared reflectance absorption spectroscopy [37–39] have be used to obtain experimental evidence of short-lived ROS intermediates adsorbed on the surface of electrocatalysts, and the relationship between ORR kinetics and adsorbed ROS have been established. However, these techniques cannot provide information on free radical species in the solution. Therefore, other analytical methods have been applied in detecting ROS. For example, fluorescence-based methods utilize molecular probes (such as Amplex Red for H2O2) to achieve real-time, selective quantification of ROS with millisecond time resolution. Single-molecule fluorescence microscopy (SMFM) reveals the heterogeneity of electrocatalyst activity by analyzing random ROS generation events at individual catalytic sites, further expanding this capability. As a supplement, UV–vis absorption spectroscopy can be used to quantitatively detect ROS and evaluate the practical application performance of electrocatalysts. For free radical detection, electron paramagnetic resonance (EPR) combined with spin capture agents (such as DMPO, TEMP) can clearly identify short-lived free radicals (•OH, O2•-), and scanning electrochemical microscopy (SECM) can map the ROS distribution on the electrode surface with micrometer level spatial resolution. At the same time, electrochemiluminescence (ECL) and its imaging (ECL microscope, ECLM) utilize ROS to bind with luminescent reagents and reflect them in chemiluminescence signals, achieving spatially resolved visualization of interfacial ROS during ORR processes. This review aims to summarize the latest advances in characterization techniques for free ROS during the ORR process.
2.
Analyzing and evaluation methods
2.1
Fluorescence spectroscopy
Fluorescence spectroscopy technique is one of the classical spectroscopic techniques based on fluorescent probes. For ROS detection, fluorescent probes are often oxidation sensitive, and they are non-fluorescent before being oxidized by oxygen species. The commonly used fluorescent probes are organic molecules with special structures, such as 2,7-dichlorodihydrofluorescein diacetate (DCFH-DA), mitochondrial superoxide indicator (MitoSOX Red), dihydroethidium (DHE), hydroxyphenyl fluorescein/aminophenyl fluorescein (HPF/APF), 10-acetyl-3,7-dihydroxyphenoxazine (Amplex Red). Their fluorescence properties undergo significant changes before and after reacting with ROS [40–42].
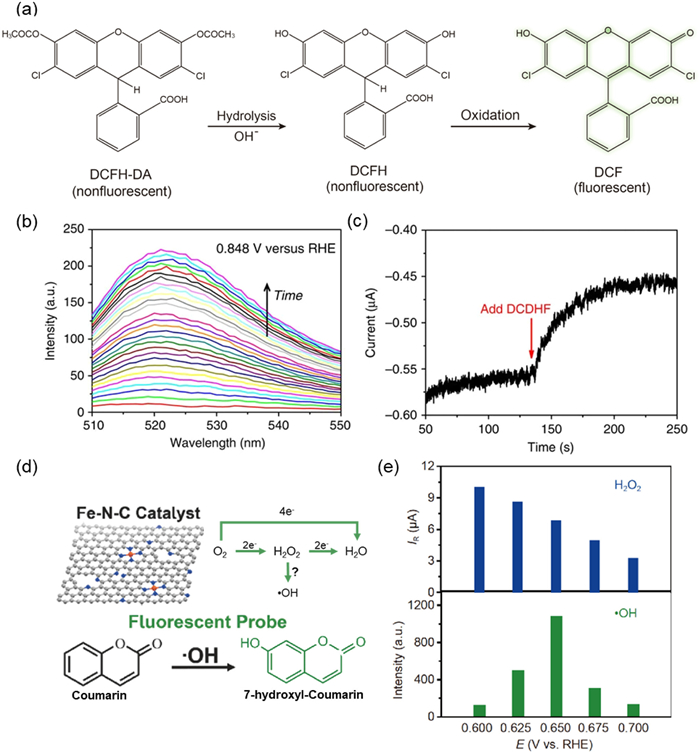
DCFH-DA is the more frequently utilized fluorescent probe due to its sensitivity to various types of ROS such as H2O2, •OH, O2•-, albeit with low specificity. The schematic mechanism is shown in Fig. 1a [43]. DCFH-DA inherently lacks fluorescence; however, it can be oxidized by ROS to produce 2,7-dichlorofluorescein (DCF), which exhibits strong green fluorescence. Wang et al. used in-situ fluorescence spectroscopy combined with electrochemical techniques, with DCFH-DA as an indicator, to detect the formation of ROS during the ORR process [44]. When ORR occurred on the electrode, the intermediate ROS produced react with DCFH-DA to generate DCF, resulting in an increase in the fluorescence intensity. By detecting changes in fluorescence intensity at specific wavelengths, the generation and changes of the intermediate can be monitored in real time. Fluorescence intensity was measured in an aqueous solution containing 0.1 µmol/L KOH and 2.5 µmol/L DCFH-DA, and the DCF signal kept increasing, indicating that •OH continuously converted DCFH-DA to DCF as the reaction occurred (Fig. 1b). This proved that •OH were generated during the ORR process. To verify that the detected ROS is transient rather than a byproduct, ORR testing was conducted in an air saturated 0.01 mol/L KOH solution using a 1:1 vol ratio of water and ethanol as solvents at a constant potential of 0.848 V vs. RHE. After adding DCFH-DA, a significant decrease in reduction current was observed (Fig. 1c). This is because when DCFH-DA diffuses to the electrode surface, it undergoes a rapid chemical reaction with •OH, consuming some intermediates and temporarily reducing the electrochemical reaction current. Therefore, it can be concluded that the formation of ROS is accomplished through electrochemical reactions. In addition, coumarin was used in the study for specific recognition of •OH. The principle is that •OH specifically attacks the 7th carbon atom of coumarin molecule, causing hydroxylation reaction and generating fluorescent 7-hydroxycoumarin. The authors added 60 mmol/L coumarin to 0.01 mol/L KOH saturated with O2, and performed ORR testing at a constant potential of 0.799 V (vs. RHE). The results showed a significant increase in fluorescence intensity from the initial baseline (black curve) at 500 nm (red curve), and a signal enhancement of about 50% after 50 min of electrolysis, indicating the specific generation of •OH.
Figure 1
Figure 1.
(a) Chemical structures of DCFH-DA, DCFH and DCF. Reproduced with permission [43]. Copyright 2021, Elsevier. (b) In situ fluorescence spectroelectrochemistry performed at a constant potential in O2 saturated 0.1 mol/L KOH containing 2.5 µmol/L DCFH-DA for 10 min (from bottom to top). (c) I–t curve of ORR on CPG-900 at 0.849 V vs. RHE. The electrolyte is 0.01 mol/L KOH dissolved in 1:1 (v/v) water/ethanol solution with saturated air. The red arrow denotes the addition of 12.5 µmol/L DCDHF into the electrolyte, showing an abrupt decrease in reduction current due to the competitive chemical reaction of oxygen containing intermediate (OCI) with DCFH-DA to the electrochemical reaction by receiving electrons from CPG-900. Reproduced with permission [44]. Copyright 2014, Nature Publishing Group. (d) Scheme of the conversion from non-fluorescent coumarin to fluorescent 7‑hydroxyl-coumarin by •OH generated in ORR on Fe/N/C electrocatalyst (color online). (e) Comparison of the ring currents from H2O2 oxidation with the fluorescence intensity induced by •OH (color online). Reproduced with permission [45]. Copyright 2019, Springer Nature.
It is worth noting that coumarin would decompose in alkaline solution, and the existence of •OH is qualitatively conclusive. Therefore, more detailed experimental evidence is required to further understand the nature of •OH generated from ORR on the electrocatalysts. As coumarin is effective in acid solution, Chen et al. proposed a fluorescent method with coumarin as a probe to distinguish the role of •OH in the Fe-N-C ORR in 0.1 mol/L H2SO4 solution (Fig. 1d) [45]. The study claimed that as the potential decreased from 0.70 V to 0.60 V, the quantity of •OH produced via the ORR process on the Fe-N-C electrocatalyst increased, peaking at 0.65 V before subsequently decreasing. This fluctuation in •OH quantity starkly contrasts with that of H2O2, which exhibited a consistent increase with decreasing potentials (Fig. 1e). The distinct potential dependence between •OH and H2O2 suggests that •OH is not primarily generated through the decomposition of H2O2. This research contributes novel insights into the ORR process on Fe-N-C electrocatalysts.
Interestingly, although a variety of fluorescent probes with specific response to ROS have been developed, they are rarely used in ORR. This phenomenon may be attributed to the fact that electrocatalytic systems typically operate under harsh conditions, such as strong acid or base environments, or high potentials, which may lead to the instability or decomposition of fluorescent probes [46–48]. Fortunately, with the continuous development of nanotechnology, materials science, and biotechnology, the design and synthesis of new fluorescent probes will make greater breakthroughs. For example, in improving the acid resistance of fluorescent probes, Wen et al. synthesized Eu3+-based fluorescent probes (JXUST-29) based on MOFs. When the pH value increased from 2 to 5, the luminescence signal significantly increased, and the emission intensity increased by about 54 times, emphasizing that this is a typical behavior of pH probes [49]. In addition, Fu et al. greatly improved the stability of the fluorescent probe by encapsulating Me4BOPHY-1 with ZIF-8, and the thermal decomposition temperature was raised to 527 ℃ [50]. Although the above-mentioned fluorescent probes have not been applied in the field of ROS detection in ORR, these works demonstrate the potential for the development of fluorescent probes. Therefore, we expect to see fluorescent probes that can overcome the instability under operando conditions and be applied to ROS detection.
Unlike conventional fluorescence spectroscopy techniques, which are suitable for rapid analysis at the macroscopic level, single-molecule fluorescence microscopy (SMFM) is a technique for detecting and studying free ROS at the microscopic level [51]. High-sensitivity fluorescence detection equipment such as confocal microscopy and total internal reflection fluorescence microscopy were usually equipped to monitor the fluorescence signal changes of individual molecules in real time [52]. For example, Xu et al. first combined SMFM with traditional electrochemical methods to observe the fluorescence signal changes of individual platinum particles during the hydrogen oxidation reaction process and recorded their dynamic activity decay [53]. This method combines the advantages of traditional electrochemical potential control with the high spatial resolution of fluorescence imaging, providing a new research paradigm for nanoscale electrochemical reactions.
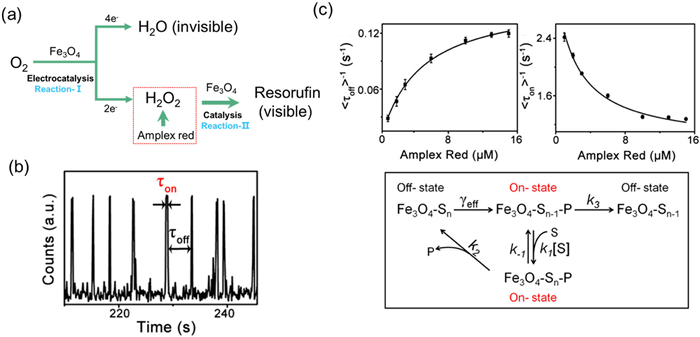
Xu and his colleagues have revealed for the first time the kinetic characteristics of the 2e- ORR catalyzed by Fe3O4 nanoparticles at the single particle level by combining SMFM and traditional electrochemical methods [54]. They utilized the dual functional catalytic effect of Fe3O4 nanoparticles: on the one hand, they catalyzed ORR to generate H2O2 (Reaction I), and on the other hand, they catalyzed Amplex Red to react with H2O2 to generate the fluorescent product of resorufin (Reaction II) (Fig. 2a). Meanwhile, in the single-molecule fluorescence experiment, the trajectory of fluorescence intensity over time is used to analyze the formation and dissociation time of the product (τoff and τon) (Fig. 2b). By correlating the 2e- ORR rate with single-molecule fluorescence signals, the core parameters of electrochemical kinetics were derived using the Butler Volmer model: electron transfer coefficient (β) and standard rate constant (k) (Fig. 2c). The formation time τoff can be expressed as:
<τoff>−1=Aoffexp(−βfE)
(10)
Figure 2
Figure 2.
(a) Bifunctional catalysis of Fe3O4 NPs for the Study of 2e- ORR process at the single-particle level: Reaction-I, the electrocatalysis of Fe3O4 NPs for ORR; Reaction-II, the catalysis of Fe3O4 NPs for amplex red oxidation by H2O2 to produce fluorescent resorufin. (b) Typical fluorescence intensity vs. time trajectory of a single Fe3O4 nanoparticle with 10 µmol/L amplex red and O2-saturated 5 mmol/L pH 8.5 phosphate buffer at −0.6 V. Time resolution: 100 ms. (c) Kinetics study of Fe3O4 nanoparticle-catalyzed oxidative amplex red reaction. Reproduced with permission [54]. Copyright 2020, American Chemical Society.
where A is the frequency factor, related to the standard rate constant k and O2 concentration(Co2), Aoff = kCO2. And β is the electron transfer coefficient (0 < β < 1), which reflects the effect of potential on the activation energy barrier of the reaction. The smaller β indicates the weaker the effect of potential on the rate. f = F/RT, which is the ratio of Faraday constant to gas constant and temperature.
The fitting results show that β = 0.05 ± 0.01, indicating that the energy barrier of 2e- ORR is insensitive to potential changes, which is consistent with the electronic structure characteristics of Fe(II) sites on the surface of Fe3O4. k = 25.5 ± 0.5 L s-¹ mol-¹, representing the standard rate constant at the single particle level, quantifies the catalytic efficiency of Fe3O4 for 2e- ORR. And the rate increases exponentially with the negative shift of the potential, verifying that the regeneration of Fe(II) sites (Fe3+ → Fe2+) is a key step in potential regulation
The application of SMFM in the detection of free ROS at the electrocatalytic oxygen reduction interface is still in its early stages, but its unique research perspective provides stronger technical support for the study of electrocatalytic reaction mechanisms, which has attracted increasing attention. Chen et al. addressed the optimization of photoanode performance in photoelectrochemical water splitting and studied the photo generated charge reaction activity on the surface of titanium dioxide nanorods using single-molecule fluorescence and super-resolution imaging techniques [55]. They found that the site with the highest water oxidation activity is also the main site for charge recombination. Its spatial resolution is about 30 nm, breaking the diffraction limit of traditional optical microscopes (300 nm) and allowing observation of nanoscale (50 nm) reaction activity distribution. With a temporal resolution was of 15 milliseconds (ms), this technique can track the dynamic process of photo generated charge reactions. This work would inspire more research utilizing the unique advantages of SMFM, particularly its high temporal resolution and single-molecule analysis capabilities, to gain a deeper understanding of the relationship between ORR reaction mechanisms and ROS.
UV–vis absorption spectroscopy is a rapid analytical technique that quantifies the absorbance or transmittance of light. The UV–vis absorption spectroscopy method utilizes the specific absorption spectrum of free ROS or their reaction products in the ultraviolet region, and detects the content and type of ROS by measuring the absorbance changes of the sample in the ultraviolet region. For instance, the O2•- exhibits a typical absorption peak at 252 nm after the ORR in the O2-saturated 0.1 mol/L tetra-n-butylammonium perchlorate (TBAClO4-DMSO) solutions (red dotted trace), which can be undoubtedly assigned to the 1πu → 1πg transition of the O2•- species in the solution [56].
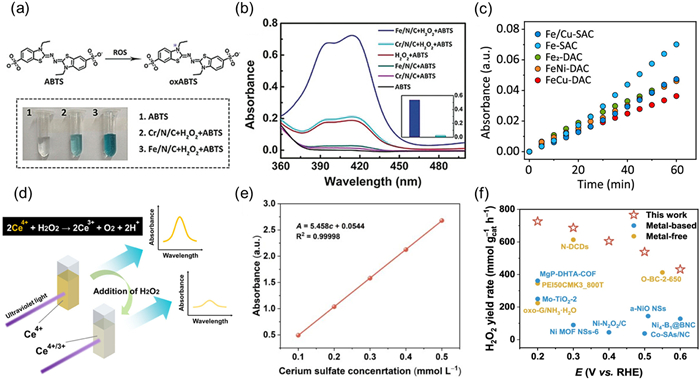
During the ORR process, non-precious metal electrocatalysts are susceptible to ROS attacks due to their unstable structure [61]. ROS oxidizes the surface of the electrocatalyst, causing the electrocatalyst particles to dissolve, aggregate, or destroying the lattice structure, thereby damaging the active sites and reducing the stability of the electrocatalyst. Xing et al. validated the significant improvement in stability of Cr/N/C electrocatalyst compared to Fe/N/C electrocatalyst using ABTS probe method [57]. The principle of this method is that 2,2′-diazobis(3-ethylbenzothiazole-6-sulfonic acid) (ABTS) can be oxidized by ROS to green cationic radicals (ABTS+), and its absorbance at 417 nm is positively correlated with ROS concentration (Fig. 3a). The results showed that after the reaction between Cr/N/C-950 and H2O2, the absorbance at 417 nm was only 4.3% of that of Fe/N/C-950 (Fig. 3b), indicating that its ROS generation was significantly lower than that of Fe/N/C electrocatalyst. This suggests that Cr/N/C-950 inhibits ROS generation during ORR process, leading to an improved stability. Niu et al. also used the same method to detect ROS and demonstrated that diatomic electrocatalysts (DACs) can effectively inhibit ROS production, thereby improving durability [58]. During the ORR process, the author used a circulating pump to flow the electrolyte in real-time into the UV–vis colorimetric cell and monitored the changes in absorbance over time (Fig. 3c). The absorbance growth rate of FeCu DAC is the slowest, indicating that its ROS production is the lowest, which verifies its inhibitory ability on Fenton like reactions. The above research provides an important theoretical basis for designing highly stable single-atom electrocatalysts (SACs) and DACs from the perspective of UV–vis methods.
Figure 3
Figure 3.
(a) Top: Reaction between ROS and ABTS; bottom: photographs showing the color change of the solution after the Fenton reaction. (b) UV–vis absorption spectra of 0.1 mol/L HClO4 solutions of only ABTS, Cr/N/C-950 and ABTS, H2O2 and ABTS, Fe/N/C-950 and ABTS, Cr/N/C-950, H2O2 and ABTS, Fe/N/C-950, as well as H2O2 and ABTS after 7 min reaction. Reproduced with permission [57]. Copyright 2019, Wiley-VCH. (c) ROS generated during the ORR process for Fe-containing DACs and reference samples, as quantified by ABTS coloration. Reproduced with permission [58]. Copyright 2023, American Chemical Society. (d) The cerium sulfate titration method for determining the H2O2 concentration. Reproduced with permission [59]. Copyright 2021, American Chemical Society. (e) A standard curve correlating Ce4+ concentration with absorbance by measuring the absorbance at 319 nm. (f) Comparison of H2O2 yield rate (mmol gcat−1 h−1) with other reported literature under alkaline condition (0.1 mol/L KOH) in H-cells. Reproduced with permission [60]. Copyright 2024, Nature Publishing Group.
The iodide method is a commonly used spectrophotometric method for measuring the concentration of H2O2 through the oxidation–reduction reaction of iodine. The principle is that under acidic conditions, H2O2 oxidizes I− to I2, which combines with excess I− to form I3−. The absorbance of I3− is measured at a wavelength of 352 nm, and the H2O2 concentration is determined according to the Lambert-Beer's law. For example, Ma et al. utilized Bi4NbO8X (X = Cl/Br) single crystal nanosheets to synergistically combine piezoelectric catalysis with photocatalysis (termed as piezoelectric photocatalysis), efficiently generating various free radicals via ORR [62]. Among them, the detection of H2O2 was carried out using the iodide method combined with ammonium molybdate for specific quantitative analysis. The experiment confirmed that when light and ultrasound interact together, the efficiency of H2O2 generation is further synergistically enhanced, with yields reaching 79.2 µmol/L within 2 h. However, the iodide method involves multiple steps and may be interfered with other oxidants. Cerium sulfate (Ce(SO4)2) titration method is an alternative approach for detecting H2O2, which exhibits high selectivity and strong resistance to interference [59,63–65]. Compared to the iodide method, it is less susceptible to interference from other oxidizing substances such as Cl- and NO₃-. In the detection process, a UV–vis spectrophotometer was used to monitor the changes in Ce4+ concentration before and after the reaction (yellow Ce4+ reacts with H2O2 to form colorless Ce3+) (Fig. 3d) [59]. Subsequently, the concentration of H2O2 can be calculated through stoichiometric relationships. This process is illustrated in the following equations [66]:
According to the formula, it can be inferred that H2O2 concentration is half of the consumed Ce4+ concentrations. Duan et al. used 0.5 mol/L H2SO4 as the solvent to prepare Ce(SO4)2 at concentrations ranging from 0.1 mmol/L to 0.5 mmol/L [60]. They then established a standard curve correlating Ce4+ concentration with absorbance by measuring the absorbance at 319 nm (Fig. 3e). The cathode electrolyte obtained after constant potential testing was added to 0.5 mmol/L Ce(SO4)2, and the changes in Ce4+ concentrations before and after the reaction were monitored using a UV–vis spectrophotometer to calculate the concentration of H2O2. The results indicated that Ni-SAC exhibited excellent 2e- ORR performance under alkaline conditions, achieving a H2O2 yield of 0.73 mol gcat−1 h−1 (Fig. 3f) in the h-cell and 5.48 mol gcat−1 h−1 in the flow cell.
Although the cerium sulfate titration method is widely used, it also has limitations in terms of low sensitivity and pH requirements. It is more suitable for samples with H2O2 concentrations of ≥1 mmol/L and requires strong acidic media (such as H2SO4). Enzyme linked colorimetric method possesses the capability to detect low concentrations (µmol/L level) of H2O2. For example, using peroxidase to catalyze the reaction of H2O2 with a chromogenic substrate, peroxidase (such as horseradish peroxidase, HRP) can catalyze the oxidation of H2O2 to a specific chromogenic substrate, generating a colored product. By measuring the absorbance change of the product, the concentration of H2O2 in the sample can be indirectly quantified. The absorbance of the color product is linearly related to the concentration of H2O2, and the content of H2O2 in the sample can be calculated using a standard curve. Zhang et al. confirmed the efficient production of H2O2 (698 µmol L−1 h−1) by C5N2 in hypoxic environments using the HRP-TMB colorimetric method, providing direct evidence for the industrial application and biomedical potential of photocatalysts [67]. Although this study is not related to ORR, HRP-TMB colorimetric method is still an effective way to detect H2O2. However, the enzymes used in colorimetric methods are relatively expensive, and excessive oxidation of substrates or enzyme inactivation due to long reaction times or inappropriate temperatures can affect the accuracy of the results. In addition, different chromogenic substrates and peroxidases may have different optimal pH values, and reaction conditions need to be optimized.
With the increasing demand for ROS detection in low concentration and complex systems, UV–vis method suffered from the relatively poor detection sensitivity and selectivity. However, as a fundamental analytical method, it can still be combined with other more advanced techniques to leverage its advantages in qualitative and quantitative analysis, providing more comprehensive information for the study of ROS. For example, Yao et al. used UV-Raman spectroscopy to significantly enhance the signals of different electrocatalyst surface species, solving the fluorescence interference problem of traditional Raman spectroscopy [68]. In situ UV–vis technology combined with electrochemical cells can monitor the structural evolution of electrocatalysts in real-time under reaction conditions, avoiding the limitations of offline analysis. Wang's team used in situ UV–vis to distinguish the battery type, and double-layer capacitance behavior of energy storage materials, which can be applied to the dynamic study of active sites in ORR electrocatalysts [69]. In the future, by combining in situ technology and other advanced methods, a deeper understanding of the structure-activity relationships in complex systems would be revealed using the UV-vis method promoting the development of efficient ORR electrocatalysts.
2.3
Electron paramagnetic spectroscopy
Electron paramagnetic spectroscopy (EPR), is a method for detecting and studying ROS based on the principle that substances with unpaired electrons absorb electromagnetic waves of specific frequencies in a magnetic field [70,71]. ROS typically have unpaired electrons and can therefore be detected by EPR spectroscopy [72–75]. Under specific conditions, each free radical species displays a characteristic EPR spectrum, with the signal intensity correlating linearly to its concentration. This allows for both qualitative identification and quantitative determination of free radicals, thereby facilitating a more in-depth investigation into the reaction mechanism of the ORR.
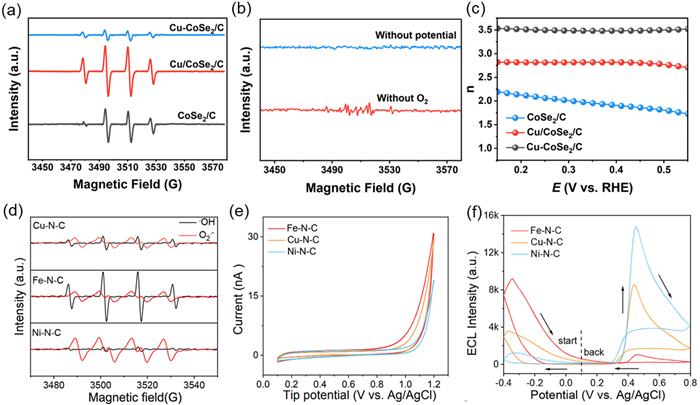
EPR can directly display the types of ROS in the ORR process through spectral information, for example the EPR spectrum of •OH presents a quadruple peak, with peak intensity ratios of 1:2:2:1. This is due to the hyperfine coupling between unpaired electrons and adjacent protons, such as hydrogen nuclei [76]. Moreover, by combining EPR information with other characterization methods researchers were able to reveal different reaction mechanisms. Li et al. systematically studied the mechanism and efficiency of Cu/CoSe2/C electrocatalyst in generating •OH in electrocatalytic 3e- ORR using EPR technology [78]. In order to verify the existence of •OH, the researchers used 5,5-dimethyl-1-pyrroline-N-oxide (DMPO) as a free radical scavenger. A characteristic 1:2:2:1 quadruple peak in the EPR spectrum (Fig. 4a) indicated that DMPO reacted with •OH to form a stable DMPO-•OH spin adduct, directly proving the existence of •OH. In the case of CoSe2/C systems or Cu-CoSe2/C, the EPR signal intensity significantly decreased and almost disappeared. According the EPR information and density functional theory (DFT) calculations, they suggested that the strong metal–support interactions (SMSI) effect is a key factor in enhancing the •OH generation. In addition, they found that the EPR signal almost disappeared without oxygen or applied potential (Fig. 4b), indicating that the generation of •OH strictly depends on the 3e- ORR process, rather than other side reactions such as photolysis or thermal decomposition. This result eliminates the interference of non-electrochemical pathways. Furthermore, traditional electrochemical tests such as rotating ring disk electrode (RRDE) and linear sweep voltammetry (LSV) experiments were conducted to reveal the ORR pathway of the electrocatalyst. The electron transfer number of Cu/CoSe2/C was close to 3.0 (Fig. 4c), consistent with its strong EPR signal, confirming the mechanism dominated by 3e- ORR.
Figure 4
Figure 4.
(a) EPR spectra in different systems. (b) EPR spectra without O2 or applying potential. (c) Electron transfer number in the RRDE measurements for CoSe2/C, Cu-CoSe2/C, and Cu/CoSe2/C systems. Reproduced with permission [76]. Copyright 2024, Elsevier. (d) EPR spectra in BR buffer solution containing DMPO with and without methanol. (e) Collection of CV curves on Pt UME tip by applying −0.4 V on the SACs modified ITO-electrode in DMPO and BR buffer solution (pH 10.0). (f) ECL intensity of Fe-N-C, Ni-N-C, and Cu-N-C SACs in 0.1 mmol/L luminol-dissolved O2 ECL system (PMT = 400 V). Reproduced with permission [77]. Copyright 2024, American Chemical Society.
Zhu et al. used EPR technology to detect and distinguish ROS generated under different reaction conditions, and combined it with ECL to support the regulatory effect of different metal-nitrogen-carbon (M-N-C) SACs on the ORR pathway [77]. The EPR characterization revealed distinct ROS signatures: Fe-N-C SACs predominantly generated DMPO-•OH adducts, while Ni-N-C SACs exclusively produced DMPO-O2•- adduct. Remarkably, Cu-N-C SACs exhibited dual ROS generation, simultaneously yielding both DMPO-•OH and DMPO-O2•- spin adducts, indicating concurrent activation of divergent ORR pathways (Fig. 4d). This divergence originates from metal-specific oxygen affinity and O-O bond cleavage capabilities. In addition, SECM verified the generation of •OH by detecting changes in electrode tip current (Fig. 4e). ECL monitoring demonstrated that Fe-N-C facilitates 4e- ORR via strong metal-oxygen interactions, preferentially cleaving O-O bonds to produce •OH that drive cathodic luminescence (Fig. 4f). Conversely, the weak oxygen affinity of Ni-N-C restricts electron transfer to 2e- reduction, generating O2•- that mediate anodic ECL through luminol oxidation. Crucially, Cu-N-C uniquely balances these competing pathways through moderate oxygen binding energy, enabling parallel 4e-/2e- ORR processes. This dual-pathway capability allows simultaneous cathodic (•OH-mediated) and anodic (O2•--driven) ECL emissions, contrasting with the singular pathway dominance observed in Fe- and Ni-based SACs.
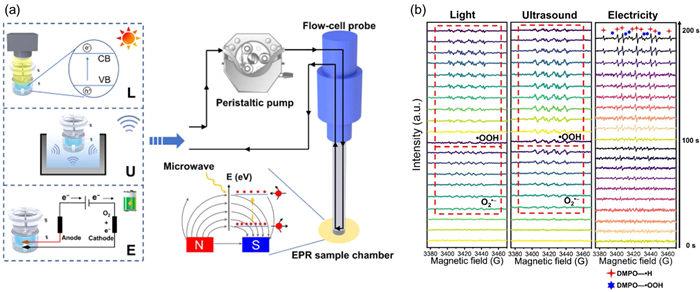
Although EPR detection in the above studies can provide partial validation from the mechanism of ORR reaction, they lack time-resolved EPR data and do not demonstrate the dynamic evolution of ROS. Therefore, Zhu et al. focused on studying the reaction pathway and intermediate active substances of ORR using an in situ EPR monitoring system [79]. The schematic diagram of in situ EPR detection is roughly shown in the Fig. 5a. The researchers transferred the aqueous reaction sample from the quartz reactor cell to the flow cell probe, and then transferred it to the EPR sample chamber through a peristaltic pump. In EPR, when microwaves are applied perpendicular to the magnetic field, low-energy electrons absorb energy and transition to higher energy levels, generating absorption signals that are converted into EPR spectral signals. During the electrocatalytic H2O2 generation process, in situ EPR detected a mixed signal of hydrogen radicals (•H) and hydrogen peroxide radical(•OOH) (Fig. 5b), but no characteristic signal of O2•- was observed. According to the literature, the ORR pathway of electrocatalysis directly generates •OOH through proton coupled electron transfer (PCET), with the pathway being O2 + H+ + e- → •OOH → H2O2 (without the need for O2•- intermediates). In addition, the research was expanded to encompass photocatalysis and piezocatalysis. Under these two catalytic conditions, EPR is capable of detecting the O2•- signal, which subsequently evolves into •OOH. This suggests new reactions pathways to generate H2O2: O2 → O2•- → •OOH → H2O2 through the photocatalysis and piezocatalysis, instead of the electrochemical 2e- ORR pathway. In summary, EPR has identified the direct PCET mechanism of electrocatalytic ORR by tracking the evolution of intermediate free radicals, providing key experimental evidence for distinguishing different catalytic systems (electrocatalysis vs. photocatalysis/piezocatalysis).
Figure 5
Figure 5.
(a) Schematic diagram of the in situ EPR system. (b) In-situ EPR spectra three kinds of catalytic H2O2 production by BiOBr with abundant oxygen vacancies (BOB-OV). Reproduced with permission [79]. Copyright 2024, Wiley-VCH.
EPR technology has unique advantages in detecting ROS, but suffered from a high limit of detection, making it difficult to capture instantaneous signals of low concentration or short-lived free radicals. Moreover, the time resolution of traditional EPR technology is relatively low, making it difficult to track the generation and rapid decay behavior of transient free radicals (such as •OH with a lifetime of nanoseconds) during the ORR process in real time. At this point, in-situ electrochemical EPR shows great potential for application. The thin film electrochemical EPR (FE-EPR) system designed by the Erwin Reisner team can monitor free radical intermediates, such as 2,2,6,6-tetramethylpiperidinooxy (TEMPO•), in surface fixed electrocatalysts in real-time under flow conditions [80]. By synchronously recording cyclic voltammetry curves and EPR spectra, the order of magnitude matching relationship between electron transfer rate and catalytic efficiency was revealed, providing a new strategy for optimizing electrocatalyst interface design. The Radostina Stoyanova team has identified the correlation between free radical generation pathways and electrolyte decomposition mechanisms in lithium oxygen battery electrolytes through potential dependent analysis of EPR signals [81]. In addition, by combining with UV–vis spectroscopy, mass spectrometry, etc., EPR can provide more comprehensive information on reaction mechanisms. For example, Ai et al. coupled EPR with high-performance liquid chromatography (HPLC) to clarify the direct correlation between the 3e- ORR pathway and •OH generation [31]. EPR was used to confirm the type and relative intensity of ROS, while HPLC provided the quantification of •OH. The authors added benzoic acid (BA) into the solution, which reacted with •OH to generate three isomers of hydroxybenzoic acid (p-HBA, m-HBA, o-HBA). The concentration of p-HBA was determined by HPLC, and based on the product ratio of the three isotherms (1.2:2.3:1.7), the total •OH concentration was obtained. The authors also detected weakly adsorbed *H2O2 intermediates on the FeN4B-C surface through coupling EPR with in situ attenuated total reflection Fourier transform infrared (ATR-FTIR) spectroscopy, confirming that H2O2 rapidly dissociates into •OH after generation, rather than accumulating or desorbing. On the basis of using EPR to detect characteristic signals of superoxide radicals, Li et al. also used online differential mass spectrometry (ODMS) to measure the oxygen generation rate, which can indirectly reflect the kinetic reaction order of superoxide [82]. The above research indicates that the combination of EPR with other analytical techniques has enriched and deepened researchers' understanding of ORR from various perspectives.
2.4
Scanning electrochemical microscopy
Scanning electrochemical microscopy (SECM) is a powerful and versatile technique that detects local electrochemical reactions by scanning over the surface of a sample using microelectrodes [83–86]. It directly maps the density and distribution of active sites on the sample surface, monitors the current response in real time, and obtains key parameters such as reaction rate constants and diffusion coefficients [87]. SECM has shown great abilities for the in-situ detection of ROS formation during ORR. Chen et al. systematically studied the effects of different structures on the active site density and reaction kinetics of electrocatalysts in the ORR process in both acidic and alkaline systems [88–90]. As early as 2008, Bard et al. used SECM to investigate the mechanism of ORR in concentrated NaOH (1–12 mol/L), with a focus on the formation kinetics of O2•- and the influence of solution viscosity on diffusion behavior [91]. Subsequently, the focus shifted to quantitatively detecting the ORR hydrogen peroxide yield of different electrocatalysts using SECM. Compared with RRDE (collection efficiency of 20%−30%), SECM's substrate generation tip collection (SG/TC) mode has a collection efficiency of 43%−49%, significantly improving the detection accuracy of H2O2.
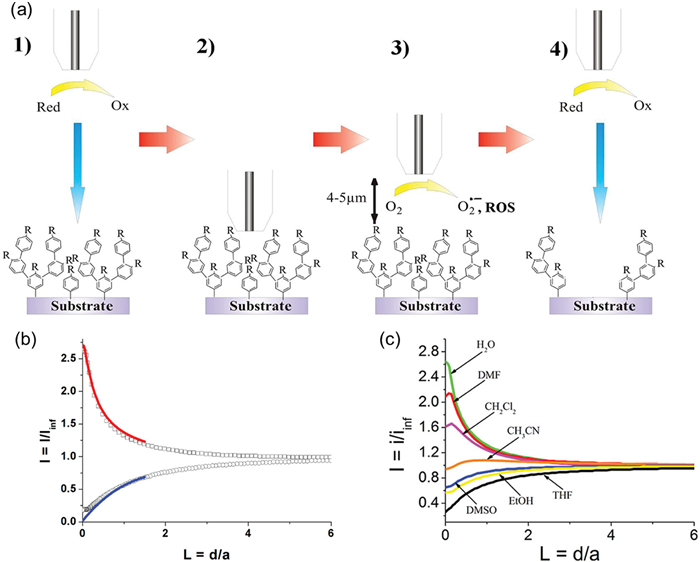
Based on previous research, Philippe Hapiot et al. directly observed the generation of •OH in the ORR of Pt electrodes for the first time, and revealed the shortcomings of the traditional 2e-/4e- model, proposing the 3e- pathway [92]. Researchers first electrophoretically graft aromatic polymers, such as polyaniline, with a thickness of about 10 nm onto the surface of glassy carbon (GC), forming a dense insulating film. Then, Pt microelectrodes (5 µm radius) were positioned on the substrate at approximately 3–20 µm to reduce O2 and generate ROS in a O2-saturated solution. Using ferrocenemethanol (FcCH2OH) as a probe molecule, substrate membrane damage was detected by SECM approach curve (Fig. 6a). The shape of the approach curve depends on the feedback effect on the mass transfer to the microelectrode. A negative potential was biased on the Pt microelectrode to trigger ORR and generate ROS, which then diffused to the substrate. If the substrate was an insulating organic layer, such as a polystyrene layer, ROS would attack the organic layer and destroy it, exposing the conductive glassy carbon substrate underneath. Once the conductive substrate was exposed, the redox mediator, FcCH2OH would undergo reverse reactions on the substrate, resulting in an enhanced mass transfer to the microelectrode. As shown in Fig. 6b, in the initial state, the organic layer hindered the FcCH2OH molecules from reaching the glassy carbon, and the substrate worked like an insulating substrate. As the probe got closer to the substrate, the diffusion of FcCH2OH molecules to the probe became more blocked by the presence of the substrate, resulting in a lower current was current, which is a typical negative feedback effect. After biasing a negative potential on the probe to destroy the organic layer, the FcCH2OH molecules can regenerate on the surface of the glassy carbon, leading to a higher probe current, which is a typical positive feedback effect. By adjusting the solvent type and pH, it can be concluded that the neutral aqueous phase and DMF have the highest •OH yield in the system, which causes the greatest damage to the insulation film, while THF and ethanol have almost no damage (Fig. 6c). This mechanism, which indirectly proves the existence of •OH through the destruction of organic membranes, provides sufficient experimental evidence for the author to propose the 3e- pathway, and also provides new ideas for evaluating the stability of electrocatalysts and designing anti ROS materials.
Figure 6
Figure 6.
(a) Principle of the radical footprint SECM analysis: (1 and 2) Positioning of the tip electrode near the modified surface; (3) Exposure of the surface to ROS production at the tip electrode; (4) Reading the surface with an indifferent redox probe. (b) SECM approach curves (Pt UME, a = 5 µm) on modified GC electrode (polyphenylene layer C) in 0.1 mol/L H2O/KPF6: before (○) and after (□) exposure to O2 reduction (2 × 10 s). FcCH2OH is used as a redox probe. Lines are the simulated curves for irreversible electron transfer kinetics. kel = 3.1 × 10⁻⁴ cm/s (blue line), 5.2 × 10⁻² cm/s (red line). d is the tip−substrate distance. (c) Approach curves using 1 mmol/L FcCH2OH as redox probe after exposure to O2 reduction (2 × 10 s) on a 5 µm radius disk Pt tip electrode in the different solvents. Reproduced with permission [92]. Copyright 2012, American Chemical Society.
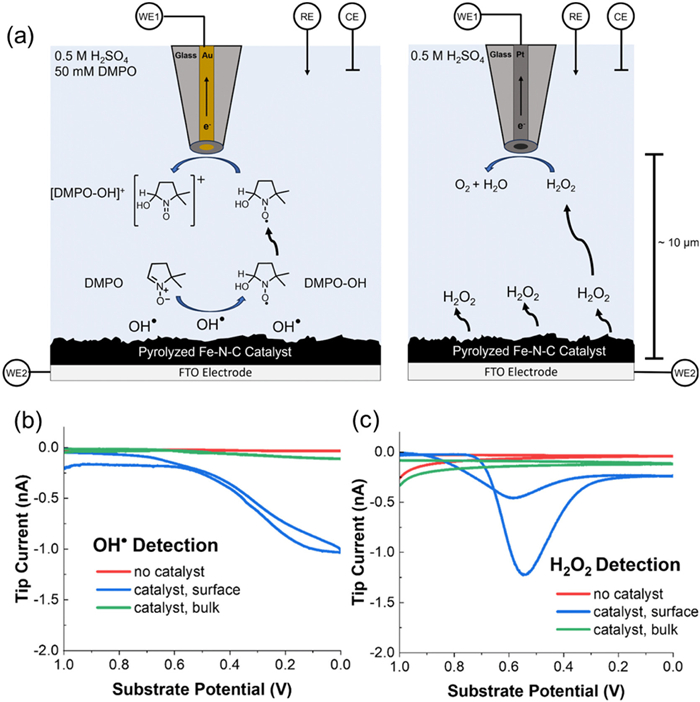
With the development of SECM technology, more short-lived ROS during the ORR process have been successfully detected recently. Rodríguez-López's team employed SECM in substrate generation/tip collection (SG/TC) mode, maintaining a tip-substrate distance of approximately 10 µm [93]. They added DMPO into the solution, forming the DMPO-•OH adducts and greatly expanded the lifetime of •OH, making the electrochemical detection possible. They detected DMPO-•OH adducts using a gold UME (d = 25 µm) and detected H2O2 using a platinum UME (d = 25 µm) (Fig. 7a). The findings revealed that as the potential on the substrate became increasingly negative, the •OH current value monotonically increased (Fig. 7b), suggesting its role as a byproduct or intermediate in the reaction. Meanwhile, the current of H2O2 detected on the UME peaked at 0.55 V (vs. Ag/AgCl) and was further reduced at higher overpotentials (Fig. 7c), correlating with the 2e- ORR pathway. Furthermore, the competitive mechanism explored by the researchers illustrated the consumption of H2O2 on the electrocatalyst surface, confirming its involvement in the redox cycle. This pioneering study, utilizing innovative SECM technology, achieved real-time detection of hydroxyl radicals during the ORR process, unveiling the intimate connection between the degradation mechanism of the Fe-N-C electrocatalyst and ROS generation. This discovery offers valuable insights for other electrocatalytic systems, such as CO2 reduction and oxygen evolution reactions.
Figure 7
Figure 7.
(a) The SG/TC mode for •OH detection using DMPO and for H2O2 detection. Left: Schematic depiction of substrate-generated •OH detection using the DMPO spin trap with a 25 µm diameter gold ultramicroelectrode as the tip biased to oxidize the DMPO–•OH adduct. Right: A depiction of the SECM H2O2 detection experiment using a platinum UME biased to perform H2O2 oxidation. (b) The radical SG/TC response at the gold tip as the substrate potential is swept at 10 mV/s with 25 mmol/L DMPO in solution. (c) The H2O2 SG/TC response on a Pt tip as the substrate potential is swept at 10 mV/s. Reproduced with permission [93]. Copyright 2024, Royal Society of Chemistry.
SECM, as a high spatial resolution electrochemical characterization technique, has shown unique advantages in detecting ROS in electrocatalytic ORR. However, the roughness or pore structure of the substrate electrode surface may lead to errors in controlling the probe-substrate distance, affecting the quantitative analysis of ROS concentration distribution. In order to overcome the above limitations, as early as 2009, Salazar et al. used flexible microelectrode probes to achieve SECM detection of rough, tilted, and large substrates in contact mode [94]. Furthermore, fluctuations in environmental humidity and temperature can exacerbate droplet evaporation, affecting the stability of SECM. Amemiya's team has developed a constant temperature chamber device that reduces the nanogap drift rate between the needle tip and substrate in SECM from 5–150 nm/min to 0.4 nm/min by suppressing thermal drift (temperature change rate ~0.2 mK/min), with a fluctuation standard deviation of ± 0.9 nm, significantly improving the stability of the nanogap [95]. This method solves the interference of environmental temperature on nanoscale measurements, providing key technical support for the high-precision application of SECM in single-molecule detection, dynamic analysis, and other fields, and is expected to be promoted to other scanning probe microscopy technologies. Tang et al. developed a temperature controlled SECM system, which integrates a temperature imaging module to monitor and compensate for the impact of temperature changes on droplet volume in real time [96]. In the future, combining super-resolution imaging and adaptive feedback control, SECM is expected to achieve synchronous resolution of nanometer level spatial resolution and millisecond level temporal resolution in complex systems, promoting the development of electrocatalytic ORR.
2.5
Electrochemiluminescence (ECL)
ECL is a phenomenon that triggers chemiluminescence through electrochemical reactions [97–99]. Under the action of potential, substances on the electrode surface undergo oxidation or reduction reactions, generating high-energy intermediates (such as free radicals or excited molecules). These intermediates release energy in the form of light when they return from the excited state to the ground state. Its primary advantage lies in its ultra-high sensitivity and ultra-low detection limit, reaching the pmol/L level, significantly surpassing other optical technologies such as fluorescence, Raman, chemiluminescence. Additionally, it exhibits low background interference, eliminating the need for external light source excitation and thus avoiding interference from light scattering and spontaneous fluorescence [100].
Recent studies have demonstrated the utility of ECL in detecting ROS generated during chemical reaction processes [101–104], particularly O2•- and •OH. The underlying principle involves exciting the chemiluminescence process of luminescent substances and co-reactants (such as ROS) through electrochemical reactions, thereby achieving high-sensitivity detection of ROS. Taking luminol as an example, its reaction mechanism with ROS is illustrated in formula [105]:
$\mathrm{AP}_2^{2-*} \rightarrow \mathrm{AP}_2^{2-}+h v
$
(15)
ROS (O2•- and •OH) were generated and accumulated by ORR. Then the luminol anion (LH−) is electrochemically oxidized to produce the luminol anion radical (L•−) (Eq. 13). Afterward, the L•− is oxidized to the excited state 3-amino phthalic acid anion (AP22-*) with the participation of ROS (Eq. 14). Finally, AP22-* returns to the base state and generates ECL emission (Eq. 15). Despite the development of numerous ECL luminescent reagents, including metal complexes, luminol, and nanomaterials [106]. Among them, luminol has expanded to include etherified and esterified luminol derivatives. Although there are many types of ECL emitters, luminol remains the most commonly used reagent for detecting ROS in the ORR field, with other reagents yet to be fully explored.
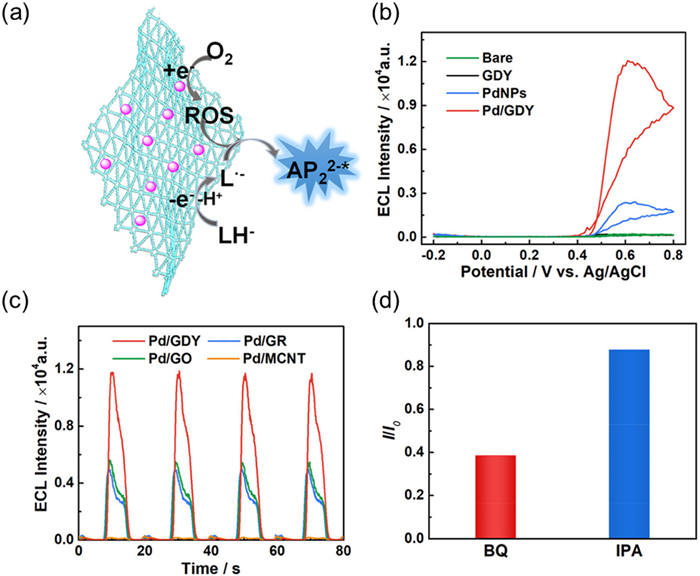
For example, Mao et al. used anodic ECL to investigate the enhancement effect of Pd nanoparticles/graphdiyne (Pd/GDY) in the luminol-O2 ECL system (Fig. 8a) [107]. Under neutral conditions, RRDE measurement showed that Pd/GDY mainly follows the four electron ORR pathway, with an electron transfer number of approximately 3.7 and a H2O2 yield of less than 20%. The author further compared the ECL performance of different carbon-based carriers (such as carbon nanotubes, graphene) loaded with Pd and found that Pd/GDY exhibited the best performance (Fig. 8, Fig. 8), indicating the generation of more ROS during the reaction process. Through free radical quenching experiments and fluorescence probe methods, it was confirmed that ROS (especially O2•-) is a key factor in ECL enhancement (Fig. 8d). This work provides a new strategy for the development of highly sensitive ECL sensors in neutral media and expands the application potential of GDY in catalysis and sensing fields.
Figure 8
Figure 8.
(a) Illustrated mechanism of Pd/GDY enhanced luminol-dissolved O2 ECL system. (b) ECL intensity-potential curve at bare, GDY-, PdNPs-, and Pd/GDY-modified GC electrodes in 0.1 mol/L phosphate buffer containing 0.25 mmol/L luminol (pH 7.4). (c) ECL intensity of Pd/GDY-, Pd/GR-, Pd/GO-, and Pd/MCNT-modified GC electrodes in 0.1 mol/L phosphate buffer containing 0.25 mmol/L luminol (pH 7.4). Potential range, −0.2 V to +0.8 V. Scan rate, 100 mV/s. (d) ECL intensity ratio before (I0) to after (I) the addition of free radical scavenger (1 mmol/L BQ or 1 mmol/L IPA) in 0.1 mol/L phosphate buffer containing 0.25 mmol/L luminol (pH 7.4). Reproduced with permission [107]. Copyright 2024, American Chemical Society.
Although several studies have successfully employed ECL to reflect the generation of ROS during the ORR process, and to differentiate the dynamic structure changes of electrocatalysts [108] according to the peak potential and intensity changes of the ECL signal [109], it is still limited in the extraction of ORR reaction kinetics.
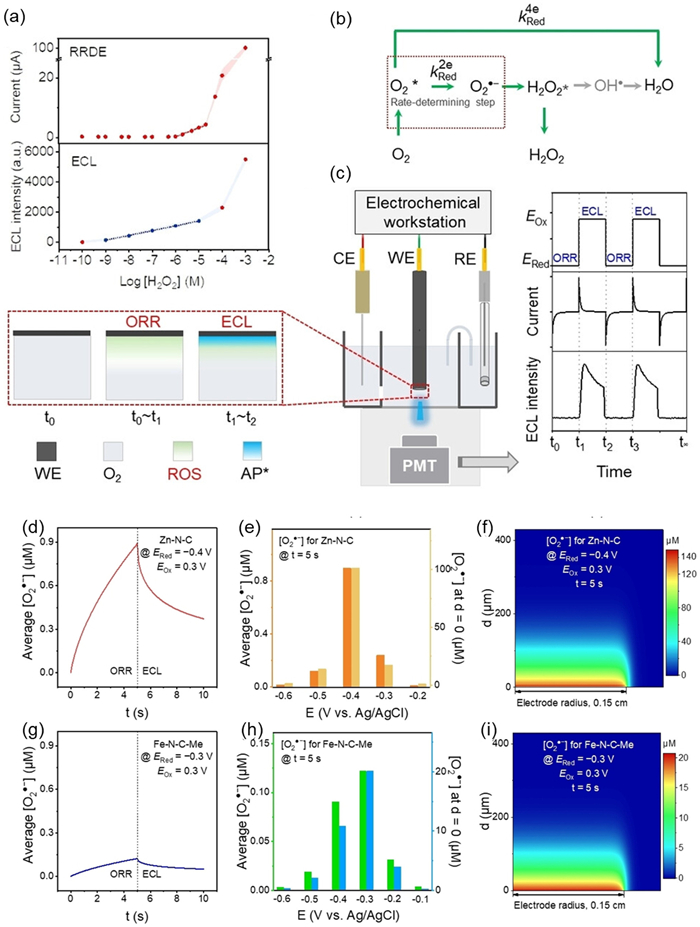
To tackle this problem, Zhang et al. quantitatively revealed the temporal spatial distribution of ROS in the diffusion layer for the first time, and the time-dependent ECL (Td-ECL) graph was innovatively created, providing a technique to extract ORR kinetics from ECL signals [110]. Firstly, to demonstrate the high sensitivity of ECL technology for ROS detection, a comparison was made between the current (red curve) measured by a rotating ring disk electrode (RRDE) and the ECL intensity (blue curve) as a function of log [H2O2] (logarithm of H2O2 concentration) (Fig. 9a). It was found that ECL is more effective in detecting low concentrations of H2O2. Secondly, the researchers demonstrated two reaction pathways of ORR (Fig. 9b), where the 2e- pathway involves the single electron reduction of O2 to generate O2•-, which further generate H2O2; the 4e- pathway is the direct reduction of O2 to H2O, and the reaction rates constant kRed2e and kRed4e for each step, as well as the rate determining step, are labeled in the Fig. 9b This stepwise pathway enables better differentiation of various ROS information during subsequent kinetic constant fitting. Fig. 9c shows a schematic diagram of the experimental setup, where the system is in an alkaline environment, using a three electrodes system and potential step method. The ORR is driven by applying a reduction potential (ERed) first. At this time, ROS accumulates in the electrolyte, and the current responds. Then, switching to the oxidation potential (EOx) triggers the ECL reaction between ROS and luminol, releasing blue fluorescence. PMT detects changes in ECL intensity, forming signal periods alternating with ORR. Based on the above principles, Td-ECL can be used to distinguish the types of electrocatalysts. Moreover, the kinetic about the potential-dependent time and spatial distribution of ROS in the diffusion layer were successfully derived for the first time from the Td-ECL decay curves by finite element analysis. For example, the article mentions that Zn-N-C electrocatalyst, as an electrocatalyst that mainly follows the 2e- pathway, has the highest O2•- concentration near the electrode surface at −0.4 V, and exponentially decays with distance and time (Fig. 9d and e), indicating that Zn-N-C generates more ROS during the ORR process. Furthermore, Fig. 9f clearly demonstrating the simulated concentration distribution of ROS in the diffusion layer; As an electrocatalyst that mainly follows the 4e- pathway, Fe-N-C significantly reduces the generation of O2•- on the electrode surface, thereby leaded to a reduced concentration of ROS during the ORR process (Figs. 9g–i). They preliminarily verified the unique information found in this study by evaluating the stability of electrocatalysts, providing guidance for optimizing fuel cell and H2O2 production, and suggesting that the kinetic information is expected to promote the development of highly active and stable ORR electrocatalysts.
Figure 9
Figure 9.
Principle and setup of ECL for ORR kinetics evaluation. (a) Responses to H2O2 at different concentrations using ECL and RRDE methods. Colored areas represent standard errors. (b) Reaction pathways of ORR in the modified Damjanovic model. (c) Brief setup of the Td-ECL method for ORR kinetics analysis and electrochemical/ECL signals at different time during Td-ECL measurement. The enlarged area and line charts show the distributions of dissolved O2, ROS, and Ap* in the diffusion layer. It is imperative to ensure that the counter electrode is adequately distanced from the gate of the PMT using suitable methods. (d, g) Plot of the average [O2•-] in the diffusion layer as a function of time, (e, h) histogram of [O2•-] in the diffusion layer under different potentials at the 5th second, and (f, i) cross-sectional view of the spatial distribution of [O2•-] at the 5th second for (d–f) Zn-N-C (ERed = 0.4 V, E0,2e = 0.38 V, and k0,2e = 6.75 × 104 cm/s) and (g–i) Fe-N-C-Me on GCE (ERed = 0.3 V, E0,2e = 0.27 V, and k0,2e = 2.75 × 105 cm/s). Reproduced with permission [110]. Copyright 2023, Wiley-VCH.
At present, ECL technique has become a core tool for the study of ROS intermediates in ORR due to its high sensitivity and dynamic monitoring capability. The first challenge faced by ECL technique is the difficulty of distinguishing ROS signals. Existing ECL probes (such as luminol) lack selectivity in responding to multiple ROS (O2•-, •OH, H2O2), and in many cases require clearance experiments or specific fluorescent probes to assist analysis. Secondly, in practical applications, electrode surface adsorbates or solution impurities may interfere with ECL signals. In recent years, researchers have developed various new ECL systems, such as nanomaterial based ECL probes, to improve detection performance. Liu et al. designed two different types of novel luminescent materials, CdZnS/SnIn4S8 heterojunction and Co3O4/CuO nanoenzyme, both of which showed certain improvements in ECL signal intensity [111]. The CdZnS/SnIn4S8 heterojunction serves as the cathodoluminescence, with sulfur vacancies (SVs) increasing electron traps, resulting in an ECL signal intensity approximately 8146 times higher than that of a single material. Upon receiving electrons at the cathode, CdZnS/SnIn4S8- is generated, which reacts with the •OH generated by the reduction of H2O2 to excite luminescence. Co3O4/CuO nanoenzyme, as an anode assisted luminescent material, contains oxygen vacancies (OVs, 41.64% content) that adsorb H2O2, generating O2•- and •OH, accelerating the oxidation luminescence of luminol. The anode signal is 2.47 times stronger than that of single luminol. These advances provide new tools for the study of interface active oxygen in electrocatalytic oxygen reduction. In the future, with the development of new ECL probes, the application of ECL technology in electrocatalytic oxygen reduction research will be more extensive and in-depth.
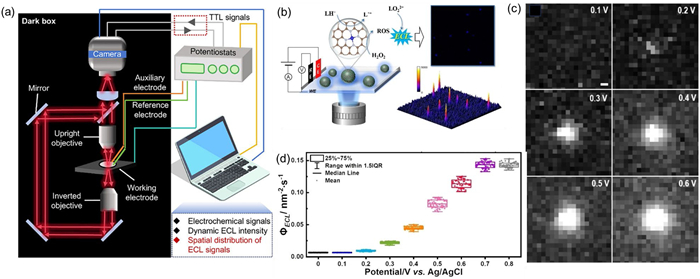
In addition to improving the efficiency of ECL emitters, a method for increasing spatial resolution has recently been developed: Electrochemiluminescence imaging, also known as electrochemiluminescence microscopy (ECLM), is a novel imaging method that combines ECL with high-resolution microscopy techniques to visualize chemical reactions and the distribution of biomolecules on electrode surfaces at the micrometer or nanometer scale [112–114]. The core principle is shown in Fig. 10a, and the detection process include ECL triggering and optical signal acquisition [115]. ECL triggering refers to the application of a specific potential on the electrode surface, initiating redox reactions and generating excited state substances (such as luminol radicals, Ru(bpy)3)2+*), and then releasing photons through radiative transitions; The process of optical signal acquisition employs charge-coupled devices (CCD) camera, electron multiplying CCD (EMCCD) cameras and scientific complementary metal-oxide-semiconductor (sCMOS) cameras to capture the luminescent signal. This procedure forms an image representing either the reactive activity or the distribution of target molecule on the electrode surface. ECL imaging modes can be divided into two categories: Static imaging and dynamic imaging. Static imaging is the use of fixed electrodes to obtain two-dimensional ECL intensity distribution through scanning probes or sample stages, for surface morphology or biomolecule localization. Dynamic imaging is real-time monitoring of ECL signals over time or potential changes, suitable for tracking cellular metabolic activity or drug release processes [116–118].
Figure 10
Figure 10.
(a) Scheme image of the typical upright and inverted ECL microscopy, including an electrochemical system and an imaging system. Reproduced with permission [115]. Copyright 2025, Wiley-VCH. (b) Schematic illustration of in situ imaging of SACs at single particle level via ECLM and ECL image and 3D ECL intensity diagram of individual SACs. (c) ECL image of single particle during cyclic voltammetry with scan rate of 10 mV/s, scale bar: 500 nm. (d) ΦECL calculated based on ECL emission photon counts at individual Fe-NC SACs versus potential. Reproduced with permission [121]. Copyright 2024, Wiley-VCH.
Static imaging is commonly used in the field of electrocatalysis. Chi et al. employed a bipolar electrode system to integrate the electrochemical reaction cell with ECL cell, investigating the correlation between the performance of ORR electrocatalysts and ECL imaging using ECL imaging technology [119]. According to the magnitude of the potential required for ECL imaging and the corresponding variations in light intensity, a relationship was established between the performance of the electrocatalyst and its corresponding ECL imaging performance. This method is expected to be applied to high-throughput screening of electrocatalysts. Chen et al. employed the ECLM to in situ visualize and analyze the heterogeneity of electrocatalytic activity on different facets at the subparticle level [120]. Using ZnO crystals with various exposed facet proportions as the model, they established the correlation between the electrocatalytic performance toward luminol analogue degradation and the exposed facets, revealing that the high electrocatalytic ORR activity on the ZnO surface is responsible for the ECL enhancement.
Zhao et al. first applied ECLM to the dynamic characterization of single atom electrocatalysts, providing a standardized evaluation method by correlating photon flux with catalytic efficiency (Fig. 10b) [121]. In a Britton Robinson (B-R) buffer solution at pH 10.0, consisting of 5.0 mmol/L 8-amino-5‑chloro-7-phenylpyrido [3,4-d]-pyridazine-1,4-[2H, 3H]‑dione (L012) and 2.0 mmol/L H2O2, the ECL emission of a single SAC at 0.3 V vs. Ag/AgCl can be clearly distinguished by capturing light spots with intensities greater than the ITO background (Fig. 10c). During the potential scanning process, real-time recording of the ECL signal of a single SAC shows that the reaction rate dynamically increases with the increase of potential. And the photon flux density (ΦECL) is expressed as:
where ∑Np is the total number of photons, A is the surface area of the electrocatalyst, and Δt is the exposure time. ΦECL is directly related to the electron transfer rate and can quantify the catalytic efficiency of individual SACs. Afterwards, cyclic voltammetry was used for potential scanning and the ECL signal of a single SACs was recorded in real-time using an EMCCD. The results showed that as the potential increased from 0 V to 0.8 V, the ΦECL intensity of Fe-NC gradually increased and reached its peak at 0.7 V (Fig. 10d), indicating that the catalytic reaction rate accelerated with the increase of potential. In addition, the initial potential of Fe-NC (0.16–0.18 V) is significantly lower than that of the traditional system (0.3 V), reflecting its excellent catalytic activity. Although ECLM is currently rarely used in electrocatalytic ORR, based on the above research, the authors present the prospects of ECLM for single particle kinetic studies of ORR, OER, HER and other reactions.
3.
Conclusions and perspectives
In the electrocatalytic ORR, the application of ROS detection technology faces different challenges. As is shown in Fig. 11, although fluorescent methods have selective response to specific ROS, the harsh conditions of strong acid/base, and the high temperature in the electrocatalytic system can easily cause instability or decomposition, limiting their direct application in ORR. As a fundamental analytical method, UV–vis can be combined with other techniques for qualitative and quantitative analysis, but its detection sensitivity and selectivity are poor, making it difficult to meet the requirements of low concentration complex systems. EPR technology can achieve specific detection in ROS detection, but due to its high detection limit and low time resolution of traditional techniques, it is difficult to capture real-time generation and decay signals of low concentration transient free radicals (such as nanosecond lifetime •OH). SECM has high spatial resolution, but the roughness or the porous structure of the substrate makes it challenging to precisely control the probe-substrate distance, affecting the quantitative analysis. In addition, fluctuations in environmental temperature and humidity can exacerbate droplet evaporation and interfere with detection stability. ECL technology has become a core tool for studying ROS intermediates in ORR due to its high sensitivity and dynamic monitoring capabilities. However, existing ECL probes (such as luminol) lack selectivity in responding to various ROS, and electrode surface adsorbates or solution impurities can easily interfere with the signal. Both fluorescence imaging and ECLM techniques can provide heterogeneity of ROS at the single-molecule level, but their applications are still in the early stages.
Figure 11
Figure 11.
Detection and evaluation methods of free ROS in electrocatalytic ORR process.
The detection sensitivity, spatial resolution, temporal resolution and selectivity of various detection methods are summarized in Table 1 [41,42,45,54,58,59,62,71,77,79,85,93,100,112,121,122]. It can be seen that ECL and ECLM technologies have the most advantages in sensitivity. SMFM, SECM, and ECLM perform better in spatial resolution, with SMFM and ECLM also showing advantages in temporal resolution. In addition, apart from ECL and ECLM, most technologies can achieve specific detection of ROS. Future efforts should focus on overcoming the limitations of individual technologies. By integrating in-situ EPR, UV–vis and SECM-ECL technologies, precise detection and mechanism analysis of ROS in ORR can be achieved. In addition, it is imperative to develop new materials such as corrosion-resistant probes and nanosensors.
Table 1
Table 1.
Comparison of analytical methods for ROS in ORR.
Although the above-mentioned technologies have significantly improved the level of ROS detection, they still face challenges and opportunities. This article also summarizes the limitations and corresponding solutions of each technological approach. Firstly, in terms of probe optimization, it is necessary to develop probes resistant to harsh environments, i.e., strong acids/bases and high temperatures, such as novel fluorescent probes, flexible SECM probes, and novel ECL emitters, to address the specificity and stability issues of existing methods. Secondly, in terms of dynamic and in situ detection, techniques such as in situ electrochemical EPR and high-speed ECL imaging can be further developed to capture the generation and decay process of nanosecond transient ROS, and combined with theoretical calculations (such as DFT) to reveal the microscopic dynamics of intermediate evolution. In the future, with the integration of interdisciplinary technologies such as nanotechnology, biotechnology, and electrochemistry, ORR interface ROS detection will develop towards higher sensitivity, higher spatial resolution, and real-time dynamic monitoring, providing key support for breakthroughs in clean energy technology.
Declaration of competing interests
The authors declare that they have no known competing financial interests or personal relationships that could have appeared to influence the work reported in this paper.
This work was supported by the National Key Research and Development Program of China (No. 2024YFE0112500), National Natural Science Foundation of China (Nos. 22174014, 22474018, 22102025 and 22404018), Natural Science Foundation of Jiangsu Province (No. BK20241270), China Postdoctoral Science Foundation (No. 2023M740595), Postdoctoral Fellowship Program of CPSF (No. GZC20230427), and Jiangsu Funding Program for Excellent Postdoctoral Talent (No. 2023ZB353).
Y.C. Kong, D. Ye, C.H. Xu, et al., Angew. Chem. Int. Ed. 63 (2024) e202318748. doi: 10.1002/anie.202318748
[122]
Y. Xiao, J. Hong, X. Wang, et al., J. Am. Chem. Soc. 142 (2020) 13201–13209. doi: 10.1021/jacs.0c06020
Figure 1
(a) Chemical structures of DCFH-DA, DCFH and DCF. Reproduced with permission [43]. Copyright 2021, Elsevier. (b) In situ fluorescence spectroelectrochemistry performed at a constant potential in O2 saturated 0.1 mol/L KOH containing 2.5 µmol/L DCFH-DA for 10 min (from bottom to top). (c) I–t curve of ORR on CPG-900 at 0.849 V vs. RHE. The electrolyte is 0.01 mol/L KOH dissolved in 1:1 (v/v) water/ethanol solution with saturated air. The red arrow denotes the addition of 12.5 µmol/L DCDHF into the electrolyte, showing an abrupt decrease in reduction current due to the competitive chemical reaction of oxygen containing intermediate (OCI) with DCFH-DA to the electrochemical reaction by receiving electrons from CPG-900. Reproduced with permission [44]. Copyright 2014, Nature Publishing Group. (d) Scheme of the conversion from non-fluorescent coumarin to fluorescent 7‑hydroxyl-coumarin by •OH generated in ORR on Fe/N/C electrocatalyst (color online). (e) Comparison of the ring currents from H2O2 oxidation with the fluorescence intensity induced by •OH (color online). Reproduced with permission [45]. Copyright 2019, Springer Nature.
Figure 2
(a) Bifunctional catalysis of Fe3O4 NPs for the Study of 2e- ORR process at the single-particle level: Reaction-I, the electrocatalysis of Fe3O4 NPs for ORR; Reaction-II, the catalysis of Fe3O4 NPs for amplex red oxidation by H2O2 to produce fluorescent resorufin. (b) Typical fluorescence intensity vs. time trajectory of a single Fe3O4 nanoparticle with 10 µmol/L amplex red and O2-saturated 5 mmol/L pH 8.5 phosphate buffer at −0.6 V. Time resolution: 100 ms. (c) Kinetics study of Fe3O4 nanoparticle-catalyzed oxidative amplex red reaction. Reproduced with permission [54]. Copyright 2020, American Chemical Society.
Figure 3
(a) Top: Reaction between ROS and ABTS; bottom: photographs showing the color change of the solution after the Fenton reaction. (b) UV–vis absorption spectra of 0.1 mol/L HClO4 solutions of only ABTS, Cr/N/C-950 and ABTS, H2O2 and ABTS, Fe/N/C-950 and ABTS, Cr/N/C-950, H2O2 and ABTS, Fe/N/C-950, as well as H2O2 and ABTS after 7 min reaction. Reproduced with permission [57]. Copyright 2019, Wiley-VCH. (c) ROS generated during the ORR process for Fe-containing DACs and reference samples, as quantified by ABTS coloration. Reproduced with permission [58]. Copyright 2023, American Chemical Society. (d) The cerium sulfate titration method for determining the H2O2 concentration. Reproduced with permission [59]. Copyright 2021, American Chemical Society. (e) A standard curve correlating Ce4+ concentration with absorbance by measuring the absorbance at 319 nm. (f) Comparison of H2O2 yield rate (mmol gcat−1 h−1) with other reported literature under alkaline condition (0.1 mol/L KOH) in H-cells. Reproduced with permission [60]. Copyright 2024, Nature Publishing Group.
Figure 4
(a) EPR spectra in different systems. (b) EPR spectra without O2 or applying potential. (c) Electron transfer number in the RRDE measurements for CoSe2/C, Cu-CoSe2/C, and Cu/CoSe2/C systems. Reproduced with permission [76]. Copyright 2024, Elsevier. (d) EPR spectra in BR buffer solution containing DMPO with and without methanol. (e) Collection of CV curves on Pt UME tip by applying −0.4 V on the SACs modified ITO-electrode in DMPO and BR buffer solution (pH 10.0). (f) ECL intensity of Fe-N-C, Ni-N-C, and Cu-N-C SACs in 0.1 mmol/L luminol-dissolved O2 ECL system (PMT = 400 V). Reproduced with permission [77]. Copyright 2024, American Chemical Society.
Figure 5
(a) Schematic diagram of the in situ EPR system. (b) In-situ EPR spectra three kinds of catalytic H2O2 production by BiOBr with abundant oxygen vacancies (BOB-OV). Reproduced with permission [79]. Copyright 2024, Wiley-VCH.
Figure 6
(a) Principle of the radical footprint SECM analysis: (1 and 2) Positioning of the tip electrode near the modified surface; (3) Exposure of the surface to ROS production at the tip electrode; (4) Reading the surface with an indifferent redox probe. (b) SECM approach curves (Pt UME, a = 5 µm) on modified GC electrode (polyphenylene layer C) in 0.1 mol/L H2O/KPF6: before (○) and after (□) exposure to O2 reduction (2 × 10 s). FcCH2OH is used as a redox probe. Lines are the simulated curves for irreversible electron transfer kinetics. kel = 3.1 × 10⁻⁴ cm/s (blue line), 5.2 × 10⁻² cm/s (red line). d is the tip−substrate distance. (c) Approach curves using 1 mmol/L FcCH2OH as redox probe after exposure to O2 reduction (2 × 10 s) on a 5 µm radius disk Pt tip electrode in the different solvents. Reproduced with permission [92]. Copyright 2012, American Chemical Society.
Figure 7
(a) The SG/TC mode for •OH detection using DMPO and for H2O2 detection. Left: Schematic depiction of substrate-generated •OH detection using the DMPO spin trap with a 25 µm diameter gold ultramicroelectrode as the tip biased to oxidize the DMPO–•OH adduct. Right: A depiction of the SECM H2O2 detection experiment using a platinum UME biased to perform H2O2 oxidation. (b) The radical SG/TC response at the gold tip as the substrate potential is swept at 10 mV/s with 25 mmol/L DMPO in solution. (c) The H2O2 SG/TC response on a Pt tip as the substrate potential is swept at 10 mV/s. Reproduced with permission [93]. Copyright 2024, Royal Society of Chemistry.
Figure 9
Principle and setup of ECL for ORR kinetics evaluation. (a) Responses to H2O2 at different concentrations using ECL and RRDE methods. Colored areas represent standard errors. (b) Reaction pathways of ORR in the modified Damjanovic model. (c) Brief setup of the Td-ECL method for ORR kinetics analysis and electrochemical/ECL signals at different time during Td-ECL measurement. The enlarged area and line charts show the distributions of dissolved O2, ROS, and Ap* in the diffusion layer. It is imperative to ensure that the counter electrode is adequately distanced from the gate of the PMT using suitable methods. (d, g) Plot of the average [O2•-] in the diffusion layer as a function of time, (e, h) histogram of [O2•-] in the diffusion layer under different potentials at the 5th second, and (f, i) cross-sectional view of the spatial distribution of [O2•-] at the 5th second for (d–f) Zn-N-C (ERed = 0.4 V, E0,2e = 0.38 V, and k0,2e = 6.75 × 104 cm/s) and (g–i) Fe-N-C-Me on GCE (ERed = 0.3 V, E0,2e = 0.27 V, and k0,2e = 2.75 × 105 cm/s). Reproduced with permission [110]. Copyright 2023, Wiley-VCH.
Figure 10
(a) Scheme image of the typical upright and inverted ECL microscopy, including an electrochemical system and an imaging system. Reproduced with permission [115]. Copyright 2025, Wiley-VCH. (b) Schematic illustration of in situ imaging of SACs at single particle level via ECLM and ECL image and 3D ECL intensity diagram of individual SACs. (c) ECL image of single particle during cyclic voltammetry with scan rate of 10 mV/s, scale bar: 500 nm. (d) ΦECL calculated based on ECL emission photon counts at individual Fe-NC SACs versus potential. Reproduced with permission [121]. Copyright 2024, Wiley-VCH.

 DownLoad:

 下载:
下载:


 下载:
下载:
