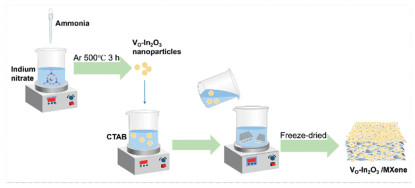
Figure 1.
Schematic diagram of VO-In2O3/MXene synthesis.

Oxygen vacancy-rich In2O3/V2CTx MXene heterojunction: Interface engineering enables ultra-sensitive room-temperature Cl2 sensing
Guangji Zhang , Ziwei Zhang , Weixiao Hou , Jifan Hu , Kewei Zhang , Zhigang Sun , Jiangwei Ma


Chlorine (Cl2) is a highly toxic gas with a pungent, irritating odor, widely used in industrial production of products (e.g., bleaching agents) [1]. However, its leakage poses severe health risks [2,3]. Thus, developing high-performance Cl2 sensors is urgently needed for safety monitoring [4]. There are numerous detection methods for Cl2, such as gas chromatography [5], optical gas sensors [6] and impedance gas sensors [7]. Among them, metal oxide semiconductor (MOS) gas sensors have attracted the attention of researchers due to their low cost. Common Cl2 sensing materials include SnO2 [8], WO3 [9], CuO [10], and In2O3 [11]. Among these, In2O3 (an n-type semiconductor) stands out due to its wide band gap and excellent gas adsorption properties [12]. But several critical challenges remain in developing practical Cl2 sensors. First, high operating temperature (≥300 ℃) remains a bottleneck for most MOSs-based Cl2 sensors [11], because high energy consumption restricts use in low-power devices. Second, insufficient active sites restrict sensing performance. Conventional MOSs synthesis methods yield low concentrations of oxygen vacancies, which are well-documented as critical active sites for Cl2 adsorption and charge transfer during sensing [12].
Currently, to overcome the high operating temperature of pure MOSs and poor electrical conductivity, heterojunction strategies have been explored. For instance, SnO2/In2O3 [13] and WO3/In2O3 [14] heterostructures exhibit improved performance, but they still require elevated temperatures (e.g., Li et al. reported SnO2/In2O3 nanoparticles for Cl2 detection that operate at 260 ℃ [15]. To enhance the sensitivity of Cl2 gas-sensing materials, the template method is commonly used to prepare materials with high activity. For example, Ma et al. prepared In2O3 nanosheets using melamine-formaldehyde (MF) sponge as the template and the operating temperature of In2O3 nanosheets sensor is 200 ℃ [16]. However, gas-sensing materials prepared by the template method usually have a relatively large particle size and are not suitable for composite preparation. Although current research has reduced the operating temperature, it still remains at a relatively high level (≥200 ℃), which makes the development of Cl2 gas sensors operating at room temperature extremely urgent.
Recently, MXene-based composites have emerged as a breakthrough in room temperature gas sensing, because of high electrical conductivity, layered structure, and abundant surface functional groups. For example, Zhang et al. developed a V2CTx/SnS2 composite for room temperature NO2 detection [17], and Majhi et al. reported a V2C/V2O5 sensor for room temperature acetone detection [18]. The synergy between MXene (which inhibits nanoparticle aggregation) and MOS nanoparticles (which increase specific surface area) enhances sensing performance. Although MXenes can operate effectively at room temperature, existing MXene-based gas sensors mainly target gases like nitrogen dioxide (NO2) or acetone [17,18], while few studies have focused on Cl2. In this work, a VO-In2O3/MXene heterojunction sensor with abundant oxygen vacancies was developed, which exhibits high gas-sensing performance towards Cl2 at room temperature. The VO-In2O3/MXene heterojunction sensor achieves 22.85% response to 0.5 ppm Cl2 at room temperature, with a detection limit as low as 1.05 ppb. The adopted technologies, such as oxygen vacancy engineering, CTAB modification, n-n heterostructure design, electrostatic assembly, provide insights for the research on other high-performance room-temperature gas sensors.
Reagent information and characterization methods are described in Supporting information. Indium nitrate (6.016 g) was dispersed in 88 mL of deionized water under magnetic stirring. Then aqueous NH3·H2O was added dropwise until the pH reached approximately 10. The precipitate was then washed three times with anhydrous ethanol and dried overnight. Finally, it was calcined under an argon environment at 350 ℃ for 2 h to obtain VO-In2O3 nanocrystals. A comparative sample was heat-treated in air for 2 h to obtain In2O3 nanocrystals.
NaF (1 g) was initially dissolved in 10 mL of dilute hydrochloric acid (6 mmol) to prepare the etching solution. Subsequently, 1 g of V2AlC was gradually introduced into the etching solution. After 30 min of ultrasonic treatment, the solution was transferred to a 100 mL autoclave and heated at 90 ℃ for 72 h. The obtained black precipitate was rinsed with water, centrifuged, and dried after the pH was close to neutral. Next, 0.6 g of the product were dispersed in 20 mL of DMSO and stirred for one day. The solution was centrifuged, washed with deionized water, and freeze-dried again. Finally, 0.3 g of the product were neutralized with 10 mL of NaOH (50 mmol) and stirred for 2.5 h. After washing, centrifugation, and drying, V2CTx MXene was obtained.
To make the VO-In2O3/MXene composite, 0.667 g of CTAB was mixed in 22 mL of deionized water, and then 0.075 g of VO-In2O3 nanocrystals was added. The mixture was stirred for 30 min. Next, 0.3 g of MXene was dissolved in 60 mL of water and sonicated for 30 min under nitrogen protection. Then mix the above two solutions and stir them for another 30 min under nitrogen protection. Finally, VO-In2O3/MXene (25%) was prepared after washing and drying. For the other mixtures, the amount of VO-In2O3 nanocrystals was changed to 0.15 g for VO-In2O3/MXene (50%) and 0.225 g for VO-In2O3/MXene (75%).
The gas sensor was prepared by mixing the material and the water, which was then uniformly applied to a platinum electrode. To enhance reliability, the completed sensor elements were aged for 7 days. Gas testing was conducted using equipment (CGS-MT, Sino Aggtech, Beijing, China). The gas response value (S) is defined as |Rg - Ra|/Ra × 100%, where Rg and Ra represent the resistance values in gas and air, respectively. The response time is the duration required for the sensor to reach 90% of the maximum resistance change value during the test. Similarly, the recovery time is 90% of the time required for the resistance to change from its maximum value to its stable value Ra. Performance tests were conducted at room temperature (25 ℃), and all measurements were taken under relative humidity conditions except for humidity tests. The basic analysis formula for BET is as follows [19,20]:
|
|
(1) |
where P denotes the partial pressure of N2; P0 denotes the saturated vapor pressure of N2; V denotes the actual adsorption capacity of N2; Vm denotes the saturated adsorption capacity of N2; C denotes a constant related to adsorption capacity. Detailed formulas for calculating liquid and gas concentrations can be found in Supporting information.
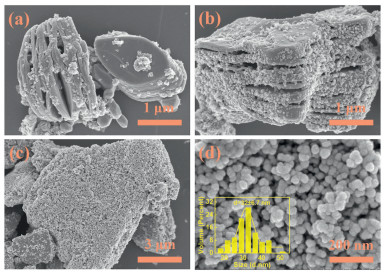
The VO-In2O3/MXene synthesis is shown in Fig. 1. VO-In2O3 synthesized via thermal treatment under an argon atmosphere is surface-modified by the cationic surfactant CTAB in an aqueous solution. The surface of VO-In2O3 nanoparticles undergoes hydroxylation (In-OH), which dissociates H+ under neutral pH conditions, forming a negatively charged surface (In-O−) [21]. The positively charged headgroups of CTAB adsorb onto the VO-In2O3 surface via coulombic forces, neutralizing the negative charge [22]. The CTAB-coated VO-In2O3 nanoparticles are then dispersed in an MXene colloidal solution, where they attract each other through charge neutralization. The hydrophobic tails of CTAB, in tandem with van der Waals forces between MXene layers, synergistically promote the directional anchoring of VO-In2O3 particles onto the MXene surface via electrostatic attraction, thereby forming stable heterojunctions [23]. To observe the microstructure of the prepared materials and the composite effects, SEM characterization was conducted on V2CTx MXene, VO-In2O3, VO-In2O3/MXene (25%), VO-In2O3/MXene (50%), and VO-In2O3/MXene (75%) materials. Figs. 2a-c show the SEM images of VO-In2O3/MXene (25%), VO-In2O3/MXene (50%), and VO-In2O3/MXene (75%) materials, respectively. VO-In2O3 is uniformly distributed to varying degrees on the surface of MXene. The VO-In2O3 and MXene are well integrated. Additionally, with the increasing ratio of VO-In2O3 in the composite, the number of nanoparticles attached to the MXene surface also gradually increases. The SEM images of V2CTx MXene are shown in Fig. S2 (Supporting information). The SEM results confirm the successful preparation of the VO-In2O3/MXene composite materials. As shown in Fig. 2d, VO-In2O3 consists of small individual particles with an average diameter of 32 ± 6.7 nm, while the diameter of agglomerated particles is approximately 110.3 nm (Fig. S1a in Supporting information). The particle size of CTAB-treated VO-In2O3 is measured to be about 99.8 nm (Fig. S1c in Supporting information), slightly smaller than that of the untreated agglomerated particles. The reason for the reduction in particle size may be related to zeta potential. However, this will not lead to significant differences in the composite results. Further studies show that after treatment with CTAB surfactant, the measured zeta potential of VO-In2O3 increases from +9.04 mV to +23.7 mV (Figs. S1b and d in Supporting information). This value indicates that the particles have a certain anti-agglomeration ability and can form good electrostatic assembly with V2CTx MXene, which has abundant negatively charged functional groups (-OH, -COOH).
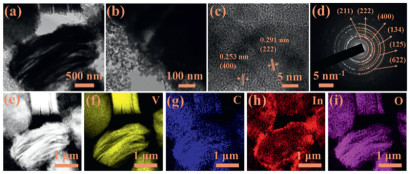
TEM was employed for further observation of the materials. Fig. 3 shows the TEM images of VO-In2O3/MXene (75%). Figs. 3a and b reveal the layered structure of MXene, with uniform-sized VO-In2O3 nanoparticles attached to the surface of MXene, consistent with the SEM results. Fig. 3c presents an HRTEM lattice image, where clear lattice fringes are observed. The lattice fringes of 0.291 nm and 0.253 nm correspond to the (222) and (400) planes of the cubic In2O3 crystal, respectively. Fig. 3d shows the selected area electron diffraction (SAED) pattern, indicating that VO-In2O3/MXene (75%) is polycrystalline. The diffraction rings match the (211), (222), (400), (134), (125), and (622) planes of In2O3 [24]. Figs. 3d-i show the high-angle annular dark-field (HAADF) images and the elemental mappings of V, C, In, and O. The uniform distribution of these four elements across VO-In2O3/MXene (75%) suggests that VO-In2O3 is successfully incorporated with MXene.
To further investigate the crystal structure of the materials, XRD characterization was conducted on VO-In2O3, In2O3, VO-In2O3/MXene (25%), VO-In2O3/MXene (50%), VO-In2O3/MXene (75%), and MXene. As shown in Fig. 4a, the peaks of VO-In2O3 and In2O3 correspond to the standard PDF #89–4595 of In2O3, with no other impurity peaks observed, indicating that the prepared VO-In2O3 and In2O3 nanoparticles are of pure phase [12]. In the XRD pattern of MXene, the (002) and (103) planes correspond to the standard PDF #29–0101 of V2AlC [25]. Additionally, the shift of (002) (representing the interlayer diffraction peak) to a lower angle and the significant weakening of the (103) peak in multilayer V2CTx MXene indicate that the V2CTx MXene material has been successfully prepared [25,26]. In the etching of MAX phase, both layer-by-layer etching and core-shell etching proceed from the surface to the interior [27]. After etching, the solution turns dark green (V3+), as shown in Fig. S3 (Supporting information), indicating sufficient etching. VO-In2O3 and V2CTx MXene can form effective heterojunctions on the surface. From the data, it can be seen that with the increasing VO-In2O3 doping content, the intensity of the corresponding In2O3 diffraction peaks gradually increases. This indicates the successful incorporation of VO-In2O3 nanoparticles with MXene, confirming the successful preparation of VO-In2O3/MXene (25%), VO-In2O3/MXene (50%), and VO-In2O3/MXene (75%).
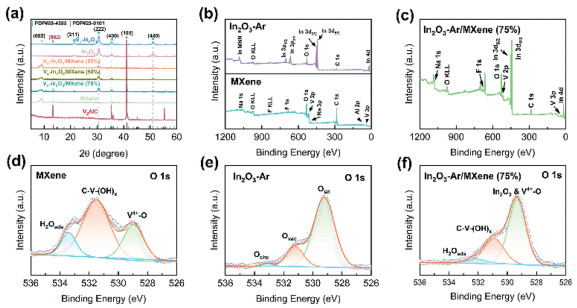
For a deeper exploration of the material surface chemical properties, XPS analysis was performed. Fig. 4b illustrates the full XPS spectra profiles of VO-In2O3 together with MXene. Analysis shows that the spectra only feature characteristic peaks for In, O, and C, with the C signal attributed to an additional carbon source used in the calibration process. This indicates that the prepared VO-In2O3 is pure. In addition, the XPS spectrum of MXene shows peaks for V, O, and C, along with Na, F, and Al. The presence of Na and F is attributed to the etching agents used, while Al arises from ions or corresponding compounds formed after etching V2AlC, consistent with previously reported phenomena [28]. Fig. 4c presents the full XPS spectrum of VO-In2O3/MXene (75%), which reveals the existence of V, C, In, and O. These elements correspond to MXene and VO-In2O3, confirming the successful composite formation of the two materials. The O 1s spectral profile of MXene in Fig. 4d splits into three peaks located at 529.8, 531.4, and 533.0 eV, with these corresponding to V4+-O, C-V-(OH)x, and H2Oads in sequence [29]. Fig. 4e presents the O 1s spectrum of VO-In2O3, consisting of three peaks: The peak at 529.3 eV corresponds to lattice oxygen (Olat) in VO-In2O3, the peak at 531.2 eV is associated with oxygen vacancies (Ovac), and the peak at 533.1 eV is related to chemisorbed oxygen (Oche) [30]. Fig. 4f shows the O 1s spectrum of VO-In2O3/MXene (75%), with a characteristic peak at 529.60 eV, representing In-O(Ⅲ) from VO-In2O3 and V4+-O from MXene. Peaks at 531.20 eV and 533.0 eV match C-V-(OH)x and H2Oads, respectively. The presence of the In-O(Ⅲ) bond confirms the effective composite formation of VO-In2O3 with MXene.
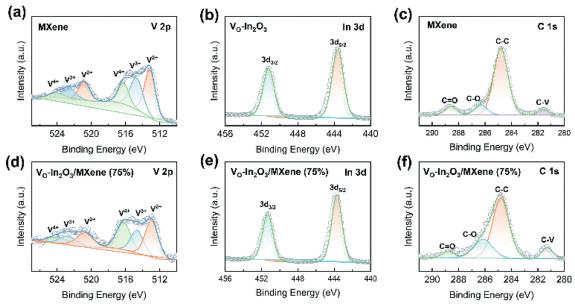
Fig. 5 shows the high-resolution XPS spectra. Fig. 5a displays the V 2p spectrum of MXene, where the peaks for V2+ are located at 512.9/520.5 eV, V3+ at 514.0/523.2 eV, and V4+ at 516.1/524.9 eV [31]. The absence of a V5+ peak indicates that the material has undergone alkali treatment. Fig. 5d presents the V 2p spectrum of VO-In2O3/MXene (75%), with V2+ peaks at 513.5/521.3 eV, V3+ peaks at 515.3/523.1 eV, and V4+ peaks at 516.0/524.5 eV. The In 3d spectrum for VO-In2O3 in Fig. 5b reveals that In 3d5/2 gives a peak at 444.3 eV, with In 3d3/2 showing a peak at 451.9 eV. Fig. 5e displays the In 3d spectrum of VO-In2O3/MXene (75%), with In 3d5/2 at 444.2 eV and In 3d3/2 at 451.6 eV, indicating the successful incorporation of VO-In2O3 nanoparticles with MXene. Figs. 5c and f display the C 1s spectral profiles of MXene alongside VO-In2O3/MXene (75%), in sequence. In the C 1s spectrum of MXene, four peaks are observed corresponding to V-C (282.1 eV), C—C (284.5 eV), C—O (286.3 eV), and C=O (288.5 eV) [32,33]. In the C 1s spectrum of VO-In2O3/MXene (75%), the V-C peak is located at 282.5 eV, C—C at 284.4 eV, C—O at 286.3 eV, and C=O at 288.5 eV. There are no significant differences between the C 1s spectra of MXene and VO-In2O3/MXene (75%).
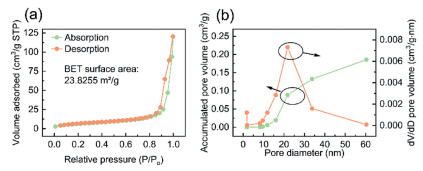
To investigate the specific surface area properties of the materials, nitrogen adsorption-desorption measurements were conducted on the VO-In2O3/MXene (75%) material. From Fig. 6 and Fig. S4 (Supporting information), it is observed that the specific surface area of VO-In2O3/MXene (75%) reaches 23.8255 m2/g, markedly higher in comparison to those of the MXene material (12.72 m2/g). A greater specific surface area contributes to stronger gas adsorptive ability, thereby facilitating the enhancement of gas sensing properties [34]. The average pore diameter of VO-In2O3/MXene (75%) was 20.2556 nm, with a cumulative pore volume of 0.1862 cm3/g. According to the IUPAC definition and classification, the pore size of VO-In2O3/MXene (75%) is categorized as mesoporous [35].
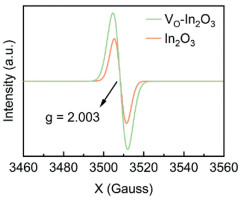
To investigate the oxygen vacancies in the materials, EPR spectroscopy was used to analyze In2O3 and VO-In2O3 materials. As shown in Fig. 7, both In2O3 and VO-In2O3 exhibit a prominent peak at g = 2.003, which corresponds to the characteristic signal of oxygen vacancies [36]. It can be observed that the peak for VO-In2O3 is higher than that of In2O3, suggesting that VO-In2O3 contains a greater density of oxygen vacancies. This elevated oxygen vacancy density in VO-In2O3 can be attributed to the calcination conditions in argon. In an argon atmosphere, the low oxygen partial pressure generated during high-temperature calcination inhibits oxygen re-adsorption on the material, thus facilitating the elimination of oxygen atoms from the lattice along with the generation of oxygen vacancies [37,38].
For exploring the gas-sensing performance of the synthesized samples, Cl2 was selected as the test substance. Figs. 8a-d show the real-time resistance change curves of MXene, VO-In2O3/MXene (25%), VO-In2O3/MXene (50%), and VO-In2O3/MXene (75%) materials to 0.5 ppm Cl2 at 25 ℃ and 17% relative humidity (RH). From Fig. 8a, MXene shows a response of 0.21% to 0.5 ppm Cl2. Fig. S5 (Supporting information) presents the response of VO-In2O3 to 0.5 ppm Cl2. Although the average response is high at 154.95%, VO-In2O3 suffers from an initial resistance that is too high and unstable response values. In Fig. 8b, it can be observed that VO-In2O3/MXene (25%) demonstrates a more stable gas response, with an average response value of 2.81%. Fig. 8c shows the gas response resistance curve of VO-In2O3/MXene (50%), where the gas response is stable and the recovery is good, with an average response value of 4.66%. Fig. 8d shows the gas response resistance curve of VO-In2O3/MXene (75%) composite material to 0.5 ppm Cl2. The average response value of In2O3/MXene (75%) is 22.85%, exceeding that of VO-In2O3/MXene (25%) and VO-In2O3/MXene (50%) composites, while also demonstrating superior recovery performance.
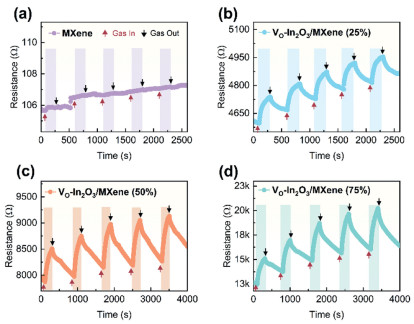
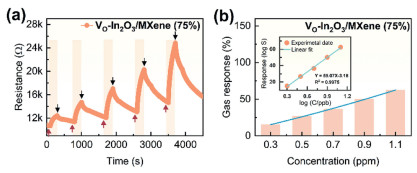
Fig. 9a shows the curves of VO-In2O3/MXene (75%) to various concentrations of Cl2 (0.3, 0.5, 0.7, 0.9, and 1.1 ppm) at 17% RH and room temperature. Fig. 9b shows the bar chart of the response values of VO-In2O3/MXene (75%) to different Cl2 concentrations at 17% RH and room temperature. It can be observed that as the Cl2 concentration increases, the response of VO-In2O3/MXene (75%) gradually strengthens. Cl2 molecules acquire electrons on the sensor surface. As Cl2 concentration rises, its capacity for electron transfer on the sensor surface is strengthened. Cl2 exhibits strong oxidizing properties and thereby acquires electrons. The surface of the VO-In2O3/MXene (75%) sensor loses electrons, increasing the surface depletion layer, an increase in resistance, and an increase in response value [39]. Fig. 9b inset displays the linear relationship between the response value and the concentration. Due to limitations of the experimental equipment, the minimum detection limit (DL) could not be directly measured. However, based on the research by Naes and Martins [40,41], gas sensors need not come into contact with the target gas to establish the detection limit. Instead, the root mean square error of the signal can be used to estimate the detection limit. According to the calculation, the minimum DL of the VO-In2O3/MXene (75%) heterojunction sensor is 1.05 ppb.
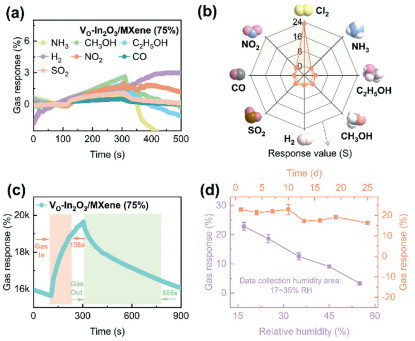
To investigate the gas selectivity of the VO-In2O3/MXene (75%) composite material, its response to various gases was tested. Fig. 10a displays the curves of the VO-In2O3/MXene (75%) sensor to 1 ppm nitrogen dioxide (NO2), 10 ppm ammonia (NH3), 100 ppm hydrogen (H2), 100 ppm carbon monoxide (CO), 100 ppm sulfur dioxide (SO2), 100 ppm methanol (CH3OH), and 100 ppm ethanol (C2H5OH) at room temperature. Fig. 10b indicates that the VO-In2O3/MXene (75%) sensor shows the strongest response to Cl2 (0.5 ppm). Fig. 10c reveals that the response and recovery times for the In2O3/MXene (75%) sensor to 0.5 ppm Cl2 at 25 ℃ are 136 s and 585 s, respectively. The response recovery time is related to factors such as operating temperature, material adsorption capacity, and material structure, and it is acceptable to have this excellent performance at room temperature [42,43]. Given that Cl2 is highly soluble in water and can interact with it, it is crucial to study the response of the sensor to Cl2 under different RH conditions. The purple dotted line in Fig. 10d displays the response values for the VO-In2O3/MXene (75%) sensor toward 0.5 ppm Cl2 under different RH levels: 20%, 30%, 40%, 50%, and 60%. The response magnitude of the sensor declines as humidity rises. On the one hand, Cl2 dissolves in water and reacts with it, leading to a reduction in the number of gas-phase molecules reacting with the surface of sensor. On the other hand, as humidity rises, water molecules take up certain active sites over the surface of material and compete with Cl2 [44]. The yellow dotted line in Fig. 10d represents the stability test of the VO-In2O3/MXene (75%) sensor to 0.5 ppm Cl2 over several days. After the tenth day, a slight fluctuation in gas response is observed, but the overall performance remains stable, with an average gas response value of 19.92% over the 25 days. It is reported that there are no reports on gas-sensitive materials related to this research so far. Therefore, the following Table 1 presents the detection of Cl2 by In2O3-based sensors.
 DownLoad:
CSV
| Materials | W.T. (oC) | Res./Con. | D. L. (ppb) | Tres./Trec. (s) | Method | Ref. |
| In2O3/ZnO | 370 | 660,900/50 | 1000 | 8/6 | Self-assembly | [45] |
| GC/In2O3 | 50 | 18,300/10 | 221 | 54/67 | Biomass template | [46] |
| Fe2O3/In2O3 | 300 | 9430/10 | 120 | 2/4 | Hydrothermal | [47] |
| Zn-In2O3 | 300 | 9370/5 | / | 2/6 | In-situ growth | [48] |
| In2O3/SnO2 | 260 | 103,330/50 | / | 2/9 | Solid-state grinding | [15] |
| K-In2O3 | 240 | 297/0.5 | 106 | 32/58 | Biomass template | [49] |
| In2O3/MXene | 25 | 22.85/0.5 | 1.05 | 136/585 | Electrostatic assembly | This work |
| Note: W.T.: working temperature, Res./Con.: response (|Rg - Ra|/Ra × 100%)/concentration (ppm), D.L.: detection limit, Tres./Trec.: response/recovery time. | ||||||
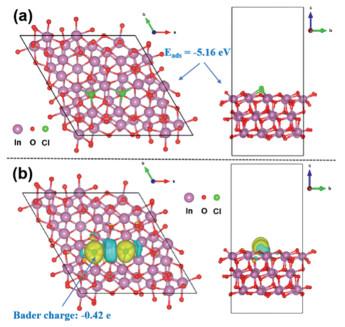
To explore the adsorption behavior of Cl2 on the In2O3 surface, density functional theory (DFT) calculations were employed to examine its adsorption structures and electronic properties. As shown in Fig. 11a, Cl2 gains electrons upon adsorption on the In2O3 surface, forming a stable adsorption configuration with an adsorption energy (Eads) of −5.16 eV. The negative adsorption energy with a large absolute value indicates that the adsorption process is thermodynamically highly spontaneous. Further, Bader charge analysis and charge density difference mapping (Fig. 11b) were integrated to characterize the electron transfer behavior. Bader charge transfer results reveal that the adsorbed Cl atoms exhibit a charge of −0.42 e, indicating electron transfer from the In2O3 surface to the Cl atoms. In the charge density difference map, yellow regions denote charge accumulation, while cyan regions indicate charge depletion, visually illustrating the charge transfer effect between the Cl atoms and the In2O3 surface [50]. Relevant parameter information is available in Supporting information.
To explore the gas-sensing mechanism for the prepared samples, UV–vis spectroscopy was employed to measure the band gap (Eg) of these samples, and XPS valence band analysis was performed to determine the valence band (Ev) position. As shown in Figs. 12a and b, the band gap and valence band of VO-In2O3 nanoparticles are 2.69 and 1.42 eV, respectively, while MXene shown in Fig. S6 (Supporting information), are 1.26 and 1.32 eV, respectively. In numerous reports, In2O3 consistently exhibits high sensitivity to Cl2. Furthermore, studies have revealed that V2CTx MXene gas sensors display ultra-high sensitivity to non-polar gases [51]. Fig. 12c illustrates the mechanism of the VO-In2O3/MXene (75%) sensor to Cl2. As shown in Fig. 12c, the VO-In2O3/MXene (75%) material interacts with Cl2 gas via electron transfer and surface adsorption. The VO-In2O3 possesses more oxygen vacancies than regular In2O3, and the presence of these oxygen vacancies aids electron transfer. DFT calculations indicate that VO-In2O3 has strong adsorption capacity for Cl2. Moreover, the small size of In2O3 nanoparticles helps to open up the MXene layered structure. The expansion between the MXene layers further enhances the gas-sensing properties of the material toward Cl2. The gas sensing results indicate that both In2O3 and MXene exhibit n-type semiconductor characteristics, and the VO-In2O3/MXene (75%) material also demonstrates this characteristic. The gas sensing mechanism may also be explained by means of the electron depletion theory [52,53].
|
|
(2) |
|
|
(3) |
|
|
(4) |
|
|
(5) |
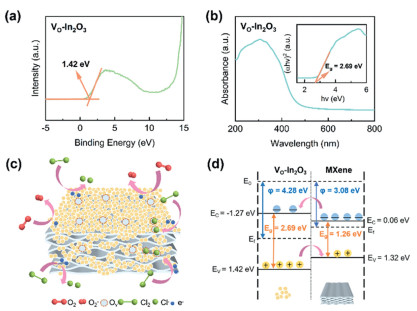
Reactions 2 and 3 generate a large amount of adsorbed oxygen on the surface of the material. This adsorbed oxygen accumulates on the material surface, consuming some electrons and thus leading to higher resistivity in the device compared to testing in a reducing gas environment. For reducing gases: First, in terms of structure, when the multi-layered accordion-like MXene is used for gas detection, the entry of gas into the interlayer spaces leads to an increase in interlayer distance, which in turn causes a rise in resistance. This produces a synergistic effect on oxidizing gases. However, when detecting reduced gases, the resistance decreases, which exerts an inhibitory effect on reducing gases. Moreover, the response performance of reducing gases is directly affected by the type and content of adsorbed oxygen (O(ads)) on the material surface. Nevertheless, as shown in Fig. 4f, the VO-In2O3/MXene (75%) composite has a very low proportion of O(ads). Additionally, reducing gases can only react with O2−(ads) generated from reaction 3, so their reactivity is significantly weakened. For oxidizing gases: Cl2 has stronger oxidizability than NO2. Moreover, the detection of NO2 partially relies on the O(ads) on the material surface, which requires multiple electron transfer steps. According to reactions 4 and 5, when the VO-In2O3/MXene (75%) composite material is exposed to a Cl2 environment, chlorine molecules can directly adsorb onto the surface and the oxygen vacancies. In reactions 4 and 5, Cl2 molecules take up electrons, resulting in fewer electrons present on the material. This raises the resistance of the sensor. Furthermore, Cl2 and O2−(ads) compete for electrons from the material surface, which is unfavorable to gases that rely on oxygen anions for their reactions. Due to its strong oxidizing nature, Cl2 has a greater ability to gain electrons than the adsorbed oxygen. Reports have indicated that the reaction between Cl2 and In2O3 is accompanied by exothermic characteristics, which facilitates the tendency toward a stable state [54]. Fig. 12d shows the energy band diagram of VO-In2O3 and MXene, with the MXene data provided in Fig. S5. From Fig. 12d, VO-In2O3 nanoparticles exhibit a work function exceeding that of MXene, which results in the development of a Schottky barrier at the VO-In2O3/MXene interface. Consequently, electrons migrate from MXene to In2O3 until the Fermi level reaches equilibrium, thereby expanding the electron depletion region. This interfacial synergistic effect between VO-In2O3 and MXene enhances the gas-sensing properties of the VO-In2O3/MXene (75%) sensor.
The In2O3 precursor was synthesized by a straightforward co-precipitation approach. Subsequently, some of the precursors were heat-treated in an argon environment to obtain VO-In2O3 nanoparticles with a higher concentration of oxygen vacancies. The VO-In2O3 nanoparticles were then mixed with MXene material in CTAB solution to form the VO-In2O3/MXene composite. Gas sensing tests showed that the VO-In2O3/MXene (75%) material exhibited excellent response (22.85%) to 0.5 ppm Cl2 at 25 ℃, with response and recovery times of 136/585 s. This performance is due to the greater number of oxygen vacancies in the VO-In2O3 nanoparticles and the bigger surface area of the VO-In2O3/MXene composite. Also, a special connection called an n-n junction was created between VO-In2O3 and MXene, which made the electrons move towards VO-In2O3, bending the Fermi level and speeding up the transfer of charge. These results indicate that the VO-In2O3/MXene (75%) sensor can serve as a highly effective Cl2 sensor at room temperature.
Guangji Zhang: Writing – original draft, Visualization, Methodology, Formal analysis, Data curation. Ziwei Zhang: Visualization, Formal analysis. Weixiao Hou: Investigation, Data curation. Jifan Hu: Writing – review & editing, Formal analysis. Kewei Zhang: Writing – review & editing, Formal analysis. Zhigang Sun: Software, Investigation. Jiangwei Ma: Writing – review & editing, Supervision, Project administration, Funding acquisition, Conceptualization.
The authors declare that they have no known competing financial interests or personal relationships that could have appeared to influence the work reported in this paper.
This fund was supported by the National Natural Science Foundation of China (Nos. 62201376, 52275356, 52275567), and the Taiyuan University of Science and Technology Scientific Research Initial Funding (No. 20202055).
Supplementary material associated with this article can be found, in the online version, at doi:
Y. Deng, Applications of Semiconducting Metal Oxide Gas Sensors, in: Semiconducting Metal Oxides for Gas Sensing, Springer, Singapore, 2023, pp. 325–385.
W. Meng, X. Cheng, C. Guo, et al., Talanta 288 (2025) 127731. doi: 10.1016/j.talanta.2025.127731
H.A. Rashid, N.E. Hassan, J. Mater. Sci. Res. 7 (2024) 612–622. doi: 10.9734/jmsrr/2024/v7i4354
S. Sun, C. Zhao, Z. Zhang, et al., Chin. Chem. Lett. 36 (2025) 109939. doi: 10.1016/j.cclet.2024.109939
A.L. Hunt, J.F. Alder, Anal. Commun. 33 (1996) 61–64. doi: 10.1039/ac9963300061
M. Ralfs, J. Heinze, Sens. Actuator. B: Chem. 44 (1997) 257–261. doi: 10.1016/S0925-4005(97)00217-7
A. Joshi, D.K. Aswal, S.K. Gupta, et al., Appl. Phys. Lett. 94 (2009) 103115. doi: 10.1063/1.3093499
G. Zhang, Z. Zhang, H. Zhai, et al., J. Environ. Chem. Eng. 13 (2025) 115474. doi: 10.1016/j.jece.2025.115474
Y.B. Aher, G.H. Jain, S.D. Shinde, et al., Phys. Solid State. 66 (2024) 497–504. doi: 10.1134/s1063783424601309
Y. Wu, X. Zhang, X. Cheng, et al., Sens. Actuator. B: Chem. 408 (2024) 135539. doi: 10.1016/j.snb.2024.135539
S. Shah, S. Hussain, S.T.U. Din, et al., J. Environ. Chem. Eng. 12 (2024) 112538. doi: 10.1016/j.jece.2024.112538
Z. Zhang, J. Ma, W. Hou, et al., Sens. Actuator. B: Chem. 426 (2025) 137072. doi: 10.1016/j.snb.2024.137072
S. Shah, S. Hussain, S.U. Din, et al., Ceram. Int. 50 (2024) 20894–20904. doi: 10.1016/j.ceramint.2024.03.049
R. Vishnuraj, R. Unnathpadi, M. Rangarajan, et al., Microchim. Acta 191 (2024) 645. doi: 10.1007/s00604-024-06693-7
P. Li, H. Fan, Y. Cai, Sens. Actuator. B: Chem. 185 (2013) 110–116. doi: 10.1016/j.snb.2013.05.010
J. Ma, H. Fan, W. Zhang, et al., Sens. Actuator. B: Chem. 305 (2020) 127456. doi: 10.1016/j.snb.2019.127456
Y. Zhang, Y. Li, Y. Jiang, et al., Sens. Actuator. B: Chem. 411 (2024) 135788. doi: 10.1016/j.snb.2024.135788
S.M. Majhi, A. Ali, Y.E. Greish, et al., Sci. Rep. 13 (2023) 3114. doi: 10.1038/s41598-023-30002-6
J.W. Osterrieth, J. Rampersad, D. Madden, et al., Adv. Mater. 34 (2022) 2201502. doi: 10.1002/adma.202201502
W. Wang, T. Huang, Z. Cao, et al., ACS Nano 18 (2024) 23205–23216. doi: 10.1021/acsnano.4c05801
L. Chu, H. Yan, W. Xie, et al., Chin. Chem. Lett. 34 (2023) 108512. doi: 10.1016/j.cclet.2023.108512
J. Zhang, L. Gao, Mater. Chem. Phys. 87 (2004) 10–13. doi: 10.1016/j.matchemphys.2004.06.004
A. Raveendran, M. Chandran, M.R. Siddiqui, et al., ACS Omega 8 (2023) 34768–34786. doi: 10.1021/acsomega.3c03827
D. Pan, S. Ge, X. Zhang, et al., Dalton Trans. 47 (2018) 708–715. doi: 10.1039/c7dt03878j
B. Maji, S. Badhulika, J. Alloys Compd. 1017 (2025) 179079. doi: 10.1016/j.jallcom.2025.179079
X. Zhang, J. Xu, Z. Chen, et al., J. Alloys Compd. 1007 (2024) 176408. doi: 10.1016/j.jallcom.2024.176408
B. Mendoza-Sánchez, E. Samperio-Niembro, O. Dolotko, et al., ACS Appl. Mater. Interfaces 15 (2023) 28332–28348. doi: 10.1021/acsami.3c01671
J. Yuan, H. Yang, Z. Wang, et al., J. Mater. Chem. C 13 (2025) 8702–8709. doi: 10.1039/d5tc00032g
B. Maji, S. Badhulika, Chem. Eng. J. 500 (2024) 156838. doi: 10.1016/j.cej.2024.156838
X. Lv, K. Yang, H. Wang, et al., Vacuum. 227 (2024) 113350. doi: 10.1016/j.vacuum.2024.113350
X. Li, M. Li, Q. Yang, et al., ACS Nano 14 (2020) 541–551. doi: 10.1021/acsnano.9b06866
Z. Duan, Y. Jiang, M. Yan, et al., ACS Appl. Mater. Interfaces 11 (2019) 21840–21849. doi: 10.1021/acsami.9b05709
V. Natu, M. Benchakar, C. Canaff, et al., Matter 4 (2021) 1224–1251. doi: 10.1016/j.matt.2021.01.015
J. Xian, J. Li, W. Wang, et al., Appl. Surf. Sci. 614 (2023) 156175. doi: 10.1016/j.apsusc.2022.156175
K.S. Sing, R. Williams, Adsorpt. Sci. Technol. 22 (2004) 773–782. doi: 10.1260/0263617053499032
J. Liu, L. Zhang, J. Fan, et al., Small 18 (2022) 2104984. doi: 10.1002/smll.202104984
Q. Liu, H. Wu, H. Gu, et al., Chem. Eng. Sci. 302 (2025) 120911. doi: 10.1016/j.ces.2024.120911
V. Kafil, B. Sreenan, M. Hadj-Nacer, et al., Sens. Actuator. A 373 (2024) 115440. doi: 10.1016/j.sna.2024.115440
J. Zhang, T. Li, H. Zhang, et al., Mater. Today Chem. 38 (2024) 102114. doi: 10.1016/j.mtchem.2024.102114
H. Martens, T. Næs, TrAC, Trends Anal. Chem. 3 (1984) 204–210. doi: 10.1016/0165-9936(84)85008-6
B. Ran, P. Hu, J. Sun, et al., J. Hazard. Mater. 480 (2024) 136289. doi: 10.1016/j.jhazmat.2024.136289
Y. Xiao, H. Li, C. Wang, et al., Adv. Sens. Res. 3 (2024) 2300035. doi: 10.1002/adsr.202300035
M. Akbari-Saatlu, M. Heidari, C. Mattsson, et al., Nanomaterials. 14 (2024) 1725. doi: 10.3390/nano14211725
S. Wang, R. Gao, Y. Wu, et al., Sens. Actuator. B: Chem. 443 (2025) 138185. doi: 10.1016/j.snb.2025.138185
X. Zou, X. Yan, G. Li, et al., RSC Adv. 7 (2017) 34482–34487. doi: 10.1039/C7RA04852A
Y.Y. Xin, M.S. Lv, X.F. Zhang, et al., Sens. Actuator. B: Chem. 441 (2025) 138061. doi: 10.1016/j.snb.2025.138061
P. Li, Y. Cai, H. Fan, RSC Adv. 3 (2013) 22239–22245. doi: 10.1039/c3ra43616k
P. Li, H. Fan, Y. Cai, et al., CrystEngComm 16 (2014) 2715–2722. doi: 10.1039/C3CE42325E
L. Zhu, H. Han, RSC Adv. 14 (2024) 32661–32667. doi: 10.1039/d4ra05208k
Z. Cao, W. Wang, J. Li, et al., Sens. Actuator. B: Chem. 428 (2025) 137247. doi: 10.1016/j.snb.2025.137247
E. Lee, A. VahidMohammadi, Y.S. Yoon, et al., ACS Sens. 4 (2019) 1603–1611. doi: 10.1021/acssensors.9b00303
D.Y. Nadargi, A. Umar, J.D. Nadargi, et al., J. Mater. Sci. 58 (2023) 559–582. doi: 10.1007/s10853-022-08072-0
H. Song, S. Yan, Y. Yao, et al., Chem. Eng. J. 370 (2019) 1331–1340. doi: 10.1016/j.cej.2019.03.254
V. Nagarajan, R. Can, J. Chem. 93 (2015) 1249–1260. doi: 10.1139/cjc-2015-0150

Figure 2 SEM images of (a) VO-In2O3/MXene (25%), (b) VO-In2O3/MXene (50%), (c) VO-In2O3/MXene (75%), (d) VO-In2O3.

Figure 3 VO-In2O3/MXene (75%): (a, b) TEM images, (c) HRTEM image, (d) SAED pattern, (e-i) EDS elemental mapping of HAADF image: V (yellow), C (blue), In (red), O (pink).

Figure 4 (a) XRD patterns, XPS of O 1s: (d) MXene, (b, e) VO-In2O3, (c, f) VO-In2O3/MXene (75%).

Figure 5 XPS high-resolution of V 2p: (a) MXene, (d) VO-In2O3/MXene (75%). In 3d: (b) VO-In2O3, (e) VO-In2O3/MXene (75%). C 1s: (c) MXene, (f) VO-In2O3/MXene (75%).

Figure 6 (a) Nitrogen adsorption-desorption isotherms and (b) pore size distribution and accumulated pore volume of VO-In2O3/MXene (75%).

Figure 8 Dynamic resistance curves of (a) MXene, (b) VO-In2O3/MXene (25%), (c) VO-In2O3/MXene (50%), (d) VO-In2O3/MXene (75%) to 0.5 ppm Cl2 at 25 ℃.

Figure 9 (a) Curve of the VO-In2O3/MXene (75%) to various concentrations of Cl2. (b) Response-concentration histogram of the VO-In2O3/MXene (75%) (inset: Linear curve) at working temperature of 25 ℃.

Figure 10 VO-In2O3/MXene (75%) at working temperature of 25 ℃: (a) Real-time response to different gases. (b) Radar chart of different gas response. (c) Response and recovery time curve. (d) Humidity and stability response curves of 0.5 ppm Cl2 (ambient temperature: 23±1 ℃).

Figure 11 DFT calculation of the VO-In2O3. (a) Oxygen vacancy adsorption energy. (b) Bader charge transfer.

Figure 12 (a) XPS valence band spectrum of VO-In2O3. (b) UV–vis diffuse reflection of VO-In2O3. (c) Response mechanism diagram of VO-In2O3/MXene (75%). (d) Energy band of VO-In2O3/MXene (75%).
Table 1. Reported In2O3-based sensors for Cl2 detection.
| Materials | W.T. (oC) | Res./Con. | D. L. (ppb) | Tres./Trec. (s) | Method | Ref. |
| In2O3/ZnO | 370 | 660,900/50 | 1000 | 8/6 | Self-assembly | [45] |
| GC/In2O3 | 50 | 18,300/10 | 221 | 54/67 | Biomass template | [46] |
| Fe2O3/In2O3 | 300 | 9430/10 | 120 | 2/4 | Hydrothermal | [47] |
| Zn-In2O3 | 300 | 9370/5 | / | 2/6 | In-situ growth | [48] |
| In2O3/SnO2 | 260 | 103,330/50 | / | 2/9 | Solid-state grinding | [15] |
| K-In2O3 | 240 | 297/0.5 | 106 | 32/58 | Biomass template | [49] |
| In2O3/MXene | 25 | 22.85/0.5 | 1.05 | 136/585 | Electrostatic assembly | This work |
| Note: W.T.: working temperature, Res./Con.: response (|Rg - Ra|/Ra × 100%)/concentration (ppm), D.L.: detection limit, Tres./Trec.: response/recovery time. | ||||||
 下载: 导出CSV

 扫一扫看文章


扫一扫关注我们


 下载: