National Engineering Research Center of Electromagnetic Radiation Control Materials, School of Electronic Science and Engineering, University of Electronic Science and Technology of China, Chengdu 611731, China
b.
Key Laboratory of Multispectral Absorbing Materials and Structures of Ministry of Education, School of Electronic Science and Engineering, University of Electronic Science and Technology of China, Chengdu 611731, China
Received Date:
22 August 2025 Accepted Date:
27 September 2025 Revised Date:
18 September 2025 Available Online:
15 December 2026
Abstract:
The dielectric response of materials can be generated through temperature induced dipole polarization. However, the response is typically weak at gigahertz, because the external electric field change is too fast for the dipole orientation motion, and thermal molecular motion further diminishes dipole polarization. Herein, we explored a novel type of metal-organic frameworks using dipole amine as the guest molecule to create a hydrogen bonding system that cyclic break and reconstruction under moderate thermal stimulation. The dipoles transition between constrained and dissociated states, achieving a fourfold reduction in reorientation relaxation time. Meanwhile, the confined space of the metal-formate framework inhibits thermal molecular motion, allowing for independent control of dipole polarization. Consequently, the MOF shows a maximum change of nearly two orders of magnitude of reversible dielectric properties at gigahertz.
The dielectric constant is a measure of the degree of polarization of a material under the application of an electric field. In the fields of RF devices, microwave tunable devices, optical devices, and others, the dynamic control of the dielectric constant at gigahertz has consistently been an active area of research [1-3]. Although some methods use negative dielectric constants of metasurfaces combined with structures to create complex phased arrays and feedback systems for gigahertz frequency dielectric control. The precise fabrication at nano or microscale levels required by metasurfaces challenges large area adaptive surfaces, with controls often limited to specific frequency ranges [2,3]. Thus, achieving active control through material properties remains challenging. The orientational motions of dipoles under thermal stimulation is a common means to adjust the dielectric properties of materials [4,5]. Unfortunately, as the frequency of the electric field increases, dipoles in most dielectric materials struggle to reorient effectively, resulting in the decrease in dielectric response. When gigahertz frequencies are reached, the polarization response becomes minimal [6]. At this stage, the contribution of temperature induced orientational motion to the dielectric constant is effectively negligible [4,7,8]. On the other hand, the molecular thermal motion caused by increased temperature can competitively affect the orientation motions, resulting in deteriorated dielectric performance [6,7]. Therefore, the primary challenge is to manipulate the enhanced orientation motions of dipoles under thermal stimulation and reduce the damage of thermal motion to polarization, for achieving a significant and controllable modulation of the dielectric constant at gigahertz frequency.
As a type of metal-organic frameworks (MOF), ammonium metal formate frameworks (AMFF) serve as a potential candidate material for reversible dielectric properties was established in our strategy [9,10]. On one hand, hydrogen bonds are used to alter the relaxation behavior of dipolar amine guest molecules in the gigahertz [11], while on the other, confined space formed by the metal-formate framework is introduced to shield polarization from the effects of thermal motion. The hydrogen bond system between formate ligands and amine guest molecules responds rapidly to external stimuli [9,12]. We utilized the cyclic break and reconstruction of hydrogen bonds under moderate thermal stimuli, which drive the switching of dipole amine guest molecules between constrained and dissociated state. This leads to a change in the reorientation relaxation time (τ) of [en][Ni(HCOO)3]2 (en = ethylenediamine) by about fourfold (from 21.62 ns to 4.71 ns), resulting in nearly two orders of magnitude increase in the reversible dielectric constant from 2 GHz to 18 GHz, compared to the control group Ni(HCOO)2(H2O)2 with a similar structure but without guest molecules. Additionally, to further investigate the impact of guest molecules and coordinating metal ions on dielectric properties, we designed [pn][Ni(HCOO)3]2 and [bn][Ni(HCOO)3]2 with an increased number of carbon atoms, as well as the non-magnetic coordinating ion [en][Mg(HCOO)3]2.
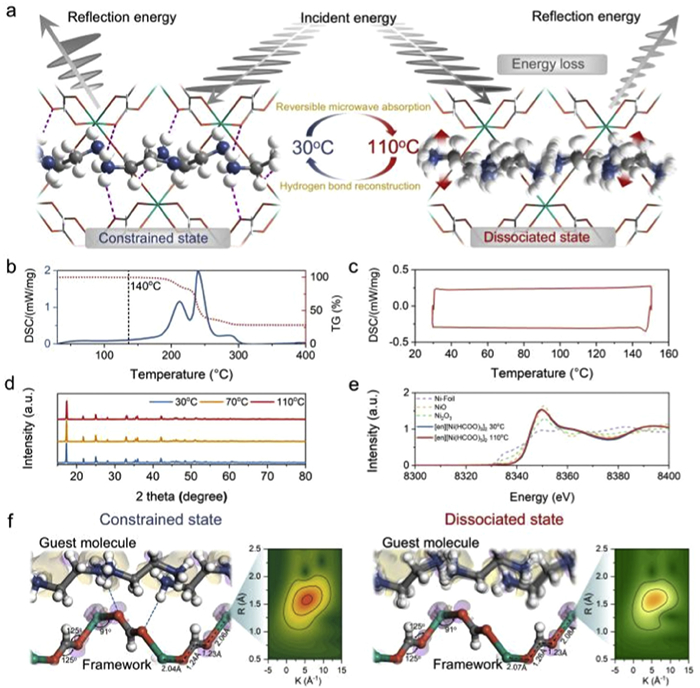
The preparation process of AMFF is illustrated in Fig. S1 (Supporting information). Initially, the results from Figs. S2 and S3 (Supporting information) indicate that the structures of the AMFF remain stable under temperature stimuli, which rules out the influence on dielectric properties. The present study in the main body primarily focuses on [en][Ni(HCOO)3]2 to prove the mechanism of reversible dielectric constant. According to the SXRD results, [en][Ni(HCOO)3]2 crystallizes in the P1 space group and features an octahedral NiO64− structure, with Ni2+ coordinated to oxygen atoms from the formate groups (Fig. 1a and Fig. S4a in Supporting information) [9]. The lattice parameters shown in Table S1 remain essentially unchanged during the temperature variation, indicating that the metal-formate framework maintains structure stability from low temperature of 30℃ (LT) to high temperature of 110℃ (HT).
Figure 1
Figure 1.
Mechanism of reversible dielectric constant and the stability of the metal-formate framework [en][Ni(HCOO)3]2. (a) Regulatory mechanisms at 30 and 110℃. (b) TG–DSC range: 0–400℃. (c) DSC range: 0–150℃. (d) VT-PXRD at 30, 70, and 110℃. (e) XANES spectra of Ni2+, standard NiO, NiO and Ni-foil as references. (f) Differential charge densities of metal-formate framework and wavelet transform maps of Ni2+ at 30 and 110℃ (H: white, C: grey, N: blue, O: red, Ni: green, the value of isosurface: 0.1 e/Å3, purple: positive charge, yellow: negative charge).
As shown in Fig. 1a, the state of the guest molecule undergoes significant change due to the break of hydrogen bonds under temperature stimuli. In general, N–H···O hydrogen bonds are formed when the atomic spacing reaches 1.8–2.2 Å [12].
According to the SXRD data, all five hydrogen bonds are formed at LT between the protonated amino group (NH3+) on the guest molecule and the O atom on the formate ligand and are broken at HT. The protonation of amine groups enhances the dipole moment, thereby increasing the polarity of the guest molecules [8]. The alternate hydrogen bonds regulate guest molecules transition from the constrained state to the dissociated state to influence the dielectric properties at gigahertz. Additionally, the control groups enable a deeper insight into the impact of the state transition on dielectric properties (Figs. S5-S10 in Supporting information). However, in most cases, changes in material dielectric properties are likely to originate from phase transitions and charge distribution, so it is necessary to rule out the possibility that metal-formate framework are responsible for the reversible dielectric constant [13-15]. As revealed by the STEM, formates form bridging modes to link metal ions, which results in an extremely small porosity structure (Fig. S4b in Supporting information). Consequently, the confined space generated by this structure prevent the thermal motion collision of guest molecules in the dissociated state. The order-disorder transition of guest molecules in AMFF can result in the effects of ferroelectricity or antiferroelectricity, accompanied by the phase transition, which may induce changes in the dielectric constant. To eliminate this process, the thermogravimetric (TG) analysis shows that the decomposition begins at 140℃ with three stages till 300℃ (Fig. 1b and Fig. S11 in Supporting information). Additionally, the lack of observable phase transitions in the differential scanning calorimetry (DSC) results (Fig. 1c and Fig. S12 in Supporting information), and the unchanged variable temperature X-ray diffraction (VT-XRD) results (Fig. 1d and Fig. S13 in Supporting information) indicate that there is no first-order or second-order phase transitions in the temperature range of 30–110℃. Therefore, these characterizations evidence that the ferroelectric or antiferroelectric phase transitions did not occur under temperature stimulation.
Apart from the factors mentioned above, the oxidation state of metal ions typically leads to differences in the charge distribution of the system, which can also affect the dielectric properties of the material [14]. However, it is difficult to observe these through DSC and VT-XRD. To eliminate the influence of these factors, we employed XAFS as a powerful technique to probe the local structure around the Ni2+ in the [en][Ni(HCOO)3]2. The absence of pre-edge peak (8330–8340 eV) (Fig. 1e), signifies that the octahedral coordination of Ni with O remains consistent, which matches the SXRD results [16]. Using standard NiO, Ni2O3 and Ni-foil as references, it was estimated that Ni ions exhibit a 3d8 electronic configuration, characteristic of Ni2+ across LT to HT. Based on the wavelet transform data (Fig. 1f and Fig. S14 in Supporting information), it is obvious that temperature stimuli exert negligible influence on the local structure of Ni2+ and bond length (1.54 + 0.5 Å) of Ni-O. The XAFS findings for the control group, Ni(HCOO)2(H2O)2, demonstrate the same conclusion (Fig. S15 in Supporting information). Based on the above conclusions, the microstructure and oxidation state of the metal ions in the metal-formate framework remain stable, suggesting that the charge distribution is also likely to remain unchanged. We employed density functional theory (DFT) calculations (Fig. 1f and Fig. S16 in Supporting information), which indeed show that the bond lengths, bond angles, and charge distribution of the framework remain nearly constant from LT to HT. In summary, the above discussion fully rules out the possibility that the reversible dielectric constant originates from the metal-formate framework, which makes it highly likely that it is instead driven by the conformational entropy variations of the guest molecules due to the cyclic hydrogen bond system.
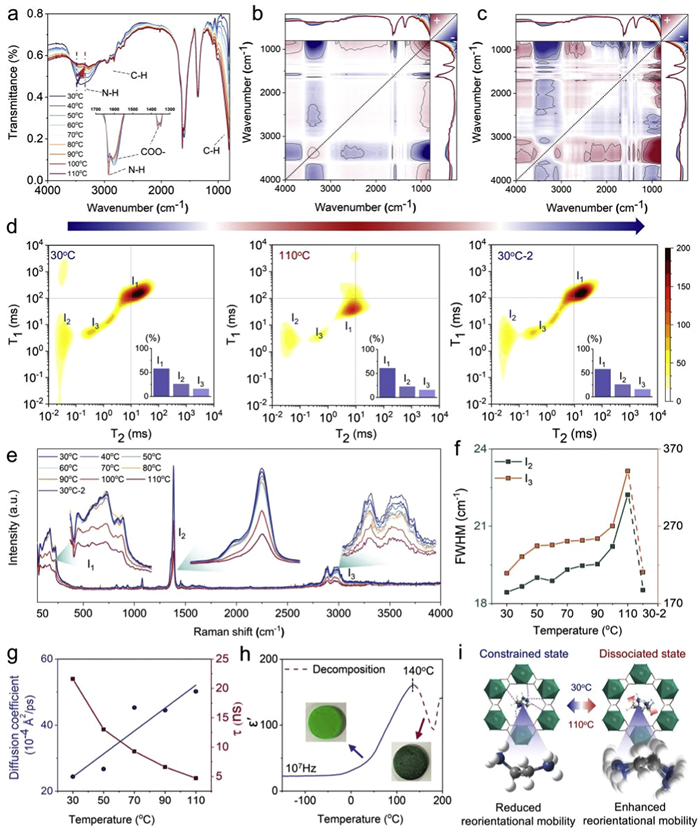
It is most logical to first use variable temperature Fourier transform infrared (VT-FTIR) to study the switch of guest molecules between constrained and dissociated states, driven by the cycle break and reconstruction of hydrogen bonds. As depicted in Fig. 2a, the N–H stretching vibration within the 3200–3600 cm−1 range demonstrates a redshift alongside a decrease in absorption intensity. This suggests a weakening of the N–H···O strength in [en][Ni(HCOO)3]2 as the temperature rise [17]. Additionally, the state transition of guest molecules observed in the crystal structure analysis is evidenced by the increased intensity of the asymmetric stretching vibrations at 948 cm−1 and the bending vibrations at 1102, 1027, and 818 cm−1, all originating from the C–H bonds on the guest molecules. Simultaneously, the symmetric stretching vibrations of COO– at 1601 and 1351 cm−1 exhibit negligible changes with temperature, which supports that the impact of hydrogen bond break on the formate ligands is extremely weak [18]. Notably, when the temperature returns to the initial state, the FTIR spectrum also reverts to its original condition, which hints at that hydrogen bond reconstruction occurs during the cooling process. To correlate hydrogen bonds with the guest molecule states, the generalized 2D correlation spectra were performed to verify the correlationship of functional groups (Figs. 2b and c) [19]. Based on the Noda’s rule, we can investigate the sequential order of the N–H, C–H, and COO–. It can be determined that the bending vibrations of C–H (1102, 1027 and 818 cm−1) appear later than the stretching vibrations of N–H (3400 cm−1) and the symmetric stretching vibrations of COO– (1601 and 1351 cm−1), which indicates that the state change of guest molecules induced by the hydrogen bond break. These phenomena, in contrast to the static behavior of Ni(HCOO)2(H2O)2, further confirm that the switch in the state of the guest molecules are due to the cyclic hydrogen bond system induced by thermal stimuli (Fig. S17 in Supporting information).
Figure 2
Figure 2.
Reorientational mobility driven by Hydrogen bond cycle break and reconstruction in the confined space of [en][Ni(HCOO)3]2. (a) VT-FTIR. (b, c) VT-FTIR synchronous and asynchronous correlations spectroscopy. (d) VT 2D-low field 1H NMR spectrum, with the purple bar chart in the lower right corner representing the percentage of peak integration. (e) VT-Raman spectra. (f) Temperature dependence of the full width at half maximum for Raman scattering I2 and I3 peaks. (g) Temperature dependence of the reorientation relaxation time and diffusion coefficients of guest molecules in [en][Ni(HCOO)3]2. (h) Temperature dependence of the ε′ at 107 Hz. (Ⅰ) Mechanism diagram of temperature dependent reorientational mobility of guest molecules.
The break of hydrogen bonds inevitably influences the microenvironment of the hydrogen atoms in the –NH3+, which can be effectively characterized through 2D low-field 1H nuclear magnetic resonance (NMR). The H atoms in [en][Ni(HCOO)3]2 are distributed across three distinct chemical environments: H1 from –NH3+, H2 from –CH2, and H3 from HCOO– (Fig. 2d). The corresponding 2D T1-T2 plot (T1: spin-lattice relaxation time; T2: spin-spin relaxation time) reveals three species: I1 peak belonging to H1, I2 peak belonging to H2, and I3 peak belonging to H3. The shift of the I1 peak at HT implies a significant transition in the microenvironment of H1 atoms on –NH3+. Combined with crystal structure and VT-FTIR conclusions, it is highly likely that this is caused by the break of hydrogen bonds. As expected, the disappearance of peaks I1 and I2 in Fig. S18a (Supporting information) for the control group Ni(HCOO)2(H2O)2, which lacks guest molecules, provides strong evidence supporting this claim. Similarly, the comparison groups [pn][Ni(HCOO)3]2 and [bn][Ni(HCOO)3]2 also show a shift for the I1 peak (Figs. S18b and c in Supporting information). The cyclic shifts of the peaks in these T1-T2 plots can likewise be interpreted as the reversible interactions between the guest molecules and the metal-formate framework, which are key to influencing the reorientational mobility [20].
The guest molecules are constrained by various factors in the confined space, which makes it challenging for low-field 2D NMR alone to achieve sufficient resolution in determining their reorientational mobility.
It is necessary to combine with the broadening of the Raman spectra for vivid confirmation. As the temperature increases, there is a significant increase in the full width at half-maximum (FWHM) and a slight decrease in Raman scattering intensity for the I2 (combination band, vCOO− and vNH3+) and I3 (vNH3+) of [en][Ni(HCOO)3]2, which directly points to enhanced reorientational mobility of guest molecules in dissociated state (Figs. 2e, and b) [10]. The most compelling proof is shown in Figs. S19a and b (Supporting information), where the control group without guest molecules exhibits static FWHM and Raman scattering intensity under temperature stimulation.
The broadening of the Raman peaks for the comparison groups [en][Mg(HCOO)3]2, [pn][Ni(HCOO)3]2, and [bn][Ni(HCOO)3]2 similarly demonstrates that the reorientational mobility of their guest molecules are enhanced caused by rising temperatures (Figs. S19c-e in Supporting information). Molecular dynamics simulations provide a deeper explanation of the temperature dependent reorientational mobility of guest molecules, based on the fact that the diffusion coefficient of guest molecules is positively correlated with their reorientational mobility in confined space, according to Einstein's theory of diffusion and Brownian motion (Fig. 2g and Movie S1 in Supporting information) [21]. The τ value shows a fourfold decrease (from 21.62 ns to 4.71 ns), aligning well with the expected results from molecular dynamics and providing strong evidence for the enhanced reorientational mobility (Fig. 2g). It is worth noting that, as shown in Figs. S7-S9 (Supporting information), the dissociated state of guest molecules is influenced by their size and the coordinating metal ions, which theoretically impacts their reorientational mobility. This perspective can be well elucidated through the variation of molecular dynamics simulations and τ with temperature (Fig. S20 in Supporting information). Theoretically, when reaching a certain transition temperature, the deterioration of ε′ inevitably occurs because the molecular thermal motion overwhelms the effect of reorientational mobility of dipoles. However, until the decomposition temperature, the continuous increasing of ε′ in Fig. 2h and Figs. S20l-n (Supporting information) indicates that the constraint of confined space eliminate the molecular thermal motion. Therefore, these investigations collectively demonstrate that the reversible dielectric properties at gigahertz depend on the hydrogen bond system and the confined space of the MOF structure (Fig. 2i).
With the break of hydrogen bonds, previous discussions have demonstrated that the transition of guest molecules in the confined space from a low configurational entropy constrained state to a high configurational entropy dissociated state significantly increases the reorientational mobility of the guest molecules. This situation allows the molecules to orient more easily under the influence of an electric field, thereby enhancing reorientation motions under an alternating electric field [8,22,23]. At the same time, the confined space also isolates the thermal motion of molecules stimulated by temperature changes (Fig. 1a and Movie S2 in Supporting information).
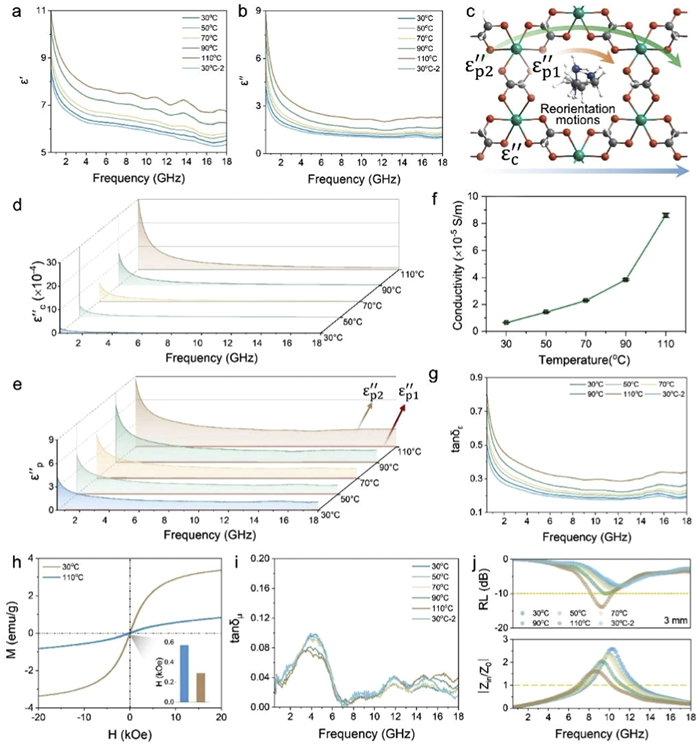
With the increase in frequency at gigahertz levels, the guest molecules of [en][Ni(HCOO)3]2 struggle to reorient in response to the rapidly changing electric field, resulting in a gradual decrease in ε′ (Fig. 3a) [4]. Coincidentally, the dissociated guest molecules exhibit enhanced reorientational mobility in response to the alternating electric field, which leads to stronger reorientation motions and, consequently, a 60% rise in ε′ at HT [4,6,11]. The most direct evidence that the increase in ε′ is due to the enhanced reorientation motions of the guest molecules comes from the control group Ni(HCOO)2(H2O)2 (Figs. S21 and S22 in Supporting information), which exhibits inapparent increase in ε′ with temperature stimuli.
Figure 3
Figure 3.
Temperature dependence electromagnetic parameters of [en][Ni(HCOO)3]2 at gigahertz frequency. (a, b) Dielectric constant ε′ and ε″. (c) Schematic of the components of ε″. (d, e) Conduction loss εc″ and polarization loss εp″ under temperature stimuli. (f) Conductivity of [en][Ni(HCOO)3]2 with temperature rise. (g) Tangent of dielectric loss tanδε with temperature stimuli. (h) Tangent of magnetic loss tanδμ. (i) Magnetic hysteresis loops. (j) RL and ∣Zin/Z0∣of 3 mm at different temperatures.
The increased reorientational mobility of the guest molecules not only enhances the storage of electric field energy, reflected in the rise of ε′, but also results in a 100% increase in the imaginary part of the dielectric constant ε″, which indicates energy dissipation (Fig. 3b). At gigahertz frequency, the dielectric loss ε″ is governed by conduction loss εc″ and polarization loss εp2″ (Figs. 3c–e) [24]. The extremely low conductivity of [en][Ni(HCOO)3]2 reveals that the increase in ε″ during heating is almost unrelated to εc″ and mainly stems from εp″ (Figs. 3d, and f). The Havriliak-Negami equation fitting results allow us to distinguish between the polarization loss component εp1″ caused by the metal-formate framework and εp2″ caused by the reorientation motions of guest molecules [6]. The εp1″ is minimal and remains negligible with temperature stimulation, as evident from the εp1″ of the control group Ni(HCOO)2(H2O)2 (Fig. 3e and Fig. S23 in Supporting information). Therefore, the εp″ of [en][Ni(HCOO)3]2 primarily originates from εp2″. The gradual decrease in εp2″ indicates that, as the increase in frequency at gigahertz levels, the guest molecules progressively lose the ability to complete effective reorientational motion within a single cycle, thereby reducing the frequency of polarization and depolarization cycles (Fig. 3e). As the temperature increases, the enhanced reorientational mobility of guest molecules lead to more frequent polarization and depolarization cycles, which enhances energy dissipation and consequently elevates εp2″ [4,11,25].
The dielectric loss tangent tanδε and magnetic loss tangent tanδμ are key parameters for evaluating the energy dissipation efficiency of materials in microwave signal transmission (Fig. S24 and S25 in Supporting information). At HT, the dielectric loss efficiency of microwaves in [en][Ni(HCOO)3]2 increases significantly, as represented by a 20% rise in tanδε (Fig. 3g). According to Fig. 3h, the magnetic moments of Ni2+ are 0.0675 μB and 0.0168 μB at HT and LT, which is much smaller than Ni atom (2 μB). Meanwhile, the tanδμ is extremely small and has no change under varying temperature [26]. These results indicate that the loss of microwave by [en][Ni(HCOO)3]2 is independent of magnetism (Fig. 3i). Unlike the adjustable εc″ resulting from changes in dynamic conductivity, [en][Ni(HCOO)3]2 not only experiences increased εp″ but also shows an absorption peak shift caused by impedance matching related to ε′. Consequently, the modulation amplitude of the 3 mm material ranges from −4.0 dB to −13.5 dB at 8 GHz (Fig. 3j) [13,15,27].
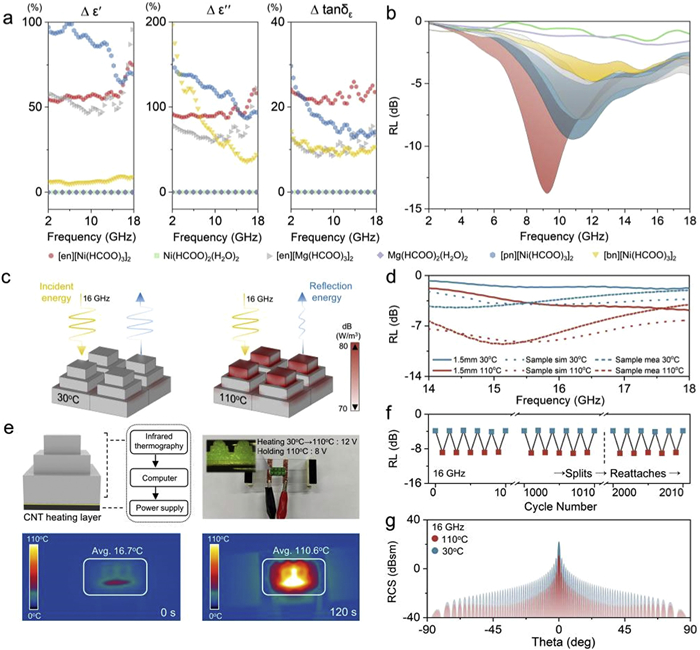
The results in Fig. 4a further bolster the confidence that the reversible dielectric constant originates from the reorientation motion of guest molecules in confined spaces, as the AMFF containing guest molecules all exhibit significant changes in Δε′, Δε″ and Δtanδε. Building on this, comparative experiments further demonstrate the influence of guest molecules and confined spaces on dielectric regulation performance. Firstly, as the number of carbon atoms in the guest molecules increases in [pn][Ni(HCOO)3]2 and [bn][Ni(HCOO)3]2, although the VT-FTIR results indicate similar hydrogen bond break and Raman spectroscopy confirms an enhancement in the reorientational mobility of the guest molecules. Molecular dynamics simulations and τ demonstrate that the rate of change in reorientational mobility with temperature significantly decreases (Fig. S20). Consequently, these materials exhibit a decreasing trend in the regulation amplitude of the reversible dielectric constant [4]. Second, replacing the magnetic Ni2+ ions with non-magnetic Mg2+ ions results in the system with weaker polarization capability, which leads to a lower dielectric constant for [en][Mg(HCOO)3]2 at LT [3,14].
Figure 4
Figure 4.
Factors influencing reversible dielectric constants of AMFF and synergistic effects on metamaterial structures. (a) Comparisons of reversible dielectric constants Δε′, Δε″ and Δtanδε among different AMFFs, for example $\Delta \varepsilon^{\prime}=\left(\varepsilon^{\prime}{ }_{110^{\circ} \mathrm{C}}-\varepsilon^{\prime}{ }_{30^{\circ} \mathrm{C}}\right) / \varepsilon^{\prime}{ }_{30^{\circ} \mathrm{C}}$. (b) Comparison of adjustable RL across different AMFF, the colors beneath the two figures above correspond to the respective AMFF. (c) 3D power loss simulation results at 16 GHz using CST in metamaterial composite model. (d) Comparison between simulation and measurements of RL in the metamaterial composite model. (e) Description of the temperature control system. (f) Temperature fatigue cycle test on the metamaterial composite model, where the material is split and reattached after 2000 cycles, followed by further cyclic testing. (g) Simulation of adjustable RCS in different directions for a 40 cm × 40 cm metamaterial model.
This point is further supported by comparing the dielectric constants of Ni(HCOO)2(H2O)2 and Mg(HCOO)2(H2O)2. Furthermore, as shown in the crystal structure in Fig. S7, replacing the coordinating metal ion Ni2+ with Mg2+ leads to a change in the cavity size of [en][Mg(HCOO)3]2 (Table S1 in Supporting information), resulting in a reduction in the number of guest molecules. Consequently, the modulation amplitude of the dielectric constant is slightly lower than that of [en][Ni(HCOO)3]2 (Fig. S26 in Supporting information). These regularities in the reversible dielectric constant are beneficial for designing materials to meet the demands of complex and dynamic electromagnetic environments, such as adapting to adjustable microwave signals in different frequency bands (Fig. 4b). Additionally, the tunable absorption bandwidth is also influenced by the surface thickness of the AMFF composition (Fig. S27 in Supporting information). In addition, the comparison of AMFF with other microwave-tunable advanced functional materials also demonstrates its strong modulation capabilities (Table S4 in Supporting information).
According to effective medium theory, microstructural modifications in metamaterials result in a macroscopic medium with well-defined effective dielectric constants [3]. Herein, we constructed a metamaterial model composed of [en][Ni(HCOO)3]2 and resin through hyperfine 3D printing. The optimal filler ratio was determined using the Bruggeman model. As the dielectric constant of the material increases with rising temperature, the periodic structure of the metamaterial induces multiple reflections and scattering, improved impedance matching, and enhanced multi-interface polarization [3]. These effects collectively enhance the efficiency of adjustable microwave signal, as demonstrated by the measurements and simulation results (Figs. 4c, and d). Meanwhile, to facilitate temperature control of the model, we introduced a temperature control system (Fig. 4e, Fig. S28 and Movie S3 in Supporting information). Moreover, unlike conduction loss, polarization loss remains unaffected by microstructural degradation. Fig. 4f shows that after 2000 thermal fatigue cycles, and following damage and subsequent repair, the performance remains stable, demonstrating excellent practical value. This repeatedly adjustable microwave signal enables dynamic control of the radar cross section (RCS) in the metamaterial model, showcasing unique advantages at specific angles, such as 30° (Fig. 4g and Fig. S29 in Supporting information) [28].
In summary, our findings investigated a novel approach featuring a temperature dependent reversible dielectric constant at gigahertz frequency. This reversible dielectric constant is attributed to the significant transition in the reorientation motions of dipolar amine guest molecules in the confined space, driven by the cycle break and reconstruction of hydrogen bonds under temperature stimuli. Meanwhile, the confined space formed by the metal-formate framework also prevents the degradation of reorientation motions caused by molecular thermal motion. This research provides new mechanisms and insights for the future discovery of novel materials with reversible dielectric constants. We have preliminarily explored the application of this type of material in microwave signal regulation and have attempted to enhance the amplitude and directionality of signal modulation by utilizing the structure of the metamaterial model. Such advancements hold potential for significant applications in RF devices, microwave tunable devices, and optical devices.
The authors declare that they have no known competing financial interests or personal relationships that could have appeared to influence the work reported in this paper.
Acknowledgments
This research was supported by Sichuan Science and Technology Program (No. 2024ZDZX0036), National Ten Thousand Talent Plans for Young Top-notch Talents, National Natural Science Foundation of China (Nos. 52425205, 52021001), Fundamental Research Funds for the Central Universities. We would like to extend our gratitude to J. Li and Z. Hu from the Analytical Testing Center of the University of Electronic Science and Technology of China for their technical support on STEM and XAFS, as well as X. Jian from the School of Materials and Energy of the University of Electronic Science and Technology of China for his assistance in Raman testing. We are also grateful to L. Chen from Suzhou Niumag for conducting 2D low-field NMR testing, and to the Shiyan Jia Laboratory (www.shiyanjia.com) for SXRD testing.
Supplementary materials
Supplementary material associated with this article can be found, in the online version, at doi:10.1016/j.cclet.2025.111912.
H. Lv, Z. Yang, S.J.H. Ong, et al., Adv. Funct. Mater. 29 (2019) 1900163. doi: 10.1002/adfm.201900163
[3]
N. Qu, G. Xu, Y. Liu, et al., Adv. Funct. Mater. 35 (2025) 2402923. doi: 10.1002/adfm.202402923
[4]
J. Harada, M. Ohtani, Y. Takahashi, T. Inabe, J. Am. Chem. Soc. 137 (2015) 4477–4486. doi: 10.1021/jacs.5b00412
[5]
Y. Zhang, H.Y. Ye, H.L. Cai, Adv. Mater. 26 (2014) 4515–4520. doi: 10.1002/adma.201400806
[6]
F. Kremer, A. Schönhals, Broadband Dielectric Spectroscopy, Springer, Berlin Heidelberg, 2003.
[7]
S. Tsubaki, K. Furusawa, H. Yamada, et al., ACS Sustain. Chem. Eng. 8 (2020) 13593–13599. doi: 10.1021/acssuschemeng.0c05342
[8]
J. Gabriel, F. Pabst, A. Helbling, T. Böhmer, T. Blochowicz, Depolarized dynamic light scattering and dielectric spectroscopy: two perspectives on molecular reorientation in supercooled liquids, in: F. Kremer, A. Loidl (Eds.), The Scaling of Relaxation Processes. Advances in Dielectrics, Springer, Cham, 2018.
[9]
Z. Wang, K. Hu, S. Gao, H. Kobayashi, Adv. Mater. 22 (2010) 1526–1533. doi: 10.1002/adma.200904438
[10]
M. M ˛ aczka, A. G ˛ agor, B. Macalik, et al., Inorg. Chem. 53 (2014) 457–467. doi: 10.1021/ic402425n
[11]
C. Gabriel, S. Gabriel, E.H. Grant, et al., Chem. Soc. Rev. 27 (1998) 213–224. doi: 10.1039/a827213z
[12]
R. Shang, S. Chen, B.W. Wang, Z.M. Wang, S. Gao, Angew. Chem. Int. Ed. 55 (2016) 2097–2100. doi: 10.1002/anie.201510024
[13]
Z. Cheng, R. Wang, Y. Cao, et al., Adv. Funct. Mater. 32 (2022) 2205160. doi: 10.1002/adfm.202205160
Figure 1
Mechanism of reversible dielectric constant and the stability of the metal-formate framework [en][Ni(HCOO)3]2. (a) Regulatory mechanisms at 30 and 110℃. (b) TG–DSC range: 0–400℃. (c) DSC range: 0–150℃. (d) VT-PXRD at 30, 70, and 110℃. (e) XANES spectra of Ni2+, standard NiO, NiO and Ni-foil as references. (f) Differential charge densities of metal-formate framework and wavelet transform maps of Ni2+ at 30 and 110℃ (H: white, C: grey, N: blue, O: red, Ni: green, the value of isosurface: 0.1 e/Å3, purple: positive charge, yellow: negative charge).
Figure 2
Reorientational mobility driven by Hydrogen bond cycle break and reconstruction in the confined space of [en][Ni(HCOO)3]2. (a) VT-FTIR. (b, c) VT-FTIR synchronous and asynchronous correlations spectroscopy. (d) VT 2D-low field 1H NMR spectrum, with the purple bar chart in the lower right corner representing the percentage of peak integration. (e) VT-Raman spectra. (f) Temperature dependence of the full width at half maximum for Raman scattering I2 and I3 peaks. (g) Temperature dependence of the reorientation relaxation time and diffusion coefficients of guest molecules in [en][Ni(HCOO)3]2. (h) Temperature dependence of the ε′ at 107 Hz. (Ⅰ) Mechanism diagram of temperature dependent reorientational mobility of guest molecules.
Figure 3
Temperature dependence electromagnetic parameters of [en][Ni(HCOO)3]2 at gigahertz frequency. (a, b) Dielectric constant ε′ and ε″. (c) Schematic of the components of ε″. (d, e) Conduction loss εc″ and polarization loss εp″ under temperature stimuli. (f) Conductivity of [en][Ni(HCOO)3]2 with temperature rise. (g) Tangent of dielectric loss tanδε with temperature stimuli. (h) Tangent of magnetic loss tanδμ. (i) Magnetic hysteresis loops. (j) RL and ∣Zin/Z0∣of 3 mm at different temperatures.
Figure 4
Factors influencing reversible dielectric constants of AMFF and synergistic effects on metamaterial structures. (a) Comparisons of reversible dielectric constants , and among different AMFFs, for example $\Delta \varepsilon^{\prime}=\left(\varepsilon^{\prime}{ }_{110^{\circ} \mathrm{C}}-\varepsilon^{\prime}{ }_{30^{\circ} \mathrm{C}}\right) / \varepsilon^{\prime}{ }_{30^{\circ} \mathrm{C}}$. (b) Comparison of adjustable RL across different AMFF, the colors beneath the two figures above correspond to the respective AMFF. (c) 3D power loss simulation results at 16 GHz using CST in metamaterial composite model. (d) Comparison between simulation and measurements of RL in the metamaterial composite model. (e) Description of the temperature control system. (f) Temperature fatigue cycle test on the metamaterial composite model, where the material is split and reattached after 2000 cycles, followed by further cyclic testing. (g) Simulation of adjustable RCS in different directions for a 40 cm × 40 cm metamaterial model.


 DownLoad:

 下载:


 下载:

