Citation:
Zicheng Wan, Sisi Lao, Weifeng Zhang, Qiuju Zhang, Ziqi Tian. Convolutional neural network enabled prediction of surface features in CuAgAu alloys[J]. Chinese Chemical Letters,
2026, 37(12): 111911.
doi:
10.1016/j.cclet.2025.111911
Convolutional neural network enabled prediction of surface features in CuAgAu alloys
English
Convolutional neural network enabled prediction of surface features in CuAgAu alloys
Zhejiang Key Laboratory of Advanced Fuel Cells and Electrolyzers Technology, Ningbo Institute of Material Technology and Engineering, Chinese Academy of Sciences, Ningbo 315201, China
b.
Zhejiang Pharmaceutical University, Ningbo 315500, China
c.
School of Materials Science and Chemical Engineering, Ningbo University, Ningbo 313001, China
d.
Faculty of Electrical Engineering and Computer Science, Ningbo University, Ningbo 313001, China
Received Date:
21 July 2025 Accepted Date:
27 September 2025 Revised Date:
23 September 2025 Available Online:
15 December 2026
Abstract:
The rational design of high-performance alloy materials requires a deep understanding of electronic structures, which governs key material properties. The electronic density of states (DOS) is an expression of the electronic structure, normally derived from conventional first principle calculation. However, simulation of multi-component alloy requires consideration of a huge phase space, which is computationally prohibitive. Here, we present a machine learning (ML) combining a modified crystal graph convolutional neural network (CGCNN) and a convolutional neural network (CNN) to predict DOS and related surface features in CuAgAu alloy system. The CGCNN model, trained on 800 calculated structures, predicts site-resolved DOS with mean absolute error below 0.1 and median R2 values approaching 0.98. By integrating predicted DOS with a CNN model, CO adsorption energies on various surface sites were predicted, achieving MAE < 0.05 eV. The integrated model generalizes well to ternary and binary alloy compositions, demonstrating utility in high-throughput screening. This work bridges ML with physical insights, enabling rapid exploration of alloy surfaces for catalytic applications while circumventing computational costs of ab initio methods.
The unique advantages of alloys stem from their ability to surpass the performance of individual metals through the combination of different metallic elements. The application of alloys has permeated virtually every aspect of industry, spanning from robust construction materials to advanced aerospace technologies [1-4]. Especially, alloys are also valuable in catalysis, where they can achieve enhanced catalytic activity, selectivity, and stability [5-9]. In the development of alloy catalysis materials, traditional approaches often rely heavily on empirical trial-and-error methods to determine optimal elemental compositions, resulting in substantial material waste and resource consumption [10-12]. Understanding the intrinsic electronic structure could help to rationalize the design of novel materials. The electronic structure of materials can be described in the term of density of states (DOS), closely related to the macroscopic physical properties and performance, including electrical conductivity, magnetism, and optical characteristics [13-15].
By performing first-principle calculation, DOS of specific atomic structure can be simulated. However, due to the huge microstructure phase space of alloy system, especially the multi-component alloy, the complexity and computational demands present significant obstacles to the first-principle calculation in alloy design. Recently, there has been growing interest in using advanced computational methods to accelerate the prediction of the DOS. Broderick and Rajan utilized principal component analysis (PCA) to extract key features from DOS spectra for single-element crystal systems, ultimately identifying 16 distinct spectral and approximating the DOS of transition metals patterns [16]. Yeo et al. applied PCA for "pattern learning" in multi-component alloy systems to enhance prediction accuracy [17]. More recently, graph-based methods for extracting atomic structural information have been explored, in which crystal structures are represented as graphs and input into graph convolutional networks (GCN) [18]. Park and Wolverton proposed the iCGCNN model, which integrates mosaic information about crystal structures as well as correlations among adjacent atoms [19]. Steph-Yves Louis developed the GATGNN model, which combines enhanced graph attention layers with global attention layers to more effectively predict the properties of inorganic materials [20]. Li utilized GCN to predict the formation energy of crystals for screening stable materials [21].
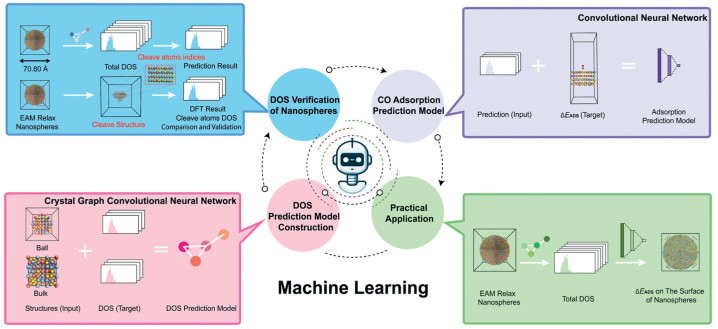
Here, a workflow as illustrated in Fig. 1 is proposed to predict the DOS of alloy system and accelerate the alloy design. The Cu-Ag-Au ternary alloy is taken as a typical system. Based on density functional theory (DFT) calculations of a series of atomic alloy structures, a modified CGCNN model is trained to extract the DOS of the complicated model. In the CGCNN model, the atomic structure is represented as a graph, where nodes encapsulate atomic information, while edges represent interatomic distances. Furthermore, according to the extracted DOS of specific surface site, the CO adsorption energy, a key surface property related to catalytic process, is predicted by using another CNN model. By integrating two machine learning (ML) models, the properties of complex alloy surfaces can be comprehensively characterized.
Figure 1
Figure 1.
Workflow in this work. Construction of DOS prediction model; Verification of the predicted DOS of complex alloy system; Model to predict CO adsorption on the surface; The potential application. ΔEADS denotes to the adsorption energy of carbon monoxide.
In order to consider comprehensive environment of various atoms in the alloy, training datasets were constructed based on both spherical and bulk structures by using the Atomic Simulation Environment [22] and Pymatgen libraries [23]. In all the models, Cu:Ag:Au ratios are 1:1:1. DFT calculations of 400 spherical and 400 bulk models were performed by using Vienna Ab Initio Simulation Package (VASP) 5.4.4 [24]. To test the applicability of the ML models, we further considered large nanoparticles with diameter of 7 nm and containing 10,000–15,000 atoms. The structures of the nanoparticles were optimized using LAMMPS [25] based on embedded atom method (EAM) potentials. Four-layered slab models were extracted from the large particles for CO adsorption calculations, including 250 training samples and 75 testing samples across various alloy compositions to train a ML model.
A CGCNN [26] model was implemented to predict electronic DOS with enhanced computational efficiency. Crystal structures were represented as graphs $\mathcal{G}(V, E)$ with atoms as nodes (V) and bonds as edges (E). Gaussian-expanded interatomic distances were utilized as the edge features. CGCNN workflow operates through sequential processing stages (Fig. S1 in Supporting information). Initially, encoded node and edge feature vectors are transformed using fully connected layers with Parametric ReLU activation. The transformed features are processed through Chebyshev polynomial approximation (ChebConv) to capture higher-order node relationships within the graph structure. Subsequently, a self-attention [27] mechanism is applied after graph convolution layers to enhance extraction of structurally significant features. The graph convolution module updates node features by aggregating information from neighboring atoms through message passing operations. Finally, the model outputs both normalized DOS and scaling factors through a multi-component loss function that incorporates spectral features including band position, width, skewness, kurtosis, and DOS near the Fermi level. Compared to the original model [26], self-attention layers were integrated after graph convolution to improve feature extraction, and the ChebConv was used to capture node relationships. Training was performed using the AdamW optimizer for 800 epochs with a 70:10:20 train/validation/test split. DOS data preprocessing involved Gaussian filtering within −10~10 eV energy range.
With the predicted DOS, other surface properties can be further predicted. As a typical application case, another CNN [28] model was employed to predict the adsorption energy of probe molecule (i.e., CO) based on the predicted DOS of the specific surface sites. DOS spectra of ten metal atoms surrounding specific adsorption sites were processed in the CNN model. Multi-scale average pooling was applied for dimensional transformation, followed by sequential convolutional layers with batch normalization for feature extraction of the DOS spectra. The processed features are averaged to create a unified representation, and the averaged feature map is flattened and passed through three fully connected layers followed by dropout regularization to produce the final prediction of CO adsorption energy. Here to prevent overfitting, dropout layers with rate of 0.2 and reduced average pooling layers were added into the CNN model. The entire process is illustrated in Fig. S2 (Supporting information). The model was trained for 60 epochs with a batch size of 8, using an 80:20 train/test split and the log-cosh loss function.
The performance of the ML models was evaluated using multiple statistical metrics, including the coefficient of determination (R2), mean absolute error (MAE), root mean square error (RMSE), and statistical significance (P-value). The CGCNN and CNN models were implemented using PyTorch and TensorFlow frameworks, respectively. Detailed architectural parameters and computational configurations are provided in Supporting information.
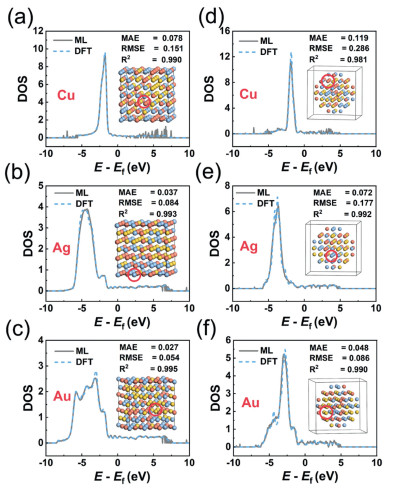
For various alloy models, 200 rounds of hyperparameter optimization were conducted to train a predictive ML model. The hyperparameter search space and the optimized hyperparameters are detailed in Sections S3 and S4 (Supporting information). The predictive performance is illustrated in Fig. 2. The R2 values approach 0.98, with the DFT calculated spectra (the blue dashed lines) and the ML-predicted spectra (the grey lines) almost overlapping. The predicted DOS distribution from the 5th to the 95th percentile was visualized using histograms in Fig. S3 (Supporting information), revealing that the average R2 for the spherical model is lower than that for the bulk model. This discrepancy is primarily attributed to higher errors in regions with lower coordination numbers in the nanoparticle (Fig. S4 in Supporting information). Comparative analyses in Figs. S5-S9 (Supporting information) show that even at the 5th percentile, the distribution remains very close.
Figure 2
Figure 2.
Comparison of the ML-predicted and DFT-calculated DOSs of various structures. (a-c) The projected DOSs of randomly selected Cu, Ag, and Au atoms (marked in the red circles) in the bulk models. Panels (d-f) illustrate the comparison of DOSs in the spherical models.
Our model demonstrates similar performance on both the training set and 5-fold cross-validation (CV), indicating no significant overfitting and robust generalization capability. This model was further compared with other state-of-the-art models (Table S1 in Supporting information), ranging from a linear baseline model (Dummy) to more sophisticated architectures including the local many-body tensor representation (LMBTR) [29], the materials essential graph network (MEGnet) [30], and a message-passing neural network incorporating transformer-based attention mechanisms (Transformer) [27]. One can see that our model achieved the best performance with the lowest errors across all metrics, demonstrating superior accuracy and generalization compared to both baseline and advanced competing methods.
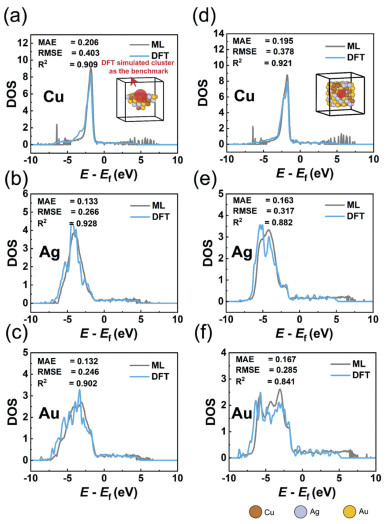
The DOS-predicting model trained on relatively small structures was applied to explore the electronic structure of specific sites in larger structures containing thousands of atoms. An alloy nanoparticle with a diameter of roughly 70 Å was constructed and optimized by using LAMMPS with the EAM potential. The trained model was applied to obtain the DOS of each atom in the entire nanosphere. To simulate the DOS of specific atoms by using DFT as the benchmark, the particle was segmented into surface and core regions, and cluster models were employed. Only the calculated projected DOS of these centered atoms were considered for comparison with ML-predicted spectra. As shown in Fig. 3, Cu, Ag and Au atoms in both the surface and core exhibited R2 values greater than 0.8, demonstrating that the ML-model trained on relatively small structures can well capture the main features of the electronic DOS of this ternary alloy system. Furthermore, five independent models corresponding to the components in the d sub-shell were developed, also demonstrating great consistency in peak features and corresponding energy positions in Fig. S10 (Supporting information).
Figure 3
Figure 3.
The representative comparisons for atoms in (a-c) the surface region and (d-f) the core region. The gray lines represent the predicted values, while the blue lines represent the DFT results.
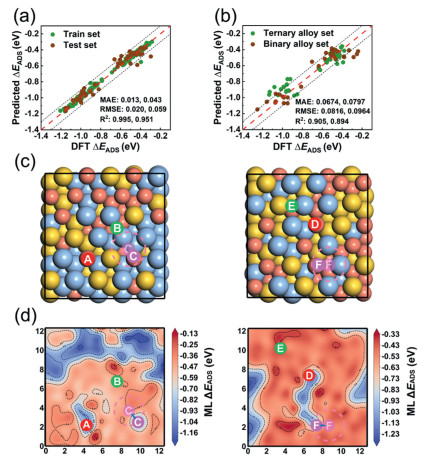
Once the DOS spectrum of specific atom is obtained, various properties can be further derived. For instance, the adsorption energy of CO is a critical descriptor to understand the catalytic performance of the alloy. Herein, a CNN model was trained to predict adsorption energy of CO based on DOS spectrum. By comparing training results obtained with different numbers of considered neighboring atoms, we determined that the closest 10 atoms provide sufficient information for prediction of adsorption energy (Figs. S11 and S12 in Supporting information). As shown in Fig. 4a and Fig. S13 (Supporting information), the predicted CO adsorption energies are nearly identical by using ML-predicted and DFT-calculated DOS spectra, indicating that the ML-predicted DOS spectra reproduce the simulated DOS very well. The MAEs for adsorption energy prediction are both below 0.05 eV, validating the high accuracy of the CNN model. To test the generalization capability of the models, a series of ternary and binary alloy models were constructed, which are different from the structures of the training set. As shown in Fig. 4b, the prediction performance on these newly generated systems is slightly lower compared to the test set, while the MAE remains below 0.1 eV. Thus, our ML model can be effectively used for screening of CO adsorption on the surface of alloys containing Cu, Ag and Au. Our model performs well on these systems similar to the training set and shows fair generalization to other structures, including ternary and binary alloys with varying proportions. For further improvement, additional diverse training data is required to cover complex structural space.
Figure 4
Figure 4.
(a) Comparison of the DFT-calculated CO adsorption energies and the ML-predicted adsorption energies by using ML-derived DOS. (b) The performance of the CNN model for newly created ternary and binary alloys. (c) Surface model of an alloy with complex composition. (d) The contour heatmaps depicting the predicted CO adsorption energies for all sites. Sites A to F denote different adsorption sites.
Moreover, we built alloy surfaces with complex compositions as shown in Fig. 4c. By combining the aforementioned two ML models, the adsorption energies of all the top, bridge, and hollow sites can be readily obtained, which were visualized in scatter plots (Fig. S14 in Supporting information). The temperature data was interpolated over a defined spatial grid using the grid data function with the cubic interpolation method, as illustrated in Fig. 4d. The blue areas indicate strong CO adsorption capacity, which appear more frequently close to Cu. Specifically, six adsorption sites labeled from A to F were further studied by using DFT calculation. After relaxation, CO could stably adsorb at Sites A, B, D, and E, while CO moved to neighboring sites with stronger adsorption from Sites C and F. Detailed structures with CO on various sites are depicted in Figs. S14a and c, with the corresponding DFT-ΔEADS and ML-ΔEADS values in Table S3 (Supporting information).
Compared to direct structure-to-adsorption energy mapping [31-33], our two-step architecture offers enhanced versatility by utilizing DOS as an intermediate representation. This approach enables prediction of multiple properties beyond adsorption energy, including electronic conductivity and magnetic properties. The intermediate DOS representation provides physically interpretable insights into the structure-property relationship, offering crucial understanding for catalytic mechanisms and rational catalyst design.
In summary, we developed an integrated ML workflow to predict the electronic DOS of Cu-Ag-Au ternary alloys and further derived key surface properties, i.e., CO adsorption energy. The modified CGCNN model demonstrated high accuracy (median R2 values approaching 0.98) in predicting DOS, even when trained on small-scale systems and applied to larger nanoparticles (~7 nm). The model effectively captured atomic environment features and electronic structure trends. The following CNN model for CO adsorption energy prediction achieved an MAE below 0.05 eV, validating the reliability of ML-predicted DOS as input. Notably, the workflow identified weak CO adsorption sites near Au/Ag domains and strong adsorption close to Cu, aligning with DFT benchmarks. This approach bridges the gap between electronic structure prediction and catalytic property evaluation, enabling rapid screening of alloy-based electrocatalysts.
All authors declared that there are no conflicts of interest.
Acknowledgments
This work was supported by the National Science Foundation of China (No. 52171022) and the Baima Lake Laboratory Joint Fund of the Zhejiang Provincial Natural Science Foundation of China (No. LBMHZ25B030008).
Supplementary materials
Supplementary material associated with this article can be found, in the online version, at doi:10.1016/j.cclet.2025.111911.
J. Lan, A. Palizhati, M. Shuaibi, et al., npj Comput. Mater. 9 (2023) 172. doi: 10.1038/s41524-023-01121-5
[33]
X. Cao, W. Luo, H. Liu, RSC Adv. 14 (2024) 12235–12246. doi: 10.1039/d4ra00710g
Figure 1
Workflow in this work. Construction of DOS prediction model; Verification of the predicted DOS of complex alloy system; Model to predict CO adsorption on the surface; The potential application. ΔEADS denotes to the adsorption energy of carbon monoxide.
Figure 2
Comparison of the ML-predicted and DFT-calculated DOSs of various structures. (a-c) The projected DOSs of randomly selected Cu, Ag, and Au atoms (marked in the red circles) in the bulk models. Panels (d-f) illustrate the comparison of DOSs in the spherical models.
Figure 3
The representative comparisons for atoms in (a-c) the surface region and (d-f) the core region. The gray lines represent the predicted values, while the blue lines represent the DFT results.
Figure 4
(a) Comparison of the DFT-calculated CO adsorption energies and the ML-predicted adsorption energies by using ML-derived DOS. (b) The performance of the CNN model for newly created ternary and binary alloys. (c) Surface model of an alloy with complex composition. (d) The contour heatmaps depicting the predicted CO adsorption energies for all sites. Sites A to F denote different adsorption sites.


 DownLoad:

 下载:


 下载:

