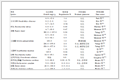
Table 1.
ICP analysis of the metal content in the molecular solid solutions 3–11.

Precise control of the spin-crossover transition temperature in Fe(Ⅲ)/Cr(Ⅲ) molecular solid solutions
Guang-Yan Xu , Shuang Peng , Zi-Han Yan , Ying-Ying Wu , Feng-Lei Yang , Jing-Wei Dai , Zhao-Yang Li


Spin-crossover (SCO) materials are a class of switchable materials capable of undergoing reversible transitions between high-spin (HS) and low-spin (LS) states in response to external stimuli, including temperature, pressure, light, magnetic or electric fields, and chemical agents [1-7]. SCO bistability is accompanied by pronounced changes in the magnetic, optical, structural, and electronic properties of a material [8-13]. Consequently, SCO materials show significant promise for use in applications that include high-density data storage, molecular sensing, display technologies, optoelectronic devices, and quantum information processing [14-21]. However, the practical deployment of most SCO systems is constrained by their limited operating-temperature windows. Therefore, the ability to precisely modulate key SCO parameters, such as the spin-transition temperature (Tc) and magnetic hysteresis, as well as optical-switching characteristics, remains a critical challenge in the field. Strategies to achieve such control include rational molecular design, synthetic-protocol optimization, and crystal engineering [22-26].
Doping methodologies are widely used to fine-tune material properties by incorporating minute quantities of dopants with the aim of modulating characteristics without fundamentally altering the host matrix. Ligand doping, which involves substituting original ligands with derivatives bearing distinct substituents or functional groups, influences the stability of the spin state of the metal center by modifying the ligand field strength and steric constraints [27-31]. For example, in 2024, our group demonstrated that the Tc values of a series of Fe(Ⅲ) solid solutions can be precisely tuned over a 90 K range (227–318 K) by leveraging differences in the electronegativities and ionic radii of Cl and F atoms [30]. While SCO behavior is influenced by ligand field effects and supramolecular interactions, its fundamental origin rests with the electronic configuration of the metal center. This understanding underpins the pivotal metal-ion-dilution strategy for modulating SCO phenomena. Initial studies that employed this approach in the 1970s introduced diamagnetic Zn(Ⅱ) ions into Fe(Ⅱ) SCO systems to reduce the effective Fe(Ⅱ) concentration [32]. In contrast, incorporating inert metal ions into Fe(Ⅱ) lattices has more recently facilitated the construction of molecular solid solutions by modifying the lattice elasticity and intermolecular cooperativity, thereby providing novel pathways for controlling SCO kinetics and thermodynamics [33-40].
Li et al. introduced Zn(Ⅱ) and Ni(Ⅱ) into an Fe(Ⅱ) SCO system and reported markedly distinct outcomes. Zn(Ⅱ), which has an ionic radius comparable to that of HS-Fe(Ⅱ), was found to completely suppress the thermally induced SCO process by stabilizing Fe(Ⅱ) in its HS ground state. Conversely, Ni(Ⅱ), with a radius between those of HS-Fe(Ⅱ) and LS-Fe(Ⅱ), was found to lower the Tc by approximately 20 K and significantly accelerate the SCO relaxation kinetics [33]. Pask et al. investigated Zn(Ⅱ) and Ni(Ⅱ) doping in a 2D layered Fe(Ⅱ) SCO material and revealed that Zn(Ⅱ) doping lowered both the Tc and the change in unit cell volume associated with SCO (ΔVSCO), with a ΔVSCO that approached zero at higher Zn(Ⅱ) concentrations. In comparison, while Ni(Ⅱ) doping had little effect on Tc, ΔVSCO was found to display a complex dependence on the doping ratio [39]. In a pioneering study, Ghosh et al. demonstrated that Ru(Ⅱ) doping reversibly increases the Tc of an Fe(Ⅱ) SCO material. This study revealed that distinct dopant ions modulate the phase-transition temperature and the thermal-expansion behavior of the lattice by altering the local coordination geometry of the iron center and directional lattice elastic interactions. Accordingly, this study challenges the conventional chemical pressure model, which is based solely on ionic size, and provides fresh insight into the precise design of SCO materials via molecular solid-solution engineering [35].
Notably, the aforementioned studies focused predominantly on Fe(Ⅱ) SCO systems and employed dopants to probe and manipulate SCO behavior. In contrast, the potential of metal-ion dilution for modulating SCO properties in Fe(Ⅲ) systems remains largely unexplored; to the best of our knowledge, the formation of molecular solid solutions for this purpose has not been reported. Paramagnetic Cr(Ⅲ) is an intriguing candidate as an Fe(Ⅲ) SCO-material dopant. Cr is in the same period as Fe, and Cr(Ⅲ) has an ionic radius (0.615 Å) comparable to that of Fe(Ⅲ) (HS: 0.645 Å; LS: 0.55 Å); indeed, it is particularly close to that of the HS state.
Here, we report the innovative introduction of paramagnetic Cr(Ⅲ), which itself has no SCO response, into the [FeⅢ(HLCl)(LCl)]·H2O Fe(Ⅲ) SCO complex (1, HLCl = 5-Cl-2-hydroxybenzylidene-hydrazinecarbothioamide). We synthesized the isostructural [CrⅢ(HLCl)(LCl)]·H2O Cr(Ⅲ) analog (2) and a series of {[FeⅢ(HLCl)(LCl)]1-x[CrⅢ(HLCl)(LCl)]x}·H2O solid solutions (3–11, x = 0.1–0.9). Variable-temperature magnetic susceptibility and differential scanning calorimetry (DSC) data revealed that increasing the concentration of the Cr(Ⅲ) dopant systematically shifted the Tc to lower approximately 15 K temperatures and afforded a more gradual spin transition, thereby enabling precise Tc modulation. Single-crystal X-ray diffractometry (SC-XRD) confirmed that 1–11 crystallize in the monoclinic P21/n space group. Structural analysis revealed that Cr(Ⅲ) incorporation increases the distortion of the metal-centered octahedron, which influences magnetic behavior. Density functional theory (DFT) calculations revealed that Cr(Ⅲ) doping stabilizes the HS state and diminishes Fe···Fe cooperativity by modifying local incorporation sites, thereby reducing Tc and slowing spin-transition kinetics. Our findings significantly enhance the prospects of using SCO materials in practical applications, such as data storage, sensing, and displays, by demonstrating a reliable strategy for tailoring their critical transition parameters.
The phase purities and structural characteristics of synthesized samples 1–11 were examined via powder XRD (PXRD) at room temperature in the 5°–50° 2θ range. The PXRD patterns of the samples closely match those simulated from single-crystal structural data (Fig. S1 in Supporting information), confirming that the synthesized compounds were homogeneous. In addition, the PXRD patterns exhibited a gradual shift in the (020) diffraction peak to larger angles with increasing Cr(Ⅲ) content (Fig. S2 in Supporting information), with a total shift of 0.15°. This outcome reveals that the lattice parameters change in response to the introduction of Cr(Ⅲ), which highlights the significant impact that Cr(Ⅲ) doping has on the crystal structure.
The elemental compositions and spatial distributions of the samples were comprehensively analyzed via complementary characterization techniques, including X-ray photoelectron spectroscopy (XPS), scanning electron microscopy augmented with energy dispersive spectroscopy (SEM‒EDS), and inductively coupled plasma optical emission spectroscopy (ICP‒OES), which enabled the molar ratios of Fe(Ⅲ) and Cr(Ⅲ) 3–11 to be quantitatively determined. Table 1 reveals that the measured compositions exhibit deviations of <5% from their theoretical design values, which confirms that Cr(Ⅲ) was uniformly incorporated into the Fe(Ⅲ)-based lattice. The XPS survey spectra show characteristic peaks that correspond to the structural elements and the absence of impurity signals (Fig. S3 in Supporting information), indicative of a pure synthesis process. The Fe 2p high-resolution spectra show 2p3/2 peaks in the 710.5–711.2 eV range, which are typical of Fe3+ (Fig. S4a in Supporting information). The Cr 2p high-resolution spectra (Fig. S4b in Supporting information) show stable 2p3/2 binding energies at 576.3–576.8 eV, which is consistent with the Cr3+ oxidation state. Solid solutions 3–11 were subjected to SEM‒EDS (Fig. S5 in Supporting information), which revealed that Fe and Cr are uniformly distributed on the crystal surface. The Cr(Ⅲ) distribution became more concentrated as the doping ratio x increased, which further confirmed that Cr(Ⅲ) was successfully doped into the system and that a positive correlation existed between the Cr(Ⅲ) distribution and the doping ratio.
 DownLoad:
CSV
| Materials | Experimental (%) | Calculate (%) | |||
| Fe | Cr | Fe | Cr | ||
| 3 | 93.48 | 6.52 | 90.00 | 10.00 | |
| 4 | 81.96 | 18.04 | 80.00 | 20.00 | |
| 5 | 67.24 | 32.76 | 70.00 | 30.00 | |
| 6 | 62.11 | 37.89 | 60.00 | 40.00 | |
| 7 | 46.30 | 53.70 | 50.00 | 50.00 | |
| 8 | 39.83 | 60.17 | 40.00 | 60.00 | |
| 9 | 26.09 | 73.91 | 30.00 | 70.00 | |
| 10 | 23.92 | 76.08 | 20.00 | 80.00 | |
| 11 | 9.22 | 90.78 | 10.00 | 90.00 | |
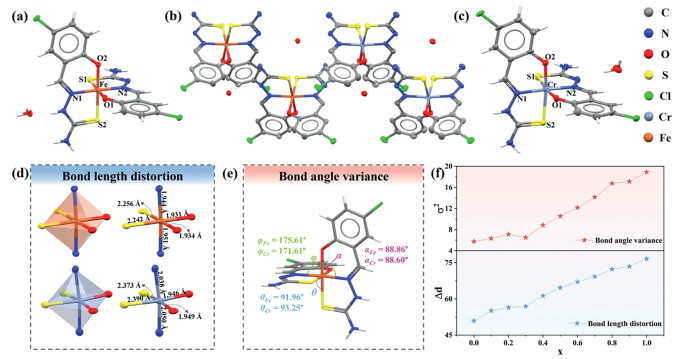
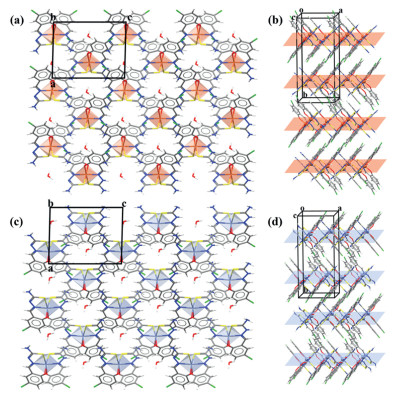
Compound 1 was subjected to single-crystal XRD (SC-XRD) at 100 K, which revealed a monoclinic crystal system within the P21/n space group (Fig. 1a). Similarly, SC-XRD revealed that 2–11 also crystallize in the P21/n space group under the same conditions and share similar structures with 1, thereby highlighting the structural compatibility of the system, which facilitates significant Cr(Ⅲ) doping without altering the fundamental crystal structure (Figs. 1b and c). The 2D layered structures and 3D supramolecular networks of 1 and 2 are shown in Fig. 2. The Fe(Ⅲ) ion in 1 exists in a distorted octahedral environment with N2O2S2 coordination. The bond lengths and angles around the Fe centers in 1 and 2 are labeled in Figs. 1d and e, which reveals that the bond lengths increase and bond angles become more distorted with increasing Cr(Ⅲ) doping. The bond-length distortions (Δd) and bond-angle variances (σ2) were calculated via Eqs. 1 and 2, respectively, and the results of which are presented in Table 2 and Fig. 1f. Octahedral distortion appears to increase significantly in a systematic manner in response to the introduction of Cr(Ⅲ). We hypothesize that octahedral distortion and the spin-state transition temperature are closely related and aimed to verify this notion through further magnetic and chemical investigations to elucidate the mechanism responsible for how octahedral distortion impacts SCO properties.
|
|
(1) |
|
|
(2) |
 DownLoad:
CSV
| Materials | Bond-length distortion | Bond-angle variance |
| 1 | 50.9379 | 5.7448 |
| 3 | 55.1418 | 6.3264 |
| 4 | 56.4574 | 7.0904 |
| 5 | 56.9433 | 6.5033 |
| 6 | 61.332 | 8.8403 |
| 7 | 64.6928 | 10.553 |
| 8 | 67.0749 | 12.179 |
| 9 | 69.3317 | 14.169 |
| 10 | 72.2844 | 16.761 |
| 11 | 73.4558 | 17.134 |
| 2 | 76.6361 | 18.909 |
We conducted systematic variable-temperature magnetic susceptibility measurements via a Quantum Design SQUID MPMS3 magnetometer at an external field of 1000 Oe to gain insight into the SCO characteristics and temperature dependence of this system. These measurements covered the 5–300 K temperature range at a heating/cooling rate of 5 K/min. Compound 1 exhibited a magnetic susceptibility (χMT) of close to 4.5 cm3 K/mol at approximately 300 K, which is consistent with the theoretical value for HS Fe(Ⅲ). Notably, the χMT curve exhibited a significant jump between 226 K (Tc↓, cooling) and 227 K (Tc↑, heating) (Fig. 3a), indicative of a reversible HS‒LS transition that is characteristic of distinct one-step SCO behavior. Compound 2, which only contains Cr(Ⅲ), exhibited pure paramagnetic behavior (Fig. 3b), with an almost temperature-independent χMT value that confirms the absence of SCO behavior.
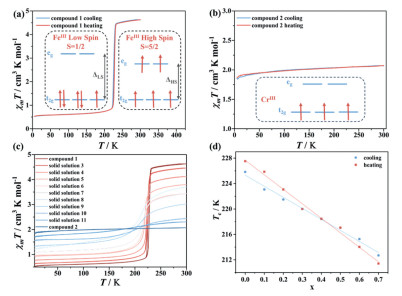
The electronic configurations were analyzed, the results of which are shown in the insets of Figs. 3a and b and highlight the following essential distinctions: (1) Fe(Ⅲ) (d5) exhibits spin-state bistability with HS (t2g3eg2, S = 5/2) and LS (t2g5eg0, S = 1/2) configurations sensitive to the crystal field splitting energy (Δ). (2) Cr(Ⅲ) (d3) maintains a rigid spin state (t2g3eg0, S = 3/2) regardless of the magnitude of Δ owing to a lack of electrons for pairing-induced spin transitions. This fundamental disparity underpins the distinct magnetic behavior of these two systems.
We measured the magnetic susceptibilities of 3‒11 under the same conditions to explore how Cr(Ⅲ) doping affects SCO properties (Fig. 3c). Downward shifts in the transition temperatures with significantly lower Tc values of 223 K (Tc↓) and 226 K (Tc↑) were recorded for x = 0.1. Further increasing the Cr(Ⅲ) content to 20% (x = 0.2) lowered the transition temperature to 221 K (Tc↓) and 223 K (Tc↑), which supports our hypothesis that increasing the Cr(Ⅲ) content lowers the SCO transition temperature. We systematically increased the Cr(Ⅲ) doping ratio and measured the Tc values for each sample, the results of which are summarized in Table 3. However, one-step SCO behavior was incomplete and almost undetectable at Cr(Ⅲ) ratios of 0.8 and 0.9 (10 and 11). Normalizing the variable-temperature magnetic susceptibility curves for 1 and 3‒9 (Fig. S6 in Supporting information) revealed Cr(Ⅲ)-content-dependent systematic changes, with lower Tc values and broader curves observed with increasing content. The Tc values recorded during heating and cooling are presented in Fig. 3d as functions of the doping fraction x.
DownLoad:
CSV
| Materials | x | Tc↓ (K) | Tc↑ (K) | Tpeak↓ (K) | Tpeak↑ (K) |
| 1 | 0 | 225.79 | 227.38 | 225.84 | 227.53 |
| 3 | 0.1 | 223.1 | 225.84 | 223.07 | 225.87 |
| 4 | 0.2 | 221.5 | 223 | 221.49 | 223.07 |
| 5 | 0.3 | 220 | 220 | 220 | 220.01 |
| 6 | 0.4 | 218.5 | 218.5 | 218.46 | 218.46 |
| 7 | 0.5 | 216.8 | 217 | 217.06 | 217.06 |
| 8 | 0.6 | 214.1 | 216.9 | 215.27 | 214.03 |
| 9 | 0.7 | 212.6 | 212.6 | 212.7 | 211.42 |
The DSC curves for samples 1 and 3–9, presented in Fig. 4a, and the variation of their Tpeak values with the doping ratio x, shown in Fig. 4b, reveal Tpeak values that are consistent with the Tc values obtained from the magnetic susceptibility experiments. The exothermic peaks (Tpeak↓) match the cooling transition temperatures (Tc↓), whereas the endothermic peaks (Tpeak↑) correspond to the heating transition temperatures (Tc↑). The thermally induced transition ability was observed to weaken with increasing Cr(Ⅲ) content. Table 3 compares the transition temperatures obtained by DSC and magnetic susceptibility analyses, with consistent trends observed, from which we conclude that the two characterization methods are in good agreement for 1‒11, confirming that the introduction of Cr(Ⅲ) effectively tunes the SCO transition temperature, with precise control enabled by adjusting the doping ratio.
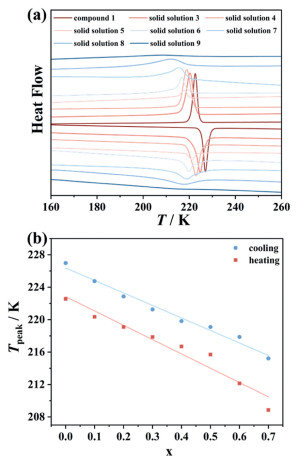
Detailed analysis of the DSC curves revealed that the enthalpy change associated with the SCO transition gradually decreases with increasing Cr(Ⅲ) content, which is likely attributable to the perturbation of the octahedral coordination of the environment around the Fe center by Cr. This perturbation may affect the thermodynamic stability of the spin-state transition and potentially alter the kinetic pathway for the SCO process.
Thermogravimetric analysis (TGA) in an argon atmosphere revealed that samples 1‒11 have similar decomposition profiles at temperatures below 300 ℃ (Fig. S7 in Supporting information), with pristine sample 1 exhibiting skeletal collapse at 300 ℃. The decomposition temperature was observed to increase with increasing x, with a value of 350 ℃ recorded for 2. This thermal behavior suggests that the introduction of Cr(Ⅲ) stabilizes the HS states of these compounds, which is consistent with the magnetic testing results.
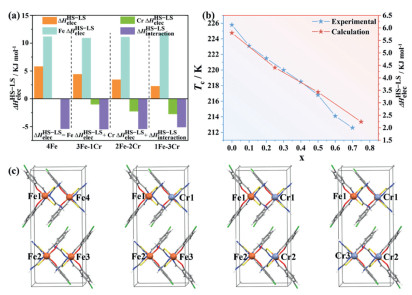
How Cr(Ⅲ) doping impacts SCO behavior was elucidated with the aid of DFT calculations. The computational results show that increasing the Cr(Ⅲ) content leads to a significant reduction in the electronic energy term (
 DownLoad:
CSV
| Parameter | Fe | Cr | ||
| 4Fe | 5.8 | 11.18 | 0 | −5.38 |
| 3Fe-1Cr | 4.41 | 10.93 | −0.99 | −5.53 |
| 2Fe-2Cr | 3.43 | 11.1 | −2.25 | −5.42 |
| 1Fe-3Cr | 2.24 | 11.86 | −2.72 | −5.90 |
This study incorporated paramagnetic Cr(Ⅲ) ions into an Fe(Ⅲ) SCO system to afford {[FeⅢ(HLCl)(LCl)]1-x[CrⅢ(HLCl)(LCl)]x}·H2O (3‒11) as molecular solid solutions. Single-crystal structural analyses confirmed that the doped systems retain the P21/n space group of the parent, with Cr(Ⅲ) doping enhancing octahedral distortion. Magnetic susceptibility measurements and DSC demonstrated that the spin-transition temperature Tc decreases linearly with increasing Cr(Ⅲ) content, whereas the HS state progressively stabilizes, culminating in complete SCO suppression at x = 1. DFT calculations attribute the reduction in Tc to Cr(Ⅲ)-driven electronic effects and lattice strain. Compared with previously studied Fe(Ⅱ) SCO systems, our research shifts the focus to Fe(Ⅲ)-based compounds, in which we report the first successful demonstration of metal ion doping. Notably, incorporation of paramagnetic Cr(Ⅲ) ions into the lattice induces a 15 K shift of the spin transition temperature toward lower temperatures, achieving precise and tunable control over the SCO behavior. This study establishes a novel paradigm for precisely controlling Fe(Ⅲ)-based SCO materials and advances design strategies for polymetallic molecular switches.
Guang-Yan Xu: Writing – original draft, Formal analysis, Data curation. Shuang Peng: Writing – original draft, Formal analysis, Data curation. Zi-Han Yan: Formal analysis. Ying-Ying Wu: Formal analysis, Data curation. Feng-Lei Yang: Software, Methodology. Jing-Wei Dai: Writing – review & editing, Formal analysis. Zhao-Yang Li: Project administration, Conceptualization.
The authors declare that they have no known competing financial interests or personal relationships that could have appeared to influence the work reported in this paper.
We especially thank Nankai University for Startup Funds for Young Talented Researchers. This work was also supported by the National Natural Science Foundation of China (NSFC, Nos. 22275100 and 22301142).
Supplementary material associated with this article can be found, in the online version, at doi:
K.S. Murray, The development of spin-crossover research, Spin-crossover Materials, John Wiley & Sons Ltd., 2013, pp. 1–54.
O. Sato, Nat. Chem. 8 (2016) 644–656. doi: 10.1038/nchem.2547
M. Feng, Z.Y. Ruan, Y.C. Chen, M.L. Tong, Chem. Commun. 56 (2020) 13702–13718. doi: 10.1039/d0cc04202a
Z.Y. Li, Y.Y. Wu, Y. Li, et al., CCS Chem. 34 (2023) 412–422. doi: 10.31635/ccschem.022.202101721
M.K. Javed, A. Sulaiman, M. Yamashita, Z.Y. Li, Coord. Chem. Rev. 467 (2022) 214625. doi: 10.1016/j.ccr.2022.214625
Z.Y. Li, J.W. Dai, M. Damjanović, et al., Angew. Chem. Int. Ed. 58 (2019) 4339–4344. doi: 10.1002/anie.201900789
S.G. Wu, S. Bala, Z.Y. Ruan, et al., Chin. Chem. Lett. 33 (2022) 1381–1384. doi: 10.1016/j.cclet.2021.08.012
M.D. Manrique Juarez, F. Mathieu, V. Shalabaeva, et al., Angew. Chem. Int. Ed. 56 (2017) 8074–8078. doi: 10.1002/anie.201702739
A. Dürrmann, G. Hörner, D. Baabe, et al., Nat. Commun. 15 (2024) 7321. doi: 10.1038/s41467-024-51675-1
S. Kamara, Q.H. Tran, V. Davesne, et al., Adv. Mater. 29 (2017) 1703073. doi: 10.1002/adma.201703073
J.H. Wang, M.K. Javed, J.X. Li, et al., Dalton Trans. 52 (2023) 15510–15517. doi: 10.1039/d3dt01043k
Y.Q. Li, J.W. Dai, M. Wang, M. Yamashita, Z.Y. Li, Cryst. Growth Des. 22 (2022) 4453–4462. doi: 10.1021/acs.cgd.2c00402
N. Wang, H.Z. Hu, Q.Q. Jia, et al., Chin. Chem. Lett. 37 (2026) 111530. doi: 10.1016/j.cclet.2025.111530
A. Holovchenko, J. Dugay, M. Giménez-Marqués, et al., Adv. Mater. 28 (2016) 7228–7233. doi: 10.1002/adma.201600890
H. Li, H. Peng, Curr. Opin. Colloid. Interf. 35 (2018) 9–16. doi: 10.1016/j.cocis.2017.12.007
A. Benchohra, Y.L. Li, L.M. Chamoreau, et al., Angew. Chem. Int. Ed. 60 (2021) 8803–8807. doi: 10.1002/anie.202015994
D. Vinci, K. Ridier, F. Qi, et al., Nat. Commun. 16 (2025) 2043. doi: 10.1038/s41467-025-57202-0
M. Treichel, J. Möller, X. Meng, et al., ACS Nano. 18 (2024) 26184–26191.
C.M. Jureschi, J. Linares, A. Boulmaali, et al., Sensors 16 (2016) 187. doi: 10.3390/s16020187
G. Molnár, S. Rat, L. Salmon, W. Nicolazzi, A. Bousseksou, Adv. Mater. 30 (2018) 1703862. doi: 10.1002/adma.201703862
O. Kahn, C.J. Martinez, Science 279 (1998) 44–48. doi: 10.1126/science.279.5347.44
Y.Y. Wu, G.Y. Xu, Z.H. Yan, et al., J. Am. Chem. Soc. 147 (2025) 14401–14410. doi: 10.1021/jacs.5c00712
C.H. Pham, J. Cirera, F. Paesani, J. Am. Chem. Soc. 138 (2016) 6123–6126. doi: 10.1021/jacs.6b02564
S. Peng, Y. Gao, Z.Y. Zhang, et al., Chin. J. Chem. 43 (2025) 90–96. doi: 10.1002/cjoc.202400859
Y. Li, M.K. Javed, S.Q. Wu, et al., Chin. Chem. Lett. 34 (2023) 107492. doi: 10.1016/j.cclet.2022.05.006
Y.Y. Wu, S. Peng, Z.Y. Zhang, et al., Chin. J. Chem. 42 (2024) 879–886. doi: 10.1002/cjoc.202300679
M. Schmitz, M. Seibel, H. Kelm, et al., Angew. Chem. Int. Ed. 53 (2014) 5988–5992. doi: 10.1002/anie.201310484
S. Xue, A. Rotaru, Y. Garcia, Hyperfine Inter. 240 (2019) 91. doi: 10.1007/s10751-019-1638-z
H.Y. Sun, K.Y. Wang, L. Zhao, et al., Cryst. Growth Des. 25 (2025) 3058–3064. doi: 10.1021/acs.cgd.5c00109
Y.Y. Wu, Z.Y. Li, S. Peng, et al., J. Am. Chem. Soc. 146 (2024) 8206–8215. doi: 10.1021/jacs.3c12905
G. Yang, L. Yu, Z.Y. Ruan, et al., Chin. Chem. Lett. 37 (2026) 111656. doi: 10.1016/j.cclet.2025.111656
P. Guetlich, R. Link, H.G. Steinhaeuser, Inorg. Chem. 17 (1978) 2509–2514. doi: 10.1021/ic50187a035
X. Li, D. Zhang, Y.Q. Qian, et al., J. Am. Chem. Soc. 145 (2023) 9564–9570. doi: 10.1021/jacs.2c13697
C.A. Tovee, C.A. Kilner, J.A. Thomas, M.A. Halcrow, CrystEngComm 11 (2009) 2069–2077. doi: 10.1039/b904528g
P. Ghosh, C.M. Pask, H.B. Vasili, et al., J. Mater. Chem. C 11 (2023) 12570–12582. doi: 10.1039/d3tc02683c
Z. Yu, T. Kuroda-Sowa, H. Kume, et al., Bull. Chem. Soc. Jpn. 82 (2009) 333–337. doi: 10.1246/bcsj.82.333
J. Kusz, D. Schollmeyer, H. Spiering, P. Gütlich, J. Appl. Crystallogr. 38 (2005) 528–536. doi: 10.1107/S0021889805009891
T. Tayagaki, A. Galet, G. Molnár, et al., J. Phys. Chem. B 109 (2005) 14859–14867. doi: 10.1021/jp0521611
C.M. Pask, A.N. Kulak, M.A. Halcrow, Eur. J. Inorg. Chem. 27 (2024) e202400334. doi: 10.1002/ejic.202400334
M.A. Halcrow, Dalton Trans. 53 (2024) 13694–13708. doi: 10.1039/d4dt01855a

Figure 1 Crystal structures of (a) compound 1, (b) solid solution 7, and (c) compound 2. (d) Key bond lengths and (e) bond angles in 1 and 2. (f) Bond-length distortion and bond-angle variance as a function of x for 1–11.

Figure 2 (a) 2D layered structure and (b) 3D supramolecular network of 1. (c) 2D layered structure and (d) 3D supramolecular network of 2.

Figure 3 χMT as a function of temperature for (a) 1 and (b) 2. (c) Temperature dependence of χMT in the range of 5–300 K for compounds 1 and 2 and solid solutions 3–11. (d) Relationships between Tc and the doping fraction x for 1 and 3–9.

Figure 4 (a) DSC curves for 1 and 3–9. (b) Tpeak values as functions of the doping fraction x for 1 and 3–9.

Figure 5
(a) DFT calculations of adiabatic energy gaps (
Table 1. ICP analysis of the metal content in the molecular solid solutions 3–11.
| Materials | Experimental (%) | Calculate (%) | |||
| Fe | Cr | Fe | Cr | ||
| 3 | 93.48 | 6.52 | 90.00 | 10.00 | |
| 4 | 81.96 | 18.04 | 80.00 | 20.00 | |
| 5 | 67.24 | 32.76 | 70.00 | 30.00 | |
| 6 | 62.11 | 37.89 | 60.00 | 40.00 | |
| 7 | 46.30 | 53.70 | 50.00 | 50.00 | |
| 8 | 39.83 | 60.17 | 40.00 | 60.00 | |
| 9 | 26.09 | 73.91 | 30.00 | 70.00 | |
| 10 | 23.92 | 76.08 | 20.00 | 80.00 | |
| 11 | 9.22 | 90.78 | 10.00 | 90.00 | |
 下载: 导出CSV
Table 2. The bond length distortion and bond angle variance ranged from 1 to 11.
| Materials | Bond-length distortion | Bond-angle variance |
| 1 | 50.9379 | 5.7448 |
| 3 | 55.1418 | 6.3264 |
| 4 | 56.4574 | 7.0904 |
| 5 | 56.9433 | 6.5033 |
| 6 | 61.332 | 8.8403 |
| 7 | 64.6928 | 10.553 |
| 8 | 67.0749 | 12.179 |
| 9 | 69.3317 | 14.169 |
| 10 | 72.2844 | 16.761 |
| 11 | 73.4558 | 17.134 |
| 2 | 76.6361 | 18.909 |
下载: 导出CSV
Table 3. The Tc values were determined on the basis of magnetic susceptibility data, and the Tpeak values were determined on the basis of DSC data.
| Materials | x | Tc↓ (K) | Tc↑ (K) | Tpeak↓ (K) | Tpeak↑ (K) |
| 1 | 0 | 225.79 | 227.38 | 225.84 | 227.53 |
| 3 | 0.1 | 223.1 | 225.84 | 223.07 | 225.87 |
| 4 | 0.2 | 221.5 | 223 | 221.49 | 223.07 |
| 5 | 0.3 | 220 | 220 | 220 | 220.01 |
| 6 | 0.4 | 218.5 | 218.5 | 218.46 | 218.46 |
| 7 | 0.5 | 216.8 | 217 | 217.06 | 217.06 |
| 8 | 0.6 | 214.1 | 216.9 | 215.27 | 214.03 |
| 9 | 0.7 | 212.6 | 212.6 | 212.7 | 211.42 |
下载: 导出CSV
Table 4.
DFT calculations of adiabatic energy gaps (
| Parameter | Fe | Cr | ||
| 4Fe | 5.8 | 11.18 | 0 | −5.38 |
| 3Fe-1Cr | 4.41 | 10.93 | −0.99 | −5.53 |
| 2Fe-2Cr | 3.43 | 11.1 | −2.25 | −5.42 |
| 1Fe-3Cr | 2.24 | 11.86 | −2.72 | −5.90 |
下载: 导出CSV

 扫一扫看文章


扫一扫关注我们
 下载: